Introduction
The pitahaya (Hylocereus undatus) is a round oval shaped fruit, 10 to 12 cm in diameter, with numerous small, chewable, black seeds dispersed thoughout the soft white pulp. The peel varies from red to purplish red and is covered by triangular shaped bracts oriented helically. The pulp is sweet, sometimes acidic, with a delicate aroma. It is considered one of the most beautiful fruits in the world because of its attractive and unique external appearance (Centurión et al., 1999). This product has considerable economic importance, prices have reached up 5 USD kg-1 in the international market (Viet and Thanh, 2014; Osuna-Enciso et al., 2016), but is highly perishable. According to Osuna et al. (2011) the storage life of pitahaya fruit is 6 to 10 d when stored between 20 and 26 °C and up to 20 d at 5 °C (Freitas and Mitcham, 2013). Therefore, it is necessary to evaluate practices to optimize postharvest quality (Nerd et al., 1999).
Cold storage is the main method used to slow the deterioration of fresh produce and to maintain nutritional value (Cantín et al., 2010). Nevertheless, cold storage of products of species from tropical and subtropical origin can cause physiological alterations known as chilling injury (CI), negatively affecting product quality and rendering the fruit unmarketable due to tissue deterioration (Wismer, 2003; Soleimani and Bodbodak, 2014). According to Morris (1982), among the symptoms of CI is the alternation of metabolic activity, which causes an increase in anaerobic respiratory intermediaries and other metabolic alterations, resulting in the development of undesirable flavors. Kader (2007) point out that common signs of CI include changes in internal and external color (discoloration, darkening), sunken areas on the exocarp, watery areas, nonuniform or inability to ripen, development of off flavors, and conditions that favor accelerated growth of fungi and other decay-causing organisms. This disorder was studied especially in economically important products such as citrus, avocado and mango (Ramaswamy, 2015). However, research of this physiological disorder in other less important fruit is minor. In pitahaya, studies report assessments CI from subjective variables (whose distribution is discrete) using hedonic scales and tests of nonparametric statistics. There are techniques that were applied in various fruits with some success to reduce or mitigate CI, such as intermittent warming (Wang, 2010; Soleimani and Bodbodak, 2014) or controlled or modified atmosphere (Thompson, 2010; Wang, 2010; Bill et al., 2014). In our research we identify the variables that reflect accurately and reliably the degree of damage. The selection criteria to conform the set of measured variables was to choose those that were related with CI in other studies (Mittler, 2002; Corrales-García and Canché-Canché, 2008; Balois-Morales et al., 2013). Other variables were selected because they can explain this disorder because of their own nature. Within the set of all variables proposed, if any of them is significantly correlated with CI, when increasing the severity of the damage, there will be proportionally greater change in that variable.
Materials and Methods
Harvest and fruit storage
Pitahaya fruits were harvested at comercial maturity in Santa Clara Huiziltepec, Puebla (Mexico). Fruits were transported to the laboratory at ambient temperature (22±4 °C), where they were disinfected for 6 min with running water (pH: 7.72) that was ozonated (690 mL ozone min-1) with an ozone bubbler (FAGON®, model biozo3n 2000). Fruits to be refrigerated (in sanitized plastic crates, with expanded polypropylene and vent openings) were maintained 24 h at 10±2 °C with 90±6 % RH to remove field heat. Afterwards, fruits were stored at 2 or 7±1 °C with 90±6 % RH for 15 or 30 d. After cold storage, fruits were transferred to ambient temperature (22±4 °C with 60±8 % RH) for 7 or 3 d for the fruit stored during 15 or 30 d, respectively. Non-refrigerated fruits (control) were evaluated initially and after 15 d of storage at ambient temperature (22±4 °C). Therefore, eight treatments and two controls were evaluated, and each of them had 4 replications, whose experimental unit was one fruit.
Chilling injury (CI) as reference variable
This evaluation consisted of visual inspection for symptoms of CI in refrigerated and nonrefrigerated fruit. Chilling injury was evaluated on a five points hedonic scale, where 0 = fruit with no injury (0 % injury), 1 = presence of very small and disperse sunken spots on less than 25 % of the fruit surface, 2 = presence of small sunken spots in more than 50 % of the fruit, 3= presence of sunken spots that coalesced, forming beige-colored areas of considerable size on more than 75 % of the fruit surface, and 4 = presence of large coalesced areas of dark spots on more than 75 % of the fruit surface. Fruits with a score of 2 would be considered unmarketable.
Variables
Biochemical variables
Soluble solids were determined on the fruit juice pulp with a digital refractometer (ATAGO®, pocket) with a 0 to 32 % scale at 20 °C, results were reported as % TSS. TA was determined on 10 g of pulp blended in 50 mL distilled water, and titrated with 0.01 N NaOH, the results were reported as g of malic acid 100 g-1 tissue. The TSS/TA ratio was calculated. SOD activity was determined by the method of Balois-Morales et al. (2008), glutathione reductase (GR) by the method of Hodges et al, 1997 and the activity of pyruvate descarboxylase (PDC) and alcohol dehydrogenase (ADH) was determined by methods used by Botondi et al. (2012). SOD was extracted from 0.5 g of frozen pulp homogenized (IKA LABORTECHNIK, T-25, USA) with 5 mL of extraction solution (phosphate buffer, 1M pH 7.8). The mixture was centrifuged in a Sorvall (RC-5B) at 4 °C for 30 min at 22617 G. Absorbance of the supernatant was determined at 560 nm in a digital spectrophotometer (Thermo Fisher Scientific, Genesys 10-S, USA). To 3 mL of phosphate buffer (J. T. Baker) 0.1 M pH 7.8 [with 0.01 mM EDTA, 3.66 mL L-methionine, 2.44 mL NBT and 1.83 mL Triton X-100 (Sigma)] in a final volume of 66 mL), 0.5 mL of supernatant and 0.03 ml of riboflavine (Sigma) were added, and the mixture was illuminated at 21±2 °C for 7 min under a 20 watts Grolux fluorescent lamp and the absorbance was determined. Enzyme activity was calculated as international units per g fresh weight (U g-1). Each unit of SOD is equal to the quantity of supernatant that photoinhibits 50 % formation of formazan from nitro blue tetrazolium. For GR activity, 0.2 g of frozen pulp was homogenized with 5 mL of extraction solution [phosphate buffer, 1M pH 7.8, polyvinylpyrrolidone 1 % (Sigma®)]. The mixture was centrifuged at 4 °C for 30 min at 22617 G. For activity determination, 0.730 mL phosphate buffer (100 mM pH 7.8), 0.1 mL 100 mM glutathione oxide, 0.1 mL 15 mM EDTA, 0.02 mL 10 mM NADPH (Sigma) and 0.05 mL supernatant enzyme extract were placed in a 1 mL quartz cell. Absorbance was measured at 340 nm and GR activity is reported as mM NADPH oxidized g-1 tissue. For analysis of PDC activity, oxidation of NADH was measured as the decrease in absorbance at 340 nm on the spectrophotometer. The opposite reduction reaction was measured for ADH. To obtain enzyme extract, pulp (5) was homogenized with KH2PO4 buffer (10 mL) pH 7.5 containing 2 mM thiamine pyrophosphate (TPP), 2 mM MgCl2 (J.T. Baker) and 1 mM 2-mercaptoethanol. The homogenate was centrifuged at 4 °C for 20 min at 22617 G and the supernatant was used to measure PDC and ADH activities. PDC was measured by coupling the decarboxylation of pyruvate with the oxidation of NADH by ADH. The assay consisted of 0.4 mL of the 100 mM mixture pH 7.5, 0.1 mL 10 mM TPP, 0.1 mL 10 mM MgCl2, 0.1 mL 2.6 mM NADH, 0.1 mL ADH (with 2 U mL-1), 0.1 mL enzyme extract and finally addition of 0.1 mL 200 mM sodium pyruvate (J.T. Baker). ADH activity was determined by the reduction of NAD+ at 340 nm, with 0.680 mL buffer with KOH-100 mM glycine (pH 9.0), 0.07 mL 11.4 mM NAD+, 0.150 mL 2M ethanol (Sigma) and 0.1 mL of enzyme extract. Enzyme activities were reported as µM PDC or ADH mg-1 protein, and they determined by the method Bradford (Bradford, 1976), using bovine albumen (Sigma) for the standard curve; 100 µL of extract in 5 mL of Bradford solution [100 mg of coomassie (Sigma), 50 mL 95 % ethanol (J.T. Baker), and 100 mL of phosphoric acid (J.T. Baker), this solution was diluted to a final volume of 1 L of distilled water], and after 12 min this solution were measured in a digital spectrophotometer at 595 nm.
Physiological variables
Weight loss (the cumulative loss) per fruit was determined (four fruits per treatment) from the initial and final weights on an electronic scale with a precisión of 0.1 g. Ethanol was determined by gas chromatography in headspace samples as described by Davis and Chase, 1969. A sample of 5 g pulp was placed in a 25 mL glass vial and this was immediately sealed, frozen with liquid N2 and stored at -20 °C until analysis. For quantification, the frozen samples were incubated in a water bath at 60 °C for 10 min. The sample was stirred for 1 min (inside the sealed tube) and a 1 mL gaseous aliquot of the headspace was taken with a syringe and injected into a GC (Varian Star 3400, USA) SS column packed with Poropak N, 2 m x 3 mm external and 2 mm internal diameter, equipped with TCD (thermal conductivity detector) and FID (flame ionization detector). Column, injector, auxillary and detector temperatures were 160, 170, 170 and 170 °C, respectively, using He as carrier gas. Calibration curve was prepared with comercial standards (J.T. Baker) and results were reported as mg·100 g-1.
Physical-chemical variable
Electrolyte leakage (EL). This variable was measured with the method of Pérez et al. (2004) with modifications. Four circular pieces of exocarp 2 cm in diameter and approximately 1 mm thick were obtained with a copper cork borer and stainless steel razor, placed in 30 mL distilled water for 24 h in an 80 mL test tube, and electrical conductivity (EC, µS) was measured with a conductivity meter (OAKTON, CON 400 series, Singapore). The tubes were placed in a water bath at 80 °C for 30 min, cooled at 21 °C and EC was measured again. The EC data were used to calculate EL according to the following equation:
where EC1 is initial conductivity and EC 2 is the total conductivity.
EL was reported as % and it reflects damage membrane (Sharom et al., 1994).
Physical variables
Translucency is a change from the characteristic white color of the pitahaya pulp to a watery or translucent appearance upon cutting a transverse section of the fruit at the equator. Translucency was expressed as the percent of pulp that had a translucent appearance. Hue and chroma were evaluated on the exocarp, according to the methology of McGuire (1992) using a colorimeter (Hunter Lab, modelo MiniScanTM XE Plus No. 45/O-L, series 5348, USA). The equations used to calculate hue and chroma were the following:
Exocarp firmness was determined on a texture analyzer (Stable Micro Systems, TA-XT2I, UK) with a 5 kg load cell and, a puncture test was conducted at 20 °C with 2 mm diameter probe (Batch No. 3426) on the fruit surface (at the equatorial section) at a rate of 1 mm·s-1 and to a depth of 5 mm. The results represent the force (N) necessary to penetrate the exocarp.
Statistical analysis
The experimental design was a completely randomized, results were analyzed by ANOVA with mean comparison by Tukey’s test at (p≤0.05) and Spearman correlation between CI and the biochemical, physiological, physico-chemical and physical variables using SAS version 9.1 (SAS, 2006) for Windows. Treatments were: 1) fruits stored 15 d in refrigeration at 2±1 °C; 2) fruits stored 15 d in refrigeration at 2±1 °C and then 7 d at 22±4 °C; 3) fruits stored 15 d in refrigeration at 7±1 °C; 4) fruits stored 15 d in refrigeration at 7±1 °C and then 7 d at 22±4 °C; 5) fruits stored 30 d in refrigeration at 2±1 °C; 6) fruits stored 30 d in refrigeration at 2±1 °C and then 3 d at 22±4 °C; 7) fruits stored 30 d in refrigeration at 7±1 °C; 8) fruits stored 30 d in refrigeration at 7±1 °C and then 3 d at 22±4 °C; as controls, 9) recently harvested fruits; and 10) fruits stored 15 d at 22±4 °C.
Results and Discussion
Chilling injury
No CI symptoms were observed on any of the refrigerated fruit after 15 d of storage, but after holding at ambient temperature (22±4 °C) for 7 d, the fruits previously stored at 2±1 °C showed CI symptoms significantly more severe than those stored at 7±1 °C (Figure 1). After the longer storage period (30 d), fruits at the higher storage temperature still showed no visual CI symptoms, while those refrigerated at 2±1 °C showed maximum CI; this damage did not increase after transfer at ambiente temperature. Fruits previously stored at 7±1 °C had an increase in CI severity, but the injury was still much less than that observed on the fruits stored at 2 °C.
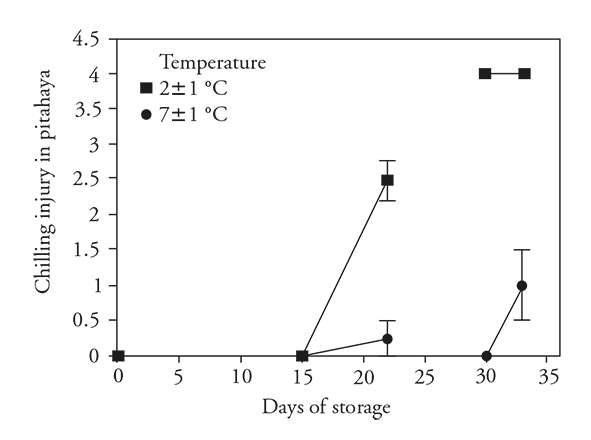
Figure 1 Chilling injury (± standard deviation) in pitahaya fruits (Hylocereus undatus H.) stored 15 d in refrigeration and then 7 d at room temperature or 30 d in refrigeration and then during 3 d at room temperature.
While the fruits were maintained in refrigerated storage during 15 d, the development of those deterioriative processes was avoided. However, after transfer 7 d to ambient conditions, these deteriorative processes were clearly activated and CI symptoms were readily observed. These results are similar to those of Balois-Morales et al. (2013) and Freitas and Mitcham (2013) in which the symptoms of CI were not expressed until after the transfer of the pitahaya fruits from the chilling temperature to a warmer temperature (~20 °C).
Deteriorative processes were also impeded in fruits stored 15 and 30 d at 7±1 °C, but the severity of CI symptoms after transfer to ambient temperature was significantly higher for the longer storage period. The increased period of storage at this moderately low temperature increased the severity of CI. The fruits stored at 2±1 °C for 30 d already had severe sympoms in this condition and, therefore, there was no further symptom development after transfer to ambient temperature.
These results showed that with more stressful conditions (lower temperature or longer exposure to low temperature), the more severe the CI symptoms. Rodriguez-Rodríguez et al. (2005) report increases in CI of Selenicereus megalanthus as storage time increased at 8 °C (until day 23); similarly, Corrales-García and Canché-Canché (2008) point out that CI was more severe in Hylocereus undatus fruit stored at 4 °C for 21 d than in fruits stored for 5, 10 or 16 d.
Titratable acidity (TA)
As expected in stored unrefrigerated fruits, there was a significant decrease in the acidity of pitahaya, consistent with observations of Osuna et al. (2011), Magaña et al. (2013). According to Žnidarčič and Požrl (2006) and Álvarez-Herrera et al. (2009) this decrease in acidity is due to utilization of organic acids in respiratory metabolism or conversion to sugars. Refrigerated storage for 15 d did not change this metabolism (Figure 2), but the decrease was less than that observed in unrefrigerated fruit, suggesting that refrigeration reduced loss of acidity by reducing metabolism (Wismer, 2003). Additionally, it was found that upon transfer of fruits to ambient temperature, acidity was increased.
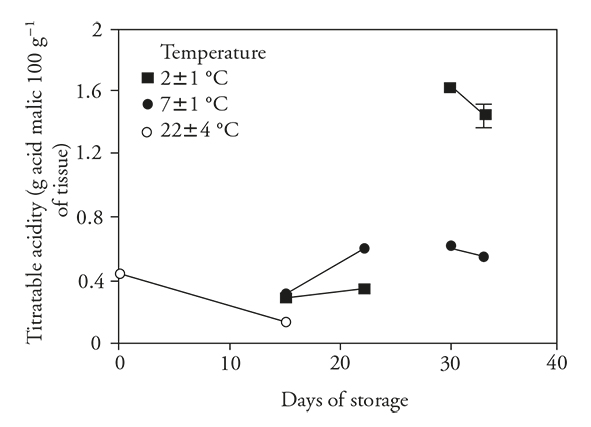
Figure 2 Titratable acidity (± standard deviation) in fruits of pitahaya (Hylocereus undatus H.) stored 15 d at room temperature (o) or stored 15 d in refrigeration and then 7 d at room temperature; 30 d in refrigeration and then 3 d at room temperature.
Although TA decreased after 15 d, there was an important increase in acidity in fruits stored under refrigeration for 30 d. The increase in TA was far greater in fruits stored at 2±1°C than 7±1°C. When fruits were transferred to ambient conditions, acidity decreased in both groups.
During refrigerated storage and associated with reduced respiratory metabolism, the pitahaya accumulated organic acids. Then, with the transfer to ambient conditions, there was a further accumulation of organic acids in some cases (15 d at 7±1 °C), perhaps due to inhibition of malate dehydrogenase enzyme (in Krebs cycle), which is susceptible to removal from mitochondria of chilled fruits, as sweet potato (Kozukue and Ogata, 1972; Famiani et al., 2015).
Based on the results presented here and that reported by Wang (1994), an increase in TA during refrigerated storage could be interpreted as a clear symptom of CI. A similar result was reported by Thorne and Efiuvwevwere (1988), who found an increase in TA in fruits of Lycopersicon esculentum Mill during storage at chilling temperatures (lower than 13 °C). Navarro-López et al. (2012) found that TA of tomatoes increased more in fruits stored 30 d at 4 °C than at 10 °C. In our study, a positive correlation (r s =0.61) was obtained between TA and CI for pitahaya, and this variable can be a useful indicator to measure CI in pitahaya (Table 1).
Table 1 Correlation between chilling injury (CI) symptoms and response variables (biochemical, physiological, physical-chemical, and physical) in pitahaya fruits held in refrigerated (15 or 30 d at 2 ou 7 +/- 1oC, with 90 +/- 6% RH) and unrefrigerated (0 or 15 d at 22 +/- at 22 +/- 4oC, with 60+/- 8% RH) storage
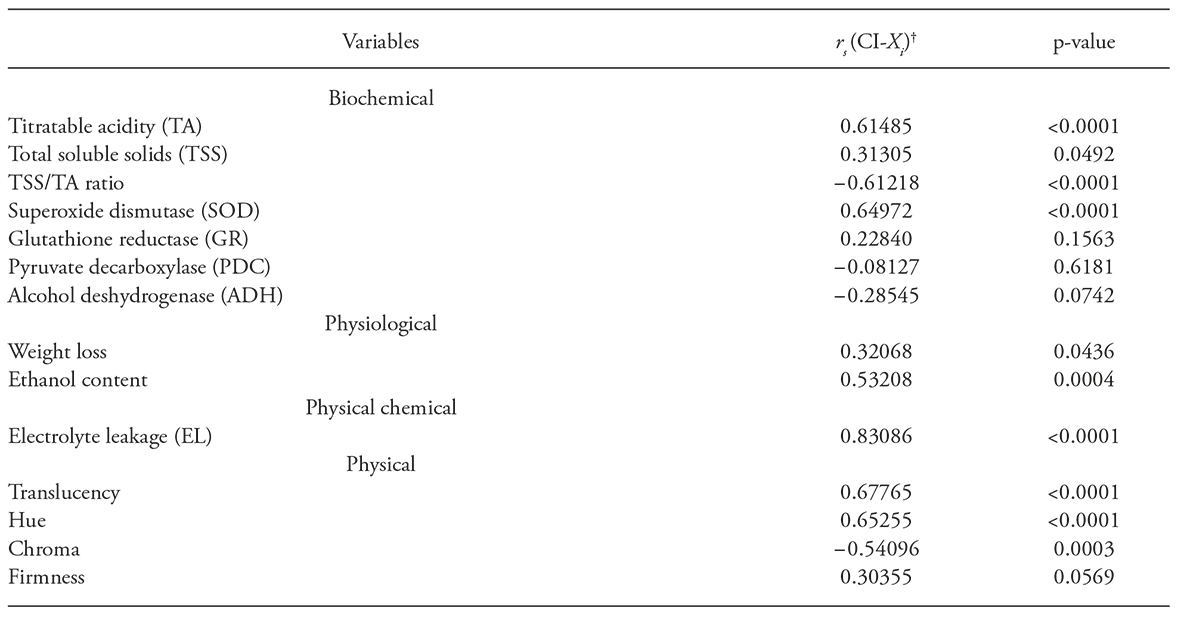
†rs: Spearman correlation; CI: chilling injury; Xi: variable response.
Total soluble solids
Higher values of TSS (above the initials ones) were obtained at the lower temperature (2 °C, Table 2). This may be related to hydrolysis of mucilage of the fruit, which causes the soluble solids increase, like it occurs in cactus pear (Lakshminarayana et al., 1979). Similar increases (20 % in fruits stored 15 d at 8 °C) one reported by Rodriguez-Rodríguez et al. (2005) in fruits of Selenicereus megalanthus. In adition, fruits of Hylocereus undatus stored at 4 °C showed higher values of TSS than those in fruits stored at 13 °C (Centurión et al., 1999); these authors point out the possible relationship of the SST with CI. However, in our study no significant correlation was found between these variables.
Table 2 Response of total soluble solid (TSS), TSS/TA ratio; enzyme activity glutathione reductase (GR), pyruvate decarboxylase (PDC), and alcohol dehydrogenase (ADH); weightloss, hue, chroma and firmness in pitahaya fruits stored during 15 and 30 d (at 2 and 7oC) or stored at these temperatures plus a period of 7 and 3, d respectively, at room temperature (22oC). Two controls were included (initial and 15 d at 22oC).
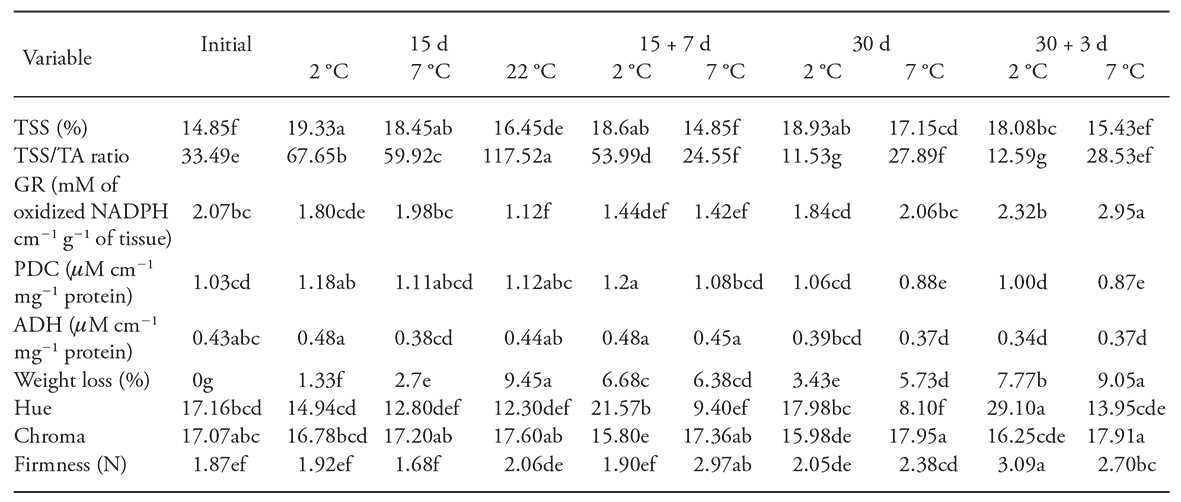
Each value is the average of four replicates; treatments with different letters in a row are statistically different (p≤0.05).
TSS/TA ratio
The control pitahaya fruits (before cold storage) showed an average value of TSS / TA ratio of 33.49 and after 15 d of storage this value was significantly increased, independent of temperature. However, when the storage period was increased (30 d) a large decline in the values of this variable was observed (below the reference values), which it was considered as a negative effect, since the TSS/TA ratio was proposed as an indicator of good taste and quality of pitahaya, particularly when this variable has a value of 40 (Nerd et al 1999; To et al., 2002). In our study it is remarkable that as the storage period increased (30d), particularly at 2 °C, lower TSS/TA ratio was obtained, which suggest that these conditions were related with CI (r s = 0.61).
Superoxide dismutase activity
The SOD activity increased over 15 d in the unrefrigerated as well as the refrigerated fruits (Figure 3), although the increase in activity in the latter fruits was not as notable. There was a further marked increase in SOD activity when fruits were transferred from refrigeration to ambient conditions.
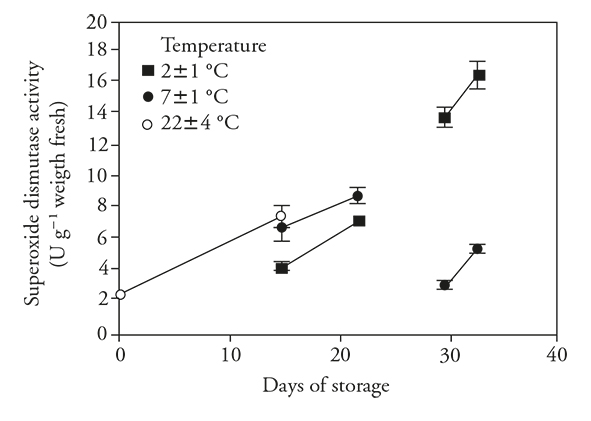
Figure 3 Superoxide dismutase enzyme activity (± standard deviation) in fruits of pitahaya (Hylocereus undatus H.) stored during 15 d at room temperature (o) or stored during 15 d in refrigeration and then during 7 d at room temperature; 30 d in refrigeration and then 3 d at room temperature.
With prolonged storage for 30 d at 2±1 °C, there was an important increase in SOD activity, whereas activity was stable in fruits stored at 7±1 °C. After the transfer period, there was increased SOD activity in fruits stored at both temperatures, with greater activity in fruits transferred from 2±1 °C to ambient temperature. The activity of this enzyme could be stimulated by the presence of toxic reactive oxygen species (ROS), such as superoxide radicals, hydrogen peroxide, hydroxyl radicals and simple oxygen (Mittler, 2002). This was observed in other products of tropical and subtropical origin stored in refrigeration (Aquino-Bolaños y Mercado-Silva, 2004).
An increase in SOD activity was reported in rambutan stored at 10 °C (Shao et al., 2013) and in pitahayas stored for 21 d at 3 °C and then held 4 d at 22 °C (Balois-Morales et al., 2007). With these antecedents and the positive correlation between CI and SOD activity (r s=0.65), high SOD activity can be proposed as a chilling stress index and is a variable useful to measure CI.
Glutathione reductase
Although GR activity is related to the CI tolerance, by eliminating of ROS (Soleimani and Bodbodak, 2014), the results of our research show that GR activity is not significantly correlated with CI (Table 2), since the fruits (30 d of storage at 7 °C plus 3 d at 22±4 °C) with the highest GR activity were not the most damaged, and those with highest damage maintained an GR activity similar to that in freshly harvested fruits. These results are contrary to those reported in mangoes (Wang et al., 2008) and peaches (Wang et al., 2006), because these have showed low activity of the GR under conditions of CI.
Pyruvate decarboxylase
The PDC enzyme activity showed no significant correlation with CI, because the fruit with the most CI showed similar activity (low) to the initial (Table 2). However, an increase after 15 d of refrigerated storage was observed, even at room temperature. In fact, the increase in PDC activity is natural behavior in ripening of orange (Bruemmer and Roe, 1985) and strawberry (Moyano et al., 2004). These results allow to conclude that although the PDC promotes fermentation pathway in response to biotic and abiotic stress (Tadege et al., 1999), not with a consistent variable to measure the DF in the pitahaya.
Alcohol deshydrogenase
Since ADH is the resposable of reduction of acetaldehyde to ethanol (Botondi et al, 2012), it was also expected a correlation of ADH activity with CI; however, this correlation was not observed. It was notable that the storage period showed a greater effect, since the fruits stored a period longer than (30 d) showed lower activity (Table 2). Apparently, in the early days of storage (after 15 d) the antioxidant system was active; however, when the cold storage was prolonged (after 30 d), this could have stopped the ADH activity (Botondi et al., 2012). In accordance with the above, the induction of ADH gene expression mainly after the onset of ripening in both tomatoes and grape berries is a potential regulator of ethanol production in response to a ripening-related cue (Or et al., 2000).
Weight loss
Weight loss increased when the storage period was prolonged, and when the fruits were transferred to room temperature the weight loss was even greater (Table 2). This was caused by the higher vapor pressure deficit in room temperature than in cold storage (Muy et al., 2004), and not by the DF. These results are consistent with those reported by Magaña et al. (2004), who found that weight loss was increasing with time cold storage (up to 24 % weight loss at 8 °C) and with time of the storage period post-cooling (3 and 6 d at 26±2 °C: 9.43 and 13.8 %, respectively).
Ethanol concentration
During refrigerated storage, ethanol conceentrations did not increase relative to those of nonrefrigerated fruits (Figure 4). There was no increase either when fruits were transferred to room temperature after 15 d refrigeration. However, transfer after 30 d of storage resulted in large increases in ethanol concentrations in fruits at both storage temperatures. Changes in ethanol concentrations indicate that the low temperatures were not stressful for a short period, but they were stressful for the prolonged 30 d period.
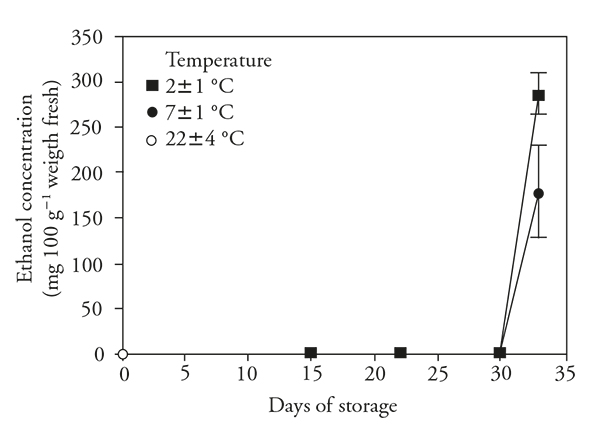
Figure 4 Ethanol concentration (± standard deviation) in fruits of pitahaya (Hylocereus undatus H.) stored 15 d at room temperature (o) or stored 15 d in refrigeration and then 7 d at room temperature; 30 d in refrigeration and then 3 d at room temperature.
When fruits were transferred from low to warmer temperature, anaerobic metabolism was possibly activated (reactivation of PDC and ADH), because the ethanol concentrations were signficantly higher 3 d after transfer, especially in the fruits previously stored at 2±1 °C. This suggests that higher production of this metabolite was due to the combination of the longer storage period and the low temperature. Increased ethanol concentrations in fruits stored for long periods at low temperatures were reported by García et al. (2005) en Cucumis melo, Corrales-García and Canché-Canché (2008) in H. undatus and Tietel et al. (2010) in Citrus reticulata.
Since the increase in ethanol occured only under ambient conditions after 30 d of storage, it indicates that production was inhibited under refrigeration and favored at ambient temperature. This was reported to occur in pitahaya (Corrales-García and Canché-Canché, 2008).
Ethanol and acetaldehyde are studied as products of anaerobic metabolism, since they are produced when fruits are held under low oxygen conditions (Kennedy et al., 1992; Geigenberger, 2003). Nevertheless, Kimmerer y Koslowski (1982) determined that the production of acetaldehyde and ethanol occured not only in response to restricted oxygen availability, but also can be activated when fruits are subjected to other types of stress. Forney and Jordan (1996) proposed that the accumulation of these metabolites could be a posible indicator of CI.
Based on these reports and the evidence of ethanol production after prolonged storage of pithaya at low temperatures, the fruits likely suffered stress and consequently were damaged by the cold. Spearman correlation also suggests a positive correlation (rs =0.53) between CI and ethanol production in the pitahaya.
Electrolyte leakage
There was a signficant increase in EL in exocarp in nonrefrigerated fruits (Figure 5), and this change likely corresponds to a natural process and evidence of senescence in the fruits. These changes in EL imply an irreversible physiological disorder. This variable was stable in the refrigerated fruits, avoiding the apparent onset of senescence. Nevertheless, upon transfer to 22±4 °C, EL increased, suggesting that the change from low temperatures (2 or 7±1 °C) to ambient conditions caused the manifestation of this membrane damage.
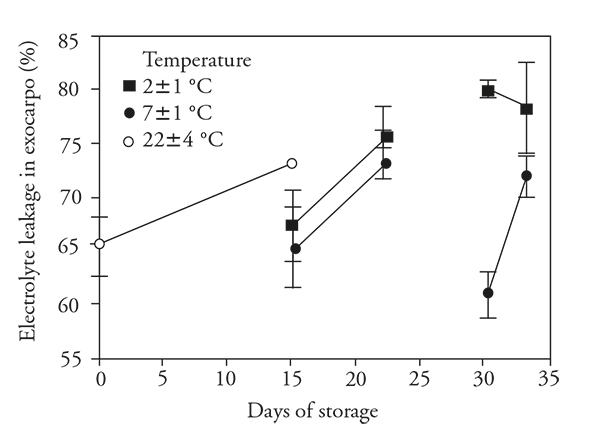
Figure 5 Electrolyte leakage (± standard deviation) in exocarpo of fruits of pitahaya (Hylocereus undatus H.) stored 15 d at room temperature or stored 15 d in refrigeration and then 7 d at room temperature; 30 d in refrigeration and then 3 d at room temperature.
The EL of the exocarp of fruits stored at either low temperature, for 15 d remained similar to that of the recently harvested fruits. However with storage for 30 d, there was a significant increase in the fruits stored at 2±1 °C, whereas EL of those stored at 7±1 °C remained low; this suggest that damage occured in the fruits stored at the lower temperature. During the transfer period of fruits previously stored at 2±1 °C, EL remained elevated but with no furhter increase, whereas there was a moderate increase in EL of fruits stored at 7±1 °C. This suggests that the fruits stored at 7±1 °C did not suffer much stress since EL was at a level similar to that shown by the nonrefrigerated fruit, whereas the fruit stored at 2±1 °C were unable to maintain membrane integrity at that low temperature.
Electrolyte leakage is very important because when it is sufficently low metabolic stability is assured. However, an increase in EL can be damaging because it favors an increase in constituents in the cytoplasm that can inhibit cellular functions, likely as uncoupling factors in oxidative phosphorylation. An increase in EL is undesirable and such increment can be interpreted as an indicator of CI since it was highly correlated with CI (rs =0.83) in our study.
The results of our study are consistent with those of Pérez et al., 2004 and Dea et al., (2010), in which an increase in EL, electrical conductivity or loss of electrolytes was an indicator of the membrane damage (Sharom et al., 1994). This possibly occurred as a result of CI, since EL, electrical conductivity or loss of electrolytes also increased signfiicantly in other fruits stored at low temperatura that suffered chilling injury such as pomegranate (Ramezanian et al., 2010) and mango (Dea et al., (2010). The increase in conductivity of pitahaya exocarp can be a reliable variable to determine if the fruit is chill damaged and to what extent.
Translucency
Translucency increased in fruits stored 15 d at ambient temperature (22 ± 4 °C). Similarly, fruit stored under both conditions of refrigeration showed increment translucency, but the increase was less than that observed at ambient stored fruits (Figure 6). Refrigeration appeared to reduce this defect. Upon transfer to ambient conditions, only the fruit previously stored at 2±1 °C had a further increase in translucency.
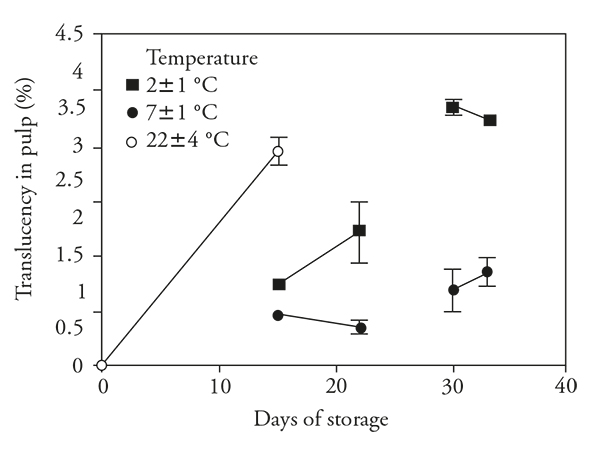
Figure 6 Translucency (± standard deviation) in fruits of pitahaya (Hylocereus undatus H.) stored during 15 d at room temperature (o) or stored during 15 d in refrigeration and then 7 d at room temperature; 30 d in refrigeration and then 3 d at room temperature.
In fruits stored at 7±1 °C for 30 d, there was a minor increase in translucency during storage and a further minor increase after transfer. With fruit stored at 2±1 °C for 30 d, there was maximum development of translucency while still at storage conditions. This can be considered a stress response caused by the low storage temperature and can be related to the changes in EL and its consequences for normal cellular functioning as discussed previously. This resulted in a change in the pulp from a characteristic white color to the translucent appearance. According to Soler (1994), translucency is caused by the dissappearance of the gaseous intercellular spaces in the pulp.
The elevated level of translucency in fruits stored at 2±1 °C, a temperature that causes symptoms of CI in pitahaya, indicates that it is associated with the manifestation of this disorder. Translucency was positively correlated (r s =0.68) with CI and is a variable that can be used to identify the onset of CI in pitahaya.
Nerd et al. (1999) report that translucency was a symptom of chilling injury in pitahaya as well as softening, sunken areas, darkening and loss of flavor. These authors also point out that these symptoms develop rapidly when fruits of H. undatus and H. polyhizus were stored at 6 °C for 2 weeks and then held at 20 °C. Elevated translucency was described in pitahaya fruits stored at 4 y 6 °C (To et al., 2002) and 5 °C (Freitas and Mitcham, 2013), and translucency was also reported in other fruits susceptible to CI (Raimbault et al., 2011 and Singh and Singh, 2013).
Hue angle (solid color)
Fruits with the highest CI showed the highest hue angle (except the fruit stored at 7 ° C during 15 d and an additional period of 7 d at 22±4 °C) (Table 2); this suggests a tendency to orange colorations, in detriment of red color. This is logical, because low temperatures cause irregular ripening (Kader, 2007) and thus, an alteration of color. Although it was obtained a positive correlation (r s =0.65) between the hue angle and DF, according to information previously evaluated in this study, it was found this variable is not reliable for measuring CI in pitahayas.
Chroma
This variable decreased when the fruits were stored at 2 °C, independently of the storage period (Table 2). This suggests that the red color lost purity, which affects the quality; however, not all of these fruits showed CI. Although Corrales-García and Canché-Canche (2008) proposed that the inability of pitahayas to increase color saturation could be interpreted as a manifestation of CI, as the variable mentioned, it is not possible to confirm their reliability to assess CI.
Firmness
The increases in firmness were related to the storage period (Table 2), which could be due to moisture loss or the manner to determine firmness. These results are contrary to those reported by Balois-Morales et al. (2013), a who found that the firmness is feature stable in pitahaya during the cold and room temperature storage.
Conclusions
The variables consistently and positively correlated with CI were TA, SOD, ethanol content, EL, and translucency. Therefore, as severity of the damage (lower temperature and longer storage period), was increased there was a proportionally greater change in these variables. The expression of correlated variables was observed when fruits were transferred to ambient temperature after the refrigerated storage periods (15 or 30 d).


 texto en


