


 nueva página del texto (beta)
 Inglés (pdf)
 Artículo en XML
 Referencias del artículo
 Enviar artículo por email
 Citado por SciELO
  Similares en
SciELO
Similares en
SciELO 
 Permalink
The rising prevalence of childhood obesity is increasingly recognized as one of the most critical risk factors for the development of cardiovascular diseases (CVD)1. Obesity is commonly related to oxidative stress, inflammatory response, sympathetic vasomotor hyperactivity, and decreased parasympathetic modulation, leading to developing hypertension and metabolic syndrome in children by impairing beta-adrenergic signaling and insulin sensitivity2.
The early heart rate (HR) changes are strongly related to vagal modulation during the rest-to-exercise transition. This mechanism allows resetting the arterial baroreflex to a higher operating point, which is critical for a better redistribution of the cardiac output toward the contracting muscles during exercise3. These mechanisms have also been shown to be impaired in individuals with cardiovascular and metabolic diseases4. Nonetheless, it is not clear if these physiological disturbances appear before adulthood. Besides, knowledge is scarce regarding the effects of obesity on autonomic modulation during exercise in children.
This pilot study, then, aimed to evaluate the HR response during the rest-to-exercise transition in obese and non-obese children.
This cross-sectional study selected 19 eutrophic and 19 obese children aged 8-12 years of a private school in Concepción, Chile. Children with antecedents of any chronic or acute condition before the enrollment (4 weeks) were excluded from the study. Obese and non-obese children were matched by age and sex. The study was performed at the participant's school, and all measurements were performed on the same day between 2.00 pm and 5.00 pm.
The research protocol was approved by the ethics committee of the Faculty of Medicine, University of Concepción Chile (Protocol: CEC64/2018).
Anthropometric variables were measured using a bioelectrical impedance analyzer (InBody 270) and a measurement tape (centimeters). The body mass index (BMI) was calculated as kg/m2, and obesity was defined as a BMI between the 95th and 97th percentiles5.
Baseline heart rate (HR) and blood pressure (BP) were measured in supine position after 10- min rest. Heart rate and RR intervals (RR) were recorded in the supine position for 10 min by a Polar H7 sensor connected to a portable HR monitor (HRM) (Polar V800, Kempele, Finland).
For heart rate variability (HRV) analysis, a 5-min period of steady-state data with a minimum of 256 RR was only considered. Then, the RR recordings were downloaded from the manufacturer's website (PolarFlow.com) and exported to Kubios HRV software for time and frequency domain analyses, as recommended by Rodríguez-Núñez et al6.
The vagal modulation in the rest-to-exercise transition was evaluated by the 4-s exercise test (4-sET), following the protocol published by Araujo et al7. Briefly, each participant was adequately seated on a static cycle ergometer. Once HR returned to a level similar to the basal, 4sET was performed. Volunteers were then given standardized verbal instruction regarding the procedure, which includes four-step performed at the verbal command of the examiner: (1) a quick maximal inspiratory apnea maintained for 12s, (2) at the end of the 4th s of apnea, the participant starts to pedal as fast as possible for 4 s without any resistance being added to the cycle ergometer, (3) at the end of the 8th s, leg movement is interrupted wholly and rapidly, with the subject still in apnea, and (4) finally, at the end of 12th s, the subject exhale and breathe freely again7. This sequence was repeated until two technically correct exercise cycles were performed.
The RR was measured during the entire test execution and then downloaded and exported to
Kubios software to calculate the cardiac vagal index (CVI), which corresponds to a
dimensionless variable reflecting the vagal tone loss induced by rapid response to
exercise. CVI was calculated as the ratio of two RR as follow,  (RRB: the RR immediately before
exercise; RRE: the shortest RR during exercise)7,8.
(RRB: the RR immediately before
exercise; RRE: the shortest RR during exercise)7,8.
Descriptive statistics were expressed as mean and standard deviation or median and the range between percentile 25 and 75 (interquartile range [IQr]) according to the normality of data. Then, the comparisons of quantitative variables with normal distribution were analyzed by Student t-test. The non-parametric equivalent test (U-Mann-Whitney test) was used to analyze variables with non-normal distribution. Statistical analyses were performed with Graph Pad Prism 5.0 (San Diego, USA) software. The significance level adopted was p < 0.05.
There was no statistical difference between groups in age, sex, cardiovascular parameters, and HRV indexes (Table 1). The median weight of obese children was 55,0 kg, while the weight of eutrophic children was 36,2 kg (p = 0.0001).
Table 1 General characteristics of subjects
| Variables | Non-obese (n = 19) | Obese (n = 19) | p-value |
|---|---|---|---|
| Biodemographic variables | |||
| Age, years | 10.4 ± 1.7 | 10.6 ± 1.8 | 0.66 |
| Sex, n boys (%) | 13 (68.4) | 12 (63.2) | 0.73 |
| Height, cm | 138.8 ± 13.4 | 144.2 ± 12.7 | 0.21 |
| Weight, kg | 36.2 (27.7-42.5)a | 55.0 (42.7-62.4)a | 0.0001* |
| BMI, kg/m2 | 17.7 (16.6-19.4)a | 24.4 (23.8-27.7)a | < 0.0001* |
| % Fat mass | 7.5 (4.9-9.8)a | 18.4 (16.3-24.6)a | < 0.0001* |
| WC, cm | 63.4 ± 7.8 | 81.2 ± 11.6 | < 0.0001* |
| Baseline cardiovascular variables | |||
| Rest HR. bpm | 93.4 ± 18.2 | 88.9 ± 10.0 | 0.53 |
| Rest SBP. mmHg | 111.4 ± 10.3 | 112.6 ± 11.7 | 0.75 |
| Rest DBP. mmHg | 74.7 ± 8.9 | 73.0 ± 9.2 | 0.55 |
| Rest MAP. mmHg | 74.5 ± 7.7 | 74.0 ± 8.2 | 0.85 |
| R-R interval. ms | 664.1 ± 121.5 | 683.1 ± 73.5 | 0.56 |
| rMSSD. ms | 44.7 (22.5-68.3.1)a | 35.9 (26.8-50.4)a | 0.45 |
| NN 50. n | 56.0 (19.0-178.0)a | 59.0 (24.8-114.3)a | 0.69 |
| pNN 50. % | 11.7 (3.7-40.8)a | 12.9 (5.3-26.9)a | 0.74 |
| LF. ms2 | 747.1 (424.4-2483.2)a | 649.4 (434.7-1155.2)a | 0.56 |
| LF. nu | 55.6 ± 18.1 | 59.4 ± 15.2 | 0.63 |
| HF. ms2 | 517.3 (265.7-3186.8)a | 447.8 (283.5-1001.9)a | 0.43 |
| HF. nu | 44.2 ± 18.0 | 40.7 ± 15.2 | 0.51 |
| LF/HF | 1.3 (0.7-2.1)a | 1.5 (1.0-2.0)a | 0.63 |
BMI: body mass index; HR: heart rate; SBP: systolic blood pressure; DBP: diastolic blood pressure; MAP: meanarterial pressure; FEV: forced expiratory volume;
FVC: forced vital capacity; FEF: forced expiratory flow; rMSSD: the square root of the mean squared differences of successive NN intervals; SDNN: the standard deviation of the NN interval; NN50: the number of interval differences of successive NN intervals greater than 50 ms; pNN50: the proportion derived by dividing NN50 by the total number of NN intervals; LF: spectral component of low frequency; HF: spectral component of high frequency; LF/HF: rate between LFand HF. Resultsare expressed in meanand standard deviation.
aResults are expressed in medianand interquartile range.
*Significant differences.
Regarding the autonomic modulation during exercise, obese children presented an attenuated RR change during the rest-to-exercise transition, as presented in figure 1. The value of CVI in the obese individuals was 1.03 ± 0.02 and in the non-obese ones was 1.14 ± 0.03 (p = 0.0054) (Fig. 2).
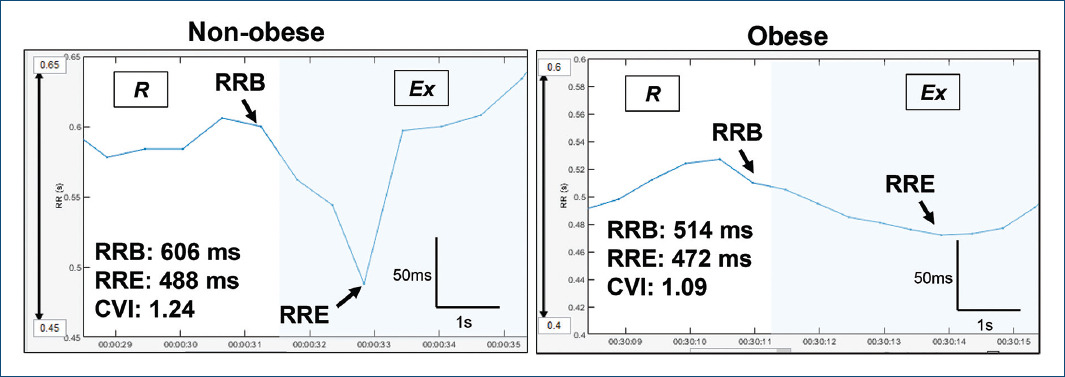
Figure 1 Tachogram of representative cases of an obese and non-obese child during the 4-s exercise test (6-s RR recording). RRB: RR interval just before the onset of exercise; RRE: The lowest RR interval during 4 s of exercise.
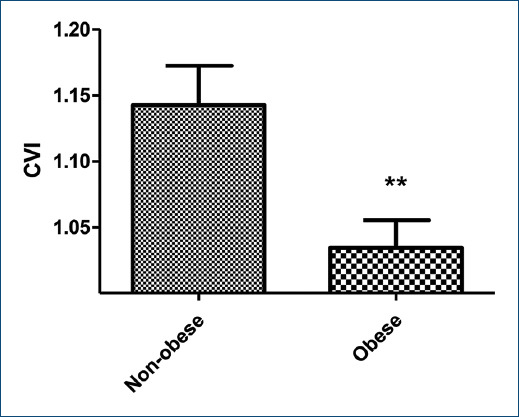
Figure 2 Mean and standard deviation of the 4-s exercise test in non-obese and obese children. CVI: Cardiac vagal index. **Z = 2.782; p = 0.0054, U Mann-Whitney test was used.
As the findings of this study show, obese children presented a lower mean CVI (−9.6%) than the non-obese group, which is evidence of vagal dysfunction in the rest-to-exercise transition. These findings agree with published studies examining the impact of obesity on autonomic function by HRV measurement, which showed lower parasympathetic HRV indexes on obese children than eutrophic individuals9. In agreement with this evidence, we also found a tendency toward lower values in the root-mean-square of differences between adjacent N-N intervals (RMSSD) (35,9 ms versus 44,7 ms) and higher values in LF/HF (1,5 versus 1,3) in obese children (Table 1).
On the other hand, it was observed that the mean CVI of both study groups was reduced compared to reference values published in the adult population7, which suggests that age may also determine the value of CVI in childhood. In this line, some studies have informed that children exhibit a reduced parasympathetic activity, accompanied by a higher sympathetic activity than adults10. However, no studies have been designed to compare autonomic adaptation during exercise in children versus adults.
This study has some limitations. First, the small sample size may affect the reproducibility of the results. On the other hand, chronic respiratory disorders were the only exclusion criteria objectively verified by spirometry. Therefore, if any study participant presented, any non-detected exclusion criteria cannot be ruled out.
Finally, we can conclude that obese children exhibited a reduced vagal response at the onset of exercise measured by 4sET. These findings contribute additional data to reinforce the importance of monitoring the autonomic nervous system in obese individuals from preadolescent age.

