1. Introducción
The standard model of intertemporal choice states that a rational, forward-looking individual seeks to match the marginal utility of his or her money in one period with respect to the following, and between the present and a distant future. This leads the individual to smooth out his consumption and this is what gives rationality to his savings decisions, for the short and long term. However, existing literature shows that individuals do not act in such a manner and frequently make incorrect decisions. This literature suggests that a key reason for this is low level of financial literacy (Lusardi and Mitchell, 2011a, 2011b; Berhman, Mitchell, Soo and Bravo, 2010). The central idea is that the financial world has grown increasingly complex and in general, individuals have a smaller ability to face these changes and make optimal decisions due to the lack of knowledge of basic financial concepts, leading them to incorrect decisions. Financial literacy is related to the understanding of basic economic and financial concepts and their proper application.
One of the results emphasized by the empirical literature is that the lack of financial literacy is more profound in young populations and in the elderly. This has suggested the need to provide financial education to the young since high school. Moreover, in several developed countries, this material has been introduced in their programs. It is interesting to point out that since 2012 the Organisation for Economic Co-operation and Development (OECD) has decided to include a fourth module testing financial literacy in the standard international PISA examination. An interesting finding in this research agenda is the relationship between the level of mathematical skills and financial literacy. The literature argues that these abilities stimulate logical thinking and the capacity to solve problems, positively affecting long term planning. In general, a positive correlation between mathematical skills and financial literacy has been found.
In this paper we analyze the existing relation between cognitive abilities in mathematics and the level of financial literacy in young Mexicans between the ages of 15 and 18 that attend high school (target population for the PISA test), using information from a survey applied to this population in Mexico City. The structure of this paper is as follows: the second section presents a brief literature review, while the third section presents a methodological framework and the model to be estimated; the fourth section describes the survey and the data used, as well as the financial literacy measurement; finally, the fifth section presents the results while the last concludes.
2. Literature Review
There has been growing interest in measuring financial literacy and understanding its importance to financial decision making. According to Lusardi and Mitchell (2013), financial literacy is the ability to process financial or economic information in order to make informed decisions regarding financial planning, wealth accumulation, pensions and debt. The Organization for Economic Cooperation and Development (OECD) has defined financial literacy as a combination of awareness, skills, attitudes and behavior necessary to make sound financial decisions with the purpose of achieving individual economic well-being (Atkinson and Messy, 2012). This research agenda has gained ground and among its main findings is the fact that, generally, low-income individuals, minorities, women and young people present, on average, the lowest levels of financial literacy. These results are repeated around the world, at least in developed countries where the problem has been studied (Lusardi and Mitchell, 2007a, 2007b, 2011a, 2011b, and Atkinson and Messy, 2012).
In Mexico, the overview is not very different even when research in the topic is scarce. Reddy et al. (2013) show that only 37% of the Mexican population is able to compute a simple interest rate, less than 40% plan their spending and savings on a daily basis and only 28% of the adult population plans its future and pensions. Hastings and Tejada-Ashton (2008) conducted a survey about financial education and knowledge of Afores to individuals in Mexico City.1 Afores are private financial institutions that manage retirement assets of workers affiliated to public mandatory defined contributions pensions programs, as well as of individual accounts. The authors find that only 32% of the surveyed population is able to make simple calculations with an interest rate, 65% understand the concept of inflation and 23% have basic knowledge of return on investment. In their experiment they prove that individuals with a greater financial education give more importance to account management fees and have a higher probability of accumulating wealth, while agents with less-than-average financial knowledge are more likely to choose Afores with higher fees. Another study shows that individuals with lower levels of financial literacy tend to be more easily persuaded by marketing factors, yielding sub-optimal consumption and savings decisions (Duarte and Hastings, 2009).
Existing empirical evidence suggests that the majority of young people in different countries present low levels of financial literacy (Lusardi and Mitchell, 2013). This is troubling since individuals tend to make important financial decisions at an even younger age. In the United States, recent undergraduates have considerable debt and the probability of default at a young age has increased (Institute for College Access and Success, 2011, Bartley, 2011). This suggests that there are several advantages of starting the literacy process at earlier stages allows individuals to take advantage of a moment in which absorbing new knowledge is easier (Lusardi and Mitchell, 2013). Also, administrative costs are minimized and the logistics to acquire financial education are simpler for students than people already working. It has been noted that courses given during working hours lack effectiveness, since there is little interest of participants and attendees tend to be unmotivated (Mandell, 2009). In 2008, at least 20 states in the US have modified the curricula of high schools to include a personal finance course (Jump$tart Coalition, 2008).
Nevertheless, additional studies suggest that this type of classes only provide a marginal impact (Bernheim, Garret and Maki, 1997; Mandell, 2009). Therefore a new line of research analyzes the transmission channels that facilitate the acquisition of financial knowledge in the young population. A proposal suggests that mathematical ability is highly correlated with financial literacy since a higher exposure to mathematical education enhances learning and cognitive abilities (Alexander and Pallas, 1984). Christelis, Jappelli and Padula (2010) claim that low cognitive levels, measured as math and verbal fluency levels, are a barrier to information processing and prevent adequate preference formation, in particular regarding risk aversion. The OECD (2013) states that the ability to perform basic arithmetic calculations and solve mathematical problems are skills that are common to financial and mathematical literacy. If it is possible to improve these numerical abilities, then financial literacy could increase and, hence, students could change their behavior.
Christelis et al. (2010) argue that as mathematical knowledge is higher, the propensity to buy financial assets also increases. They find that if the math score of one individual increases, then the probability of participating in the stock market increases in two percentage points. Furthermore, McArdle et al. (2009) explore the connection betweeen cognitive levels, wealth and its composition in pre and post-retirement individuals. They find that the higher the score in a math test, the higher a person´s wealth. Banks and Oldfield (2007) report a similar result for the United Kingdom.
Brown et al. (2013) show that a higher mathematical education increases credit credibility, reduces the probability of default and the amount of undertaken debt. Moreover, Agarwal and Mazunder (2013) find that lower mathematical abilities increase the probability of costly financial mistakes, while Stango and Zinman (2009) show that individuals with smaller cognitive levels tend to take bigger loans at higher interest rates. Cole et al. (2013) found that an additional year of mathematical education increases the propension of young adults to accumulate financial assets and reduces the probability of default, while De Bassa Scheresberg (2013) showed that the individuals that feel they are skillful in mathematics on average have a better financial behavior and education. In general, these studies conclude that the ability to set up and solve mathematical problems is what allows a greater probability of higher financial literacy.
With regards to results for the youth population, Lusradi et al. (2009) analyze, using the Armed Services Vocational Aptitude Battery (ASVAB) -test that is made up of 12 different sections from which one measures mathematical ability while another arithmetic competence- and controlling by cognitive level, the propension to correctly answer questions on risk diversification, simple compound interest rate calculations, and inflation. The main finding is that, on average, an additional point in ASVAB increases around 20% the probability of answering correctly any of the test questions. Japelli and Padula (2013) conclude that there is a direct relation between mathematics and financial literacy. In particular, an increase of one point in numerical ability as measured by PISA tests will increase 0.116 points (on a scale of 0 to 10) in the financial literacy levels of a country.
3. Data and Financial Literacy Measurement
The data used in this paper was obtained from the “Survey about Financial Literacy among High School Students in México City”2 Villagomez (2014). whose objective is to measure financial literacy in young individuals (15-18 years old) who attend school in Mexico. To measure financial literacy, the survey considers the approach proposed by Lusardi and Mitchell (2013), “L&M”, as well as the one proposed by the OECD (OECD-INFE, 2011, and Atkinson and Messy, 2012), “OECD”. This allows the results to be comparable with the ones obtained in different countries which have used the same approaches.3It must be noted that these approaches are not alternative or different from each other. In fact, the questions from the L&M approach are contained in the OECD approach. In this paper the distinction is arbitrarily made in order to make comparisons with other studies that have used any of these measurements. The three basic “L&M” questions deal with compound interest rates, inflation and risk diversification. On the other hand, in the “OECD” approach, the level of financial literacy is integrated by three factors: financial knowledge, attitudes and behavior. In this manner, the level of financial literacy will be given by a discrete number in a range between 0 and 3, where zero represents the lowest level, three represents the highest and each number corresponds to the number of factors each individual has in his financial capacities. Regarding the financial literacy components, financial knowledge reflects whether an individual understands basic financial concepts such as inflation, risk diversification, calculation of interest rates and the risk-return relation of an investment. Financial behavior reports how an individual plans his expenditure, which factors he considers before requesting a loan, and his credit and investment behavior. Finally, financial attitude reflects the individuals’ preferences towards the future.
The survey contains 45 questions, 21 collect the individuals’ basic socioeconomic information, such as family income, gender, age and information relative to their academic environment, like school average, type of school and grade they attend. Fifteen questions deal with financial literacy: 7 to collect information about financial knowledge (including the three “L&M” questions), 5 about behavior and 3 about financial attitude. It is important to point out that the questions were taken from OECD INFE (2011) with the purpose of obtaining information that is comparable to that of other countries. The mathematics section includes six questions taken from the PISA 2012 Assessment and Analytical Framework, which seek to measure the individuals’ abilities in this field: knowing how to set up math problems (linear equations systems) and to solve problems that involve calculations such as addition, subtraction, multiplication and division. Finally, some questions that measure the intensity of the influence of parents or peers over the surveyed are included.
The questionnaire includes questions that offer objective information, such as the mathematical questions, as well as subjective questions, such as the individuals’ perception of financial knowledge. In all the questions that are graded in a binary form, 1 if it is correct or 0 if it is incorrect, the option “I don’t know” is included and it is specified explicitly that this option has no penalty, with the purpose of reducing the probability that a correct answer has been chosen randomly. Unlike Lusardi and Mitchell, the survey does not include the option “Refuse to answer”. In the “OECD” approach it is proposed that the financial literacy level is measured by a discrete number between 0 and 3, following Atkinson and Messy (2012). The individuals’ grade in each section will be given by the total number of correct answers. If this grade exceeds 70% of the questions, the surveyed will receive a mark in the final grade. For example, if a person has 70% in the knowledge and attitudes sections, but only 50% in the behavior section, this person will receive a financial literacy final grade of 2. It is important to state that this grade only intends to rank the level of financial education and not to assign a value, as this would mean that a certain component of financial literacy weighs more than the others.
The sample was randomized at the school level, considering a database of all the high schools in Mexico City, constructed with information of the Ministry of Public Education and the National University. Schools were divided into public and private. The total of useful surveys was 865. Table 1 shows the descriptive statistics of the survey and we briefly mention some of its main results.
Table 1 Descriptive Statistics.
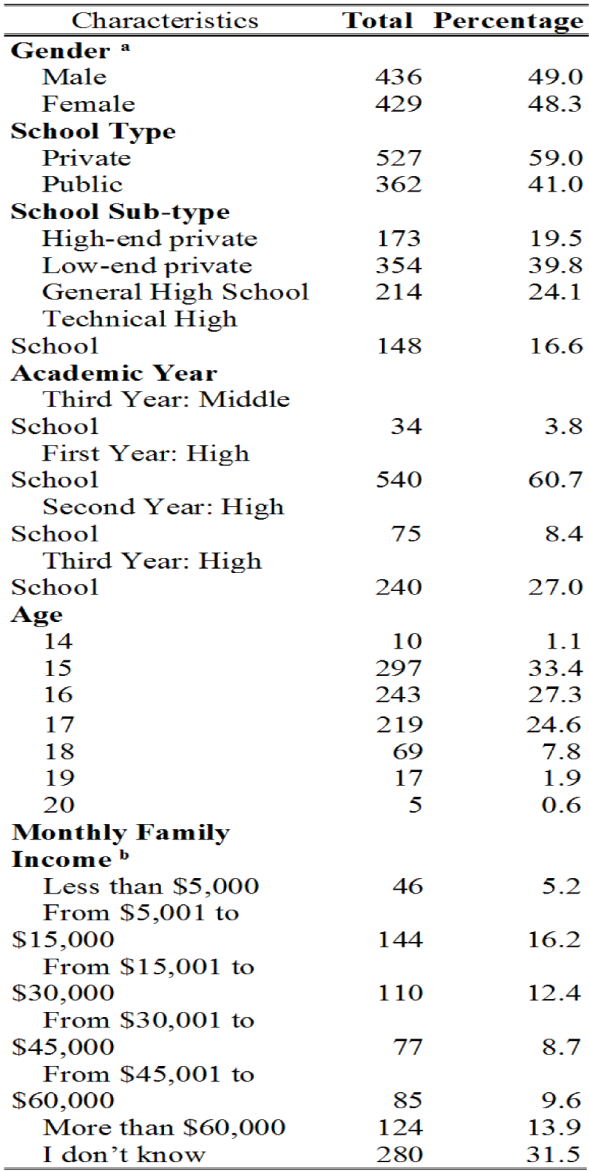
a 2.7% of the sample did not answer the gender question
b 2.6% of the sample did not answer the question regarding family income.
Source: Authors’ calculations
Related to the three “L&M” questions, the results show a low level of financial literacy. Only around 6.5% of the participants answered all questions correctly, compared to 27% reported in the United States. The mean of correct answers was 1.27 out of 3, while the United States had a mean of 1.5 correct answers, 0.23 points below United States. Some slight differences were found in the rate of correct answers in the inflation and risk diversification questions, in both countries. However, consistent with Lusardi and Mitchell (2013), it is interesting to note that young Mexicans gave more adequate answers in the inflation question. The reason is that countries that have experienced higher episodes of inflation usually tend to be better instructed in the subject than countries that have had a low and controlled inflation rate. In Mexico, the least favorable result was found in the compound interest section, probably due to low financial inclusion that does not allow exposure of the population to this particular subject. It is worth mentioning that financial literacy was lower in women with respect to men, and in public schools with respect to private schools. These results are compatible with the findings all around the world, including that in Mexico is more common to understand inflation due to the experience of high inflation during 1990´s. Unfortunately, there is no data avaible to make comparisons with Latam or other countries that have similar socio demographics characteristics as Mexico. Table 2 shows these results.
Table 2 Comparison amoung Countries and Mexico.
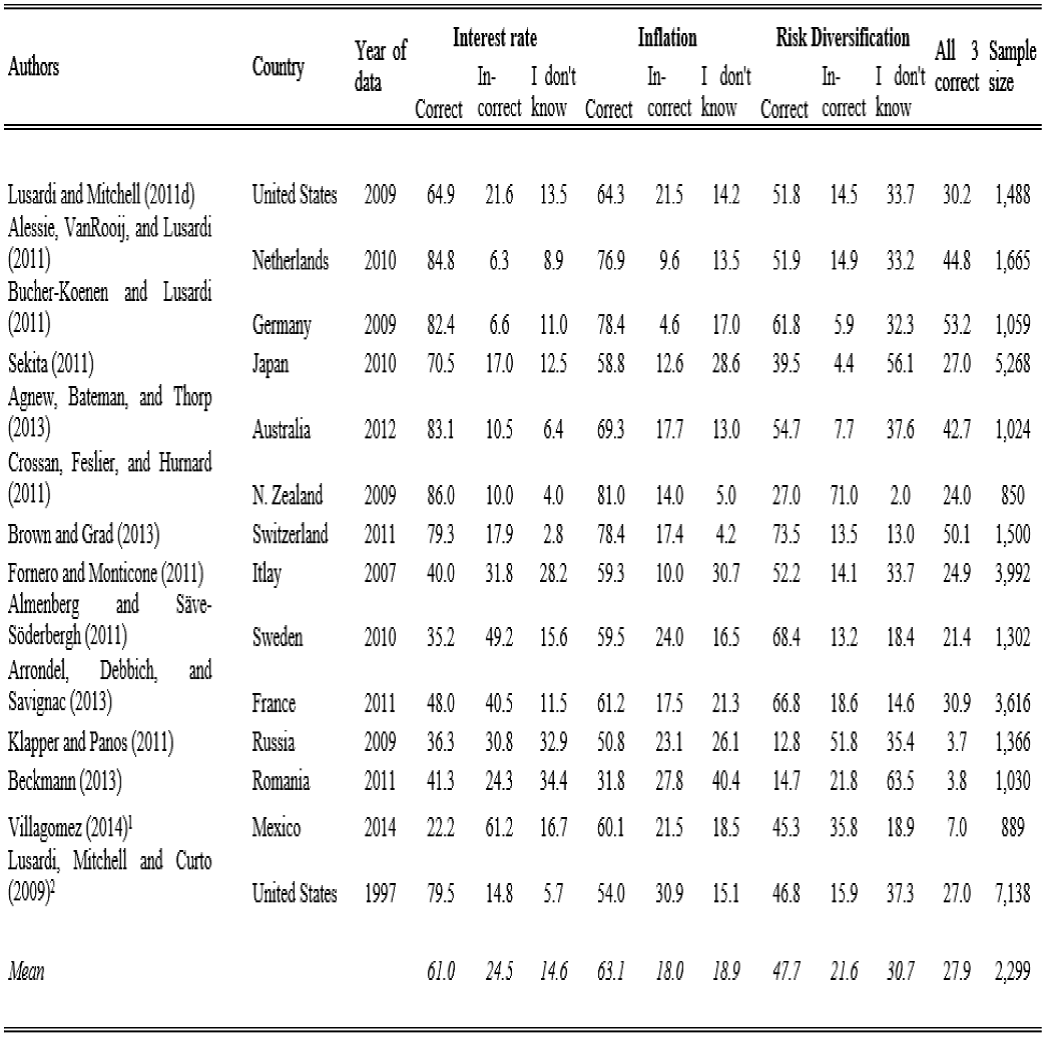
1/ This survey was applied to people between 15 and 18 years old.
2/ This survey was applied to people between 23 and 25 years old.
Source: Authors’ calculations
With the “OECD approach”, the results show that the mean of the general score was 1.28 points out of a maximum of 3. This shows that, on average, young Mexicans have low financial literacy levels. This indicates that young Mexicans lack basic tools for financial decision making. Finally, the mathematical results are reported. In general, grades are unsatisfying in this section, the mean of correct answers is a failing grade. Out of 6 possible correct answers, the surveyed on average answered 2.6 correctly. As previously mentioned, these questions were obtained from the PISA test, which implies that the level was designed specifically for those ages. This provides evidence of the low mathematical level of young Mexican students. In the PISA 2012 test, Mexico obtained an average score of 413 points, while the average score in OECD countries was of 494 points. It was also found that the results were better in men than in women. To obtain the number of hits we used the methodology of Atkinson and Messy (2012), which assigns a point to that respondent who answered at least 70% of the reactants of each component correctly. For the score of each component, the variable represents the number of correct answers of eache person. Results are shown in Table 3.
4. Methodology
This paper’s methodology differs from other studies in the following way. The ordinal origin of the financial literacy score constructed for this investigation (see next section) suggests that the adequate model is an Ordered Probit or an Ordered Logit, depending on the assumptions of the errors’ distribution (Wooldridge, 2002 and Long, 1997). Financial literacy level is ordinal due to the fact that only the order of the variable is important and not the magnitude. For example, claiming that a person who obtains a grade of 2 in the test has double the financial education than a person who obtains a 1 would be a strong and perhaps inaccurate statement. However, following McKelvey and Zavoina (1975) and Winship and Mare (1984) one must be prudent while using an ordinal latent variable model, for if the dependent variable can be ordered in more than one dimension (natural order from different perspectives), the results will surely be incorrect. McCullagh and Nelder (1989) expand this idea, setting as an example colors. They may be ordered regarding their electro magnetic spectrum or they may represent individual preferences, which indicates that there is a natural order in more than one dimension.
The justification of whether the proposed model is correct and whether the dependent variable’s order is a candidate for this methodology lies in Marcus and Greene (1985). The authors seek to determine the level of aptitudes of a United States Military applicant. They classify applicants as non-fit, moderately fit, fit and highly fit, assigning a value of 1 to the least prepared and 4 to the best prepared within the sample. Aptitudes are classified through diverse tests to the applicants and a final grade is assigned given the results. This is analogous to the proposed financial literacy measurement, where the final grade is assigned in accordance to financial behavior, knowledge and attitudes.
This research seeks to prove the positive effect that the level of skills and or mathematical knowledge has in the financial literacy level. The dependent variable is the number of correct mathematical answers in the test applied. Additionally and following De Bassa Scheresberg (2013), it is controlled by the confidence the individual has in himself in mathematical and financial abilities.4The average grade point average in the mathematics course could be included as an independent variable to act as an additional control of the mathematical level of an individual. However, the belief of a tendency to over report grade point average exists. Therefore, this variable is not considered an explanatory variable since it could generate a bias in the estimates due to error-in-measurement. In this manner, the final specification is:
where
However, the estimator’s units are ambiguous, which hinders its interpretation. McKelvey and Zavoina (1975) and Winship and Mare (1984) propose to standardize
the estimator, dividing
A more thorough analysis would require finding in which of the three financial literacy components the mathematical transmission occurs. To do so, a model is proposed where the number of correct answers are estimated for each of the financial literacy components controlling by the socioeconomic variables, previously described, and by the mathematical section. Each component of the financial literacy represents the number of correct answers that the people have in the test. For financial behavior the scores goes from 0 to 5, for attitudes goes from 0 to 3, and finally knowledge goes from 0 to 7, incluiding the L&M questions.
The existing correlation between the three financial literacy components suggests that a correct estimation must be given through ordinary least squares (OLS) simultaneously, with the purpose of earning degrees of freedom and estimation efficiency. Thus, the resulting equations would be the following:
5. Results
We first analyze the direct impact of a change in an explanatory variable on the
final grade of the test. To do so, the
Table 4 Ordered Probit Estimators:
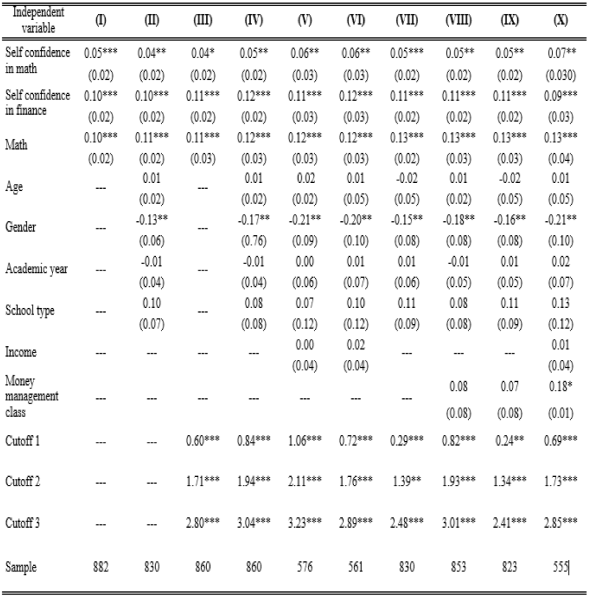
Note:*,** ,***: significance at the 10%, 5%, and 1% level, respectively.
Source: Authors’ calculations.
Columns (I) and (II) are OLS estimations. The only difference between these is that
the first one only includes the variables of interest (correct answers in
mathematics and self-confidence in math and finance), while the second one considers
the controls as well, offering a better adjustment (
It is interesting to note that no matter which type of specification or model is used, the level of mathematics remains statistically significant at the 95% level in all 10 regressions. The standardized coefficients are around 0.12 and, in the particular case of column (IV) its value is 0.12. The interpretation of this result indicates that an increase of one unit in correct answers in math, the level of financial literacy increases in 0.12 standard deviations. Intuitively, two more correct answers in math are translated into one-half of a point in the general score. It can also be observed that self-confidence in mathematics and finance are statistically significant and positive across all specifications. In the first variable, changes in significance in the different regressions are observed, while self-confidence in finance maintains a 95% significance in all the cases. The fact that both estimators are positive suggests that more confidence in asset management implies a better performance in the financial literacy test. These results are consistent with the work of De Bassa (2013). Finally, gender is an interesting case among the additional control variables. The estimators remain negative and significant at the 90% level in all the specifications. This suggests that being a woman positively affects the final score, with an impact of nearly 0.2 standard deviations. The other controls did not show statistical evidence of being determinant in financial literacy.
The second intepretation requires obtaining the marginal effects of the Ordered Probit. This analysis indicates how the probabilities of having a certain number of correct answers changes when there is a unit movement in the control variables. Table 5 shows the marginal effects of the Ordered Probit at the mean of each variable. Due to the estimation, it is impossible to gave a joint interpretation of the coeficients, so it is made “cetiris paribus”. The analysis is only made with specification (IV) of Table 4, as it showed the best goodness of fit. These results are coherent with those presented in Table 4, since the estimators have the same sign. In terms of probabilities, a one unit increase in correct answers in mathematics reduces the probability of having 0 or 1 correct answers in the final test, but increases in 2.5% and 2.1% of correctly answering 2 or 3, respectively. Significance of 95% is maintained across all results. Moreover, self-confidence in finance shows a behavior that is similar to the correct answers in mathematics; this is, as self-confidence in finance increases, the probability of having a low score in the final test decreases while it increases the probability of a high score. In this case, significance of 95% is also maintained. With regards to gender, being a male increases the probability of a low proportion of correct answers (4.8% for 0 correct responses, and 1.6% of 1 correct answers). On the other hand, being a female increases in about 2% the probability of having 2 or 3 correct answers. This is interesting because this is line with the literature that says that women are more patient and more risk averse than men. School year and age of the student are not significant.
Table 5 Ordered Probit: Marginal Effects.
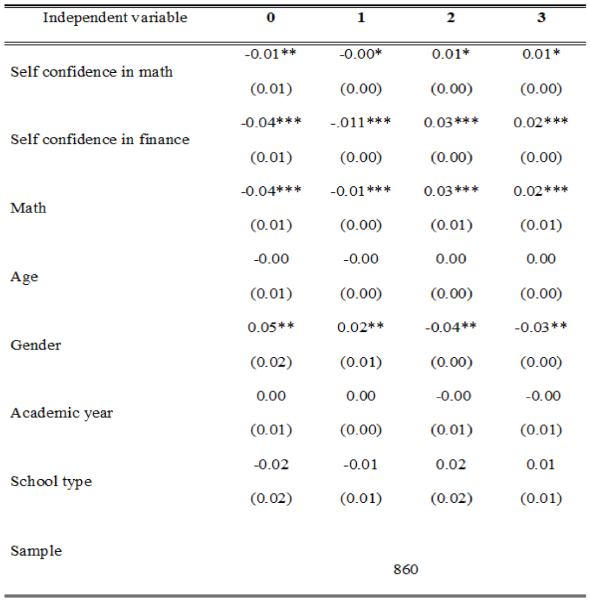
Note:*,** ,***: significance at the 10%, 5%, and 1% level, respectively.
Source: Authors’ calculations.
To analyze the transmission channel of the explanatory variables at the general level
of financial literacy a method of simultaneous estimation is used. Since explanatory
variables are the same in three equations, the estimation via OLS would yield the
same results. Nonetheless, the SUR methodology allows to conduct hypothesis testing
that verifies if the estimators are equal across equations. The results reject the
hypothesis that the estimators have the same magnitude. Furthermore, the residuals
are correlated in the three equations. Therefore, there is a gain in efficiency
(Wooldridge, 2002). With regards to
goodness of fit, an
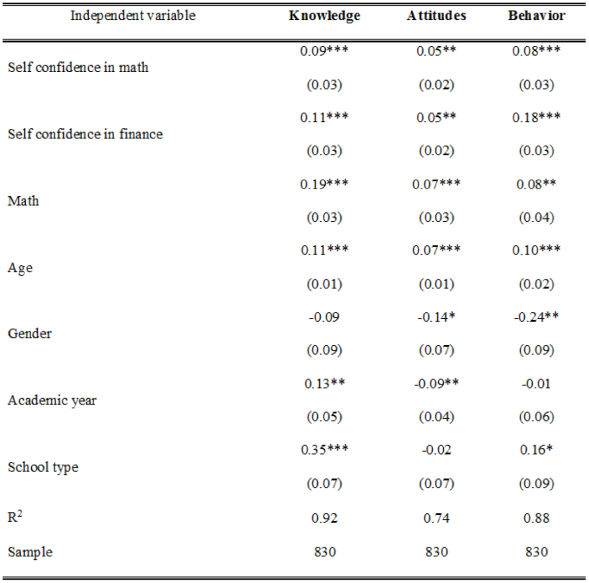
Table 6 Seemingly unrelated Regressions.
Note:*,** ,***: significance at the 10%, 5%, and 1% level, respectively.
Source: Authors’ calculations.
Although the transmission channel of the mathematical level of financial literacy is produced via the three components, the greater incidence is transmitted by the financial knowledge component, where the estimator linked to mathematics was of 0.18. This means that an additional correct answer in mathematics would produce nearly 0.2 more correct answers in the final test. This analysis is important since it proves that the cognitive level of an individual is related to its preference formation and discount factor, which are measured by attitudes and financial behavior. Even when the value of the estimators in the case of knowledge are lower, the coefficients remain positive even when the econometric specifications are changed.
The levels of self-confidence for mathematics and finance are significant and positive in the three components of financial literacy. Feeling able in mathematics and finance has a positive impact in the number of correct answers in the three components. The type of school produces a positive effect in behavior and financial knowledge; this implies that belonging to a private school increases the score in the behavior test by 0.35. In contrast, schooling is a bad predictor of general level of financial literacy. Yet, it is a good determinant of the level of financial knowledge. This makes sense since, as schooling increases, the students have a larger tool set to solve problems, especially to understand topics on economics or finance, but without affecting preference formation or their discount factor. Schooling does not have an effect in the marginal effects of probability. With regards to gender, the impact is transmitted via the attitudes and financial behavior since in terms of knowledge there is no difference between males and females. This is coherent with the findings of Rubalcava, et. al (2009), who reach the conclusion that Mexican women, on average, are more risk averse and patient than men. For the case of behavior, the estimator of -0.23 suggests that being a female increases in 0.23 the correct answers of the behavior test, while 0.13 in the case of attitude.
It is important to recall that “L&M” is centered in the understanding of three basic concepts: inflation, interest rate and risk diversification. First, we analyze the impact of the control variables in the quantity of correct answers per surveyed individual using an econometric counting model, a Poisson distribution given by:
where
In this case,
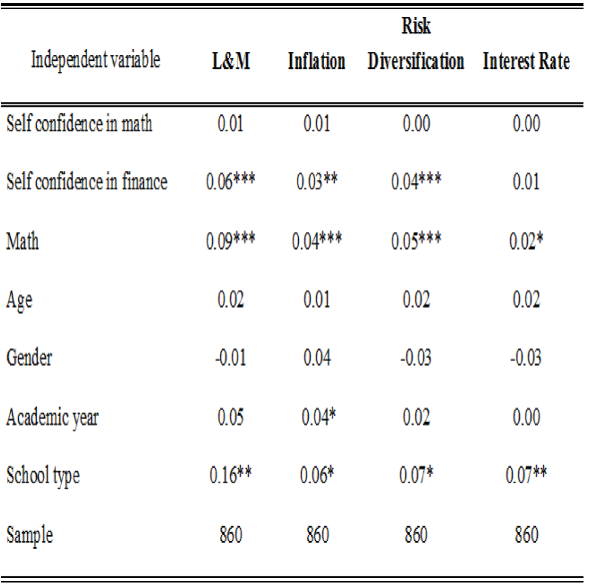
Table 7 Count Data Model and Probit’s Marginal Effects.
Note:*,** ,***: significance at the 10%, 5%, and 1% level, respectively.
Source: Authors’ calculations.
The results once again show the positive and significant impact of the level of mathematics. In this case, an increase in correct answers in mathematics will increase the expected value of the correct answers to the L&M questions by 0.086. This estimator maintains its sign and predictive power across specifications. Furthermore, it can be observed that an additional correct answer in the mathematics test is related with a positive change in the probability of answering all three questions correctly. The marginal effect with a higher magnitude is presented in the question regarding risk diversification and is greater than 5%. Moreover, among the other control variables, it is possible to note that self-confidence in mathematics does not have an impact in any of the four estimations, yet confidence in finance positively affects all of them. In the same way, and unlike in the “OECD approach”, gender stops being a determinant of financial literacy. This is primarily due to the fact that in this approach preferences for risk or impatience of the individual, factors where clearly there is an advantage for women, are not measured. Finally, similar to the “OECD approach”, belonging to a private education institution increases the likelihood of presenting a better score and positively affects the probabilities of answering correctly.
To conclude, the topic of unobserved variables if briefly discussed. There is a possibility that the survey did not capture all the student’s information, especially in the case of intra-community aspects (the individual’s school) and in his or her capacity to learn; for example, the number of hours that a student spends in school, the quality of the lectures, or the focus of the course content. This problem can produce bias and inconsistency in the estimators due to unobserved variables (Wooldridge, 2002). The ideal form of correcting this situation is by using temporal and community-level fixed effects. In order to implement this methodology, information on the individual is required at different points in time and several observations are needed from individuals in the same community. Unfortunately, the available data only allows to correct the problem at the school-level.
For this analysis, the level of financial literacy will be given by the natural logarithm of the total sum of correct answers in the three components in the “OECD approach”. This transformation was done based on the procedure of Miranda and Zhu (2013). It allows more variation in the dependent variable and avoids working with discrete numbers. In the estimation a school-level fixed effect is introduced and to correct for possible errors generated by heteroskedasticity, robust errors were used. The final specification was of the form:
The results are presented in Table 8. In this case, the interpretation is different since the logarithmic transformation allows to obtain the elasticities directly (Wooldridge, 2002).
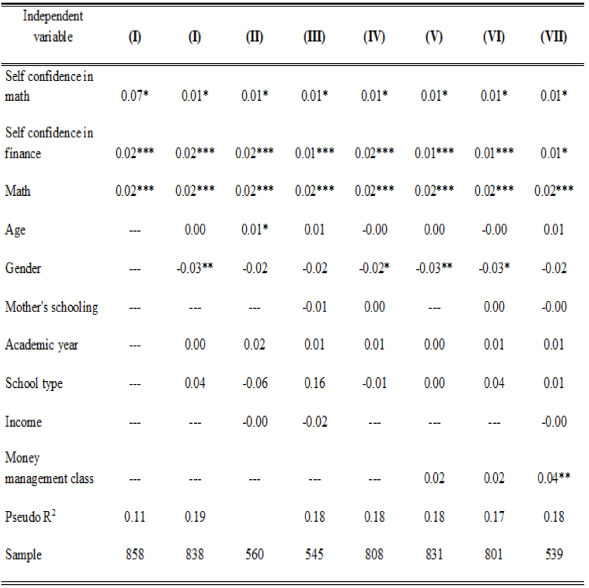
Table 8 Community Fixed Effects.
Note:*,** ,***: significance at the 10%, 5%, and 1% level, respectively.
Source: Authors’ calculations.
We observe that changes in correct answers in mathematics have a positive relation in an interval of 1.6 to 1.9 percent, depending on the specification. It is interesting to observe that gender is sensitive in this methodology, becoming statistically zero in some specifications. An additional important result of this analysis is that the subjective valuations of the individual remain significant in all regressions, which gives certainty that financial literacy is affected by more than just objective and measurable characteristics.
6. Conclusions
The low level of financial literacy in most countries has become a concern due to the increasing financial complexity of the modern world and the cost in well-being, both individual and social, that derives from incorrect economic and financial decisions from individuals. In particular, it has been found that the issue is especially important for young populations, which increasingly face major financial life decisions. Within the literature studying the determinants of financial literacy, one interesting approach has been to explore the relationship between mathematical skills and financial literacy. The objective of this paper was to analyze this relationship specifically for the case of young Mexicans between the ages of 15 and 18 attending school in Mexico City Mexico. We use data from a survey explicitly designed for this purpose and based on the questions proposed by Lusardi and Mitchell and the OECD.
The survey’s results confirm that financial literacy levels are low in young Mexicans. Considering the “L&M” approach, only 6.6% of the sample answered all three questions and only 35% answered two of them correctly. Using the “OECD” approach similar results are reported. Only 40% of the sample has a sufficient financial knowledge level and only 30% is considered to have adequate financial attitudes. In aggregated terms, it is troubling that only 10% of the young population has the three necessary components for financial decision making and 22% has none of the three proposed by the OECD.
The econometric analysis offers evidence regarding the determinants of financial literacy, particularly about the significant and positive impact of mathematical knowledge. The statistical significance remains upon changes in the control variables and the specification. Such impact is transmitted through the three components found in the OECD’S definition, although greater incidence is given via financial knowledge. The results obtained through an Ordered Probit suggest that an increase of correct math answers, generates a greater probability of increasing financial literacy by 0.12 standard deviations. In more intuitive terms, two additional correct answers in math imply a half a point change in the general score.
To strengthen the analysis, we also studied the changes in the probability of having a particular score on the general test. It was observed that an additional correct answer in math reduces the probability of having a score of zero or one in the general financial literacy score, and increases the incidence of having two or three points. This confirms the hypothesis: with greater mathskills, there is a better financial education. Finally, considering a possible problem of unobserved variables, a model of fixed effects was estimated with the purpose of reducing the factors that were not taken into account within each school. The math skills effect remained significant and positive, and it was found that the punctual elasticity of the financial education with respect to mathematics is around 2%. This impact remains despite changes in the econometric specification, assuring robustness of the estimators.
As of now, there is no similar research in Mexico. An effort to measure financial literacy as suggested by “L&M” and the “OECD” has not been made. Thus, the results presented prove the importance of initiating a process of economic and financial education in schools, and of strengthening the quality of instruction in mathematics. These two actions, according to the results, would bolster financial understanding and knowledge.


 nueva página del texto (beta)


