1. Introduction
Mesoporous metal oxides have been of much interest in adsorption, separation and catalytic processes because their high surface area, uniform pore size and good chemical and thermal stability (Choi & Ryoo, 2010). Mesoporous metal oxides are able to provide high external surface area along with short diffusion distances within the inner channels of the material resulting in a considerable accessibility to the active sites (Roggenbuck et al., 2007).
Cerium oxide-based mesoporous materials with pore sizes between 2 and 50 nm prepared through a template mechanism have received much attention in catalytic applications (Rossinyol et al., 2005).
The CeO2 has a crystalline structure similar to fluorite (CaF2). The presence of highly reducible Ce4+ and Ce3+ species, a high proportion of oxygen surface defects and acid-base properties make CeO2 suitable for catalytic applications (Vasconselos et al., 2011). Better catalytic performance of CeO2 can be obtained when the synthesis procedure results in a high surface area and a uniform pore structure.
Ke & Lai, 2014 suggest that mesoporous CeO2 has suitable properties for catalyst or support applications, such as the conversion of glycerol). Glycerol production has been increasing because it is the main by-product obtained from biodiesel production processes (about 10% of the total biodiesel production). Nowadays there is an oversupply of glycerol that has resulted in its reduced price, therefore, the challenge is to explore and develop innovative and ecological catalytic processes to transform glycerol into high added value products through sustainable routes. This leads to improve the environmental benefits and economic viability to produce biodiesel and to make use of the obtained glycerol (De Olivera et al., 2011).
A promising option for the valorization of glycerol is through the dehydration reaction. This reaction is carried out, mainly, by acidic and basic catalysts, where it is possible to obtain mainly acrolein and acetol, which are important chemical products for the chemical industries (Stošić, Bennici, Couturier, Dubois & Auroux, 2012). For example, the acrolein is an intermediate used to produce acrylic acid esters, adhesive, superabsorber, polymers, and detergents (Jia, Liu, Schmidt, Lu & Schüth, 2010). In addition, acetol is an important intermediate used to produce polyols and widely used as a reduced dye in the textile industry and as a skin tanning agent in the cosmetic industry (Soucaill, Voelker & Figge, 2008).
In the present work, CeO2 mesoporous materials were synthesized by applying the “hard and soft template” technique.
The samples were characterized by XRD, N2 physisorption, TEM, TPD, CO2 chemisorption and ICP-OES composition analysis techniques. The mesoporous CeO2 materials were tested in the dehydration reaction of glycerol in gas phase in order to obtain high value chemicals such as acetol (hydroxyacetone) and acrolein (Stošić et al., 2012).
2. Experimental
2.1 Synthesis of materials
Two techniques have been employed for preparing mesoporous CeO2: “soft template” and “hard template”. In the “soft template” method, supramolecular aggregates (micelles of surfactants) act as pattern reproduced by the pores of the material. In the “hard template” method or “nanocasting”, a siliceous ordered mesoporous material (OMM) is firstly synthesised which works as the pattern for the deposition of ceria nanocrystals. Afterwards, the siliceous mesoporous material is eliminated in basic media resulting in a copied highly ordered CeO2 crystalline structure. We employed the siliceous mesoporous material KIT-6 with a three-dimensional cubic pore structure as well as the SBA-15 with hexagonal structure pore, both as “hard template” that allows the preparation of metal oxides with a mesoporous arrangement of highly crystalline walls and good thermal stability (Ce-SBA-15 and Ce-KIT-6). On the other hand, we employed Pluronic P123 and F127, a non-ionic block copolymer surfactant as “soft template” (CeO2-P123 and CeO2-F127).
2.1.1 “Hard Template” CeO2 Synthesis
KIT-6 was synthesized in acidic conditions and as reported by Kleitz, Choi, and Ryoo 2003 using a mixture of Pluronic P123 triblock copolymer (EO20PO70EO20) as template and butanol. Thus, 6 g of P123 were added to a solution of 220 g of distilled water and 12 g of concentrated HCl (35%). The mixture was stirred for 6 h at 35 °C and then 6 g of butanol was added whilst stirring for another hour (De Olivera et al., 2011). Finally, 12.48 g of tetraethyl orthosilicate (TEOS, 98%, Aldrich) was added and stirred for 24 h at the same temperature. The mixture was heated for 24 h at 120 °C, under static conditions for hydrothermal treatment. Finally, the white solids were recovered by filtration, washed with deionised water and dried at 120 °C for 24 h in an oven. Thereafter, the products were calcined in flowing air at 550 °C for 6 h at a heating rate of 5 °C min-1.
Two-dimensional SBA-15 was synthesized in acidic conditions and according to what was reported by Aranda et al. 2010 using the Pluronic P123 triblock copolymer (EO20PO70EO20) as template and tetraethyl orthosilicate (TEOS, 98%, Aldrich) as a silicon source. A solution with 6 g of P123 was dissolved in 195 g of distilled H2O and 30 g of concentrated HCl (35%) was prepared and stirred for 6 h at 35 °C. 12.49 g of TEOS was added to the mixture and stirred for 24 h at 35 °C, and then heated at 100 °C for another 72 h under hydrothermal treatment. The solid product was filtered, washed, dried at 105 °C in air and calcining flowing air at 550 °C for 6 h.
For the synthesis of the mesoporous CeO2, 2.5 g of KIT-6 were dispersed in 5 g of Ce (NO3)3·6H2O (99%, Aldrich) dissolved in 5 g of ionized water. The mixture was heated to 450 ºC in a ceramic crucible and kept for 4 h, in order to eliminate nitrates. The siliceous template was later on eliminated in 100 ml of a 2 M NaOH solution at 75 ̊C under stirring. The remaining material (mesoporous CeO2) was centrifuged, washed with ionized water and dried at 80 ºC (Ke & Lai, 2014). The materials were labelled as Ce-KIT-6 and Ce-SBA-15.
2.1.2 “Soft Template” CeO2 Synthesis
Pluronic 123 copolymer (EO20PO70EO20, M.W. 5800, Aldrich) and Pluronic F127 (EO100-PO65-EO100, M.W. 12,600, Aldrich) were used as template and Ce(NO3)3 ·6H2O (99%, Aldrich) was employed as cerium source. In each synthesis, 4 g of Pluronic surfactant and 8 g of cerium salt were used. The synthesis was carried out under basic conditions, with a 1 M NaOH solution, at a pH of 10. The reactants were stirred for 24 h at 75 ºC. The solid product was separated by centrifugation, washed with ionized water and dried at 60 ºC. The resultant powder was calcined at 550 ºC for 6 h. The materials were labelled as CeO2-P123 and CeO2-F127.
2.1.3 Characterization
The XRD analysis was carried out with a Philips X’Pert Pro diffractometer, employing CuK radiation (=1.540 Å, 45 kV and 40 mA). The textural properties were obtained with a Micromeritics ASAP 2020, the TPD/TPR analysis was carried out with a BEL Japan Inc. BELCAT-B instrument, the TEM images were obtained with a Jeol 2100F microscope with a field emission electron source (FEG) at 200 KV. The ICP-OES composition analysis was determined with a Perkin Elmer Optima 3300 DV.
2.1.4 Catalytic Procedure
The mesoporous CeO2 catalysts (Ce-KIT-6 and CeO2-P123), were employed for the dehydration reaction of glycerol al 320 ºC in gas phase with a fixed bed continuous flow reactor at atmospheric pressure. The reaction system consisted of an evaporator, the reactor, and a condenser, where the reaction products were collected. The supply of N2 and Air gases to the system was carried out by means of mass flow controllers that provide a constant and controlled gas flow. The glycerol-water mixture is introduced into the system using a peristaltic pump (GILSON 307 HPLC). First the mixture goes through a Pyrex evaporator of 11 cm long and 3 cm in diameter. Once in gaseous form, the reagent was fed to a fixed bed reactor made of quartz with a length of 25 cm and 0.5 cm in diameter. Finally, the reaction products are introduced into a condenser of 15 cm in length and 2.6 cm in diameter for the collection of liquid products to be identified by gas chromatography.
Before reaction, the catalysts were activated for 2 h at 300 ºC under a 30 ml/min N2 flow. A 10 %wt. glycerol/water solution was fed into the reactor with a perfusion pump at a 10 ml/h speed and employing 30 ml/min of N2 flow as carrier gas. Three W/F conditions were studied: 4.54, 9.09 and 18.18 gcath/mol, by varying the amount of catalyst. The effluent was analyzed every 15 minutes for 2 h. The reaction products were analysed with a Perkin Elmer gas chromatograph fitted with a HP-Innowax column. The glycerol conversion and the product yield were the parameters used to evaluate the catalyst performance. They were calculated according to the following equations,
3. Results and discussion
3.1 X-ray diffraction
Figure 1 shows the large-angle a) and b) the low diffraction patterns of the mesoporous CeO2 obtained by the hard and soft template procedures. The large-angle XRD patterns a) exhibited the CeO2 fluorite type characteristic peaks at 2( diffraction angles between 10° and 90º, belonging to (111), (200), (220), (311), (222), (400), (331), (420) and (422) planes which are characteristic of the cubic fluorite structured CeO2 (JCPDS: 35-0816).
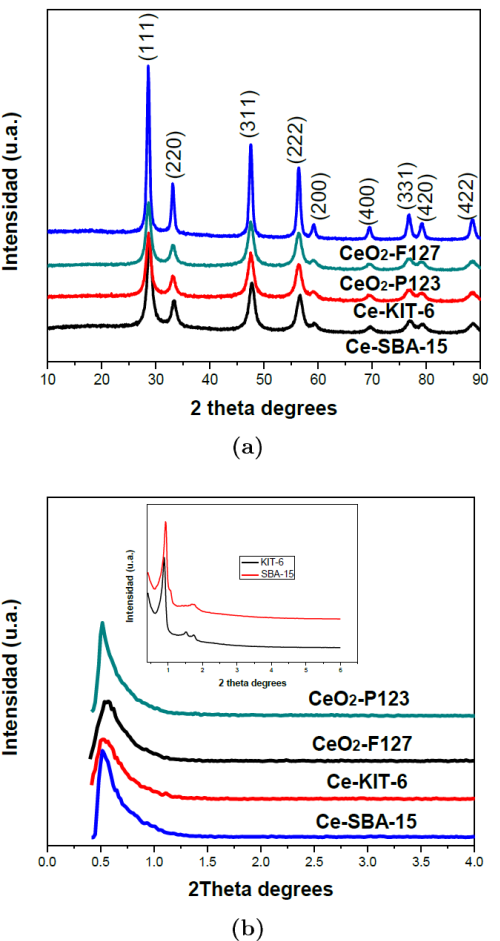
Fig. 1 Large-angle and low angle XRD patterns of partially ordered mesoporous cerium oxide catalysts for different templates.
Figure 1 b) also shows the low-angle XRD patterns of the catalysts. The diffractograms exhibit an intense peak at a 2θ angle of 0.5° and 1º assigned to (211) reflections typical characteristics of mesoporous materials, this agrees with what was reported by Rossinyol et al. 2005. Two intense peaks corresponding to (211) and (220) planes and a smaller peak corresponding to the (322) plane can also be observed at low-angle. In addition, three diffraction peaks of SBA-15 were observed at low scanning angles of 0.99◦, 1.63◦and 1.85◦, corresponding to the Miller crystal planes (100), (110) and (200), respectively (Jia et al., 2010). It can be seen that Ce-SBA-15 retained the hexagonal porous silica structure, associated with a mesoporous order as a replica of the template used; a cubic structure in the case of KIT-6 and a hexagonal structure p6mm in the case of SBA-15. Also, the diffraction peaks, characteristic of the cubic Ia3d symmetry of the siliceous material KIT-6, were observed (Ryoo, Kim, Ko & Shin, 1996).
3.2 Transmission electron microscopy
Figures 2 a) y 2 b) show two TEM images of Ce-KIT-6 and Ce-SBA-15, respectively. Both exhibit ordered and uniform nanoparticles with a periodicity extending over large regions of the sample. In Figure 2 a) the Ce-KIT-6 samples show the replication of the Ia3d cubic symmetry. Figure 2 b) mesostructured Ce-SBA-15 can be observed with an arrangement consisting of hexagonal nano-particles. These nanoparticles have a regular size around 5 nm since their growth was confined into the channels of the silicon template (SBA-15) (arrows in Figure 2 b).
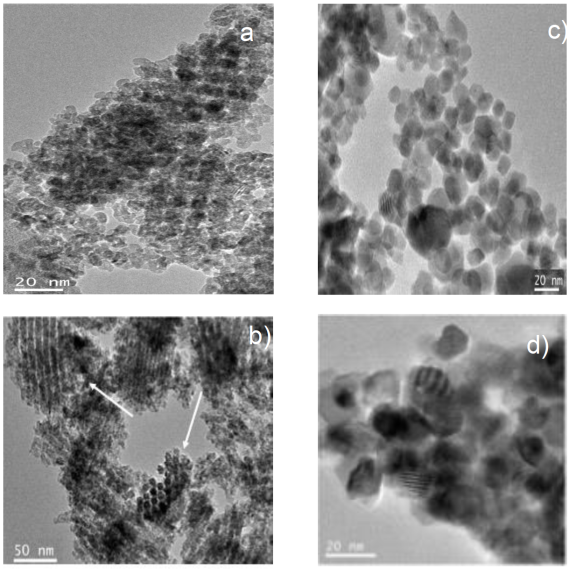
Fig. 2 TEM images of the samples: a) Ce-KIT-6 y b) Ce-SBA-15. TEM images of the samples: c) CeO2-P123 y d) CeO2-F127.
Figures 2 c) y 2 d) show the TEM images of CeO2-P123 y CeO2-F127, respectively. Both figures depict the morphology of spherical aggregates of approximately 8 nm in diameter. The shape of some particles is hexagonal in the case of CeO2-P123, suggesting that the Pluronic P123 y F127 block copolymer generates three-dimensional channels through self-assembly mechanism (Kabanova, Batrakovaa & Alakhov, 2002). In both cases, with both samples, there are agglomerates of nanoparticles.
3.3 TGA y DTA analysis
Figure 3 shows the TGA graphs (blue line) and its derivative (red line) of Ce-KIT-6 and Ce-SBA-15 materials after removing the template with NaOH. Both materials presented a weight loss around 100 °C, which corresponds to the physisorbed water on cerium oxide with a weight loss of 6.43% and 11 %, respectively. After 100 °C, no significant changes in weight were observed with increasing temperature.
In Figure 4 a) the TGA-DTA analyses show that CeO2-P123 without calcining presented first a weight loss (5.85%) corresponding to the physisorbed water lost at 80 °C, followed by a weight loss of approximately 4.14% at 275 °C, corresponding to the loss of the Pluronic P123 surfactant which was subsequently removed by calcination at 550 °C. Similarly, the catalyst CeO2-F127 not calcined showed a weight loss of 2.72 % corresponding to physisorbed water, followed by a loss of 1.39 % due to the elimination of surfactant (Figure 4 b).
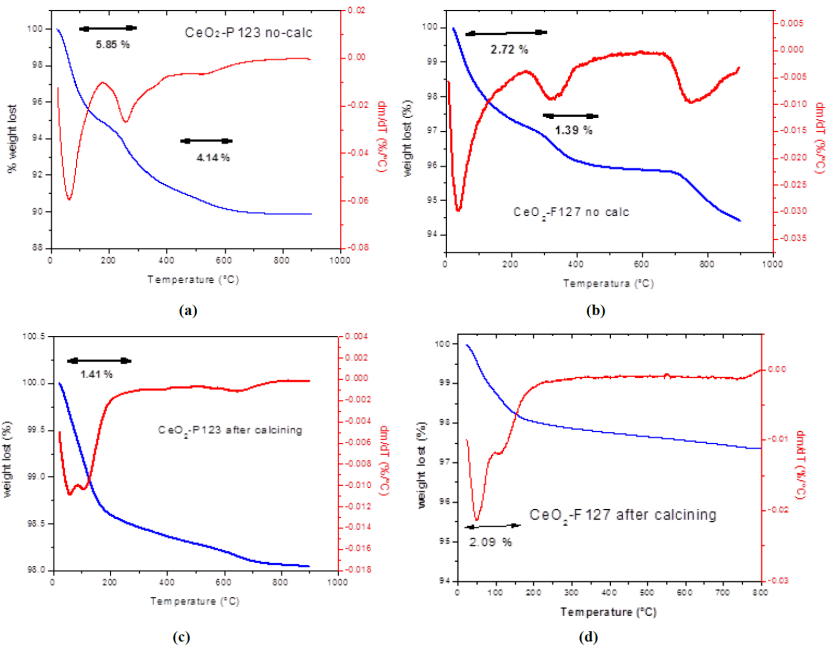
Fig. 4 Thermal analysis (TGA and DTG) of CeO2-P123 not calcined and CeO2-F127, not calcined and calcined.
The removal of the surfactant after calcination at 550 °C was verified in the CeO2-P123 and CeO2-F127 calcined (Fig. 4c and d), where it is observed that there was no weight loss by the surfactant, confirming that the Pluronic P123 and F127 surfactant were completely eliminated, only one loss of weight is observed and can be ascribe to humidity. This loss was in the order of 1.42% and 2.09 %, respectively. With the exception of physisorbed water, weight variations with respect to temperature were not observed.
3.4 Spectroscopy IR
The IR spectra of the cerium oxide sample after the elimination of the silica template with NaOH (Ce-KIT-6 NaOH) (Figure 5) decrease of the three main peaks in the Si-O-Si bond belonging to KIT-6: 1070 cm-1, 788 cm-1 and 455 cm-1. This indicates the partial removal of Si in the KIT-6 structure after the NaOH treatment. A small peak is observed at 972 cm-1 and can be attributed to the interaction that exists in the Si-O-Ce bond (Zhu et al., 2013).
The IR spectrum of the calcined and uncalcined CeO2-P123 support (Figure 6) presented intense bands at 3600 and 1600 cm-1 associated with the OH vibration of the physisorbed water. There is a band between 2800 and 3500 cm-1, due to the flexion vibration of the C-H bond of the surfactant that disappears in the IR spectrum of the calcined sample, indicating that the surfactant is removed after calcination at 550 °C. A signal located at 447 cm-1 was observed due to the stretching of the Ce-O bond that can be seen in the calcined sample, considered as the fingerprint of CeO2 (Brigante & Schulz, 2012).
The band at 3500 cm-1 attributed to silanol group’s vibrations, is observed in both samples. However in the Ce-KIT-6 this is weaker. Laha, Mukherjee, Sainkar, and Kumar (2002), and Shen, Dong, Zhu, Chen and Shi (2005) suggest that this might be attributable to more hydrogen bonding in the CeO2-P123 sample due to the presence of more -Si-OH groups,
The band assignments for the IR spectra of Ce-KIT-6 and CeO2-P123 are given in Table 1.
Table 1 Band assignments in the IR spectra of Ce-KIT-6 and CeO2-P-123 (Laha et al., 2002).
| Ce-KIT-6 | CeO2-P123 | By ref. [11] | ||
|---|---|---|---|---|
| Wavenumber (cm-1) | Bond assignment | Wavenumber (cm-1) | Bond assignment | Wavenumber (cm-1) |
| 3450 | nOH (Si-OH-Si) | 3250 | nOH (Si-OH-Si) | 3422 |
| 1600 | dOH(H2O) | 1600 | dOH(H2O) | 1633 |
| 1070 | nas (Si-O-Si) | 1100 | nas (Si-O-Si) | 1090 |
| 972 | nas(Si-O-Si) and /or n(Si-OH) | 950 | nas (Si-O-Si) and /or n(Si-OH) | 970 |
| 788 | ns(Si-O-Si) | 780 | ns (Si-O-Si) | 802 |
| 455 | d (Si-O-Si) and/or Si-O-Ce | 447 | d (Si-O-Si) and/or Si-O-Ce | 464 |
3.5 N2 Adsorption
Figure 7 a) shows the N2 adsorption isotherms of the catalysts. The siliceous material KIT-6 and SBA-15 used as template presented a IV type isotherm, characteristic of mesoporous materials and a H1 hysteresis loop associated to materials with a regular porous structure and a narrow pore size distribution. The CeO2-P123 and CeO2-F127 prepared by either the soft or the hard template procedure also showed type IV isotherm and a H3 hysteresis loop (Fig 7 b).
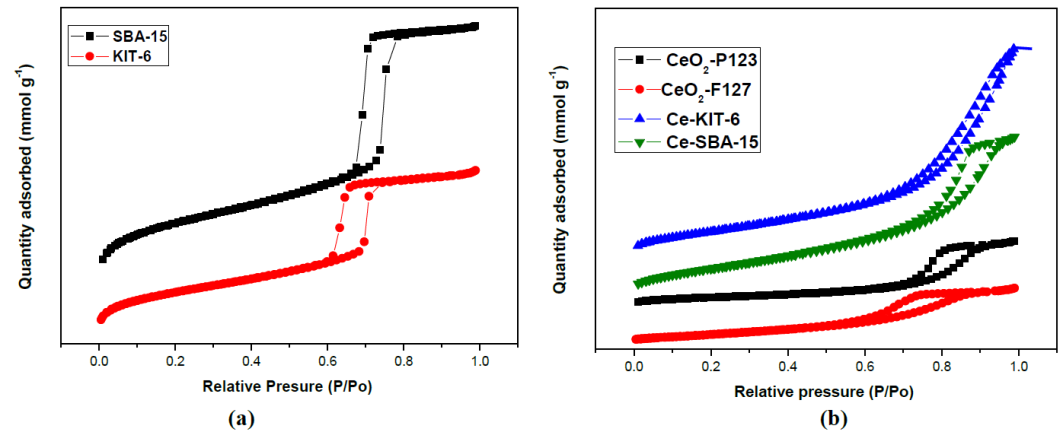
Fig. 7 Nitrogen adsorption-desorption isotherm for: a) SBA-15 and KIT-6, and b) CeO2-P123; CeO2-F127; Ce-KIT-6 and Ce-SBA-15.
Table 2 presents the textural properties of the synthesized materials. The surface area was calculated with the BET equation; the KIT-6 template had a large surface area (965 m2/g), whereas that Ce-KIT-6 prepared with this template and Ce-SBA-15 had a considerably low surface area (150 m2/g and 138 m2/g). It can be explained considering the cerium oxide is substantially denser than silica; having the same structure ceria will always have a smaller area per mass unit. The decrease in surface area for the samples with cerium can be attributed to the loss in the long-range ordering as also seen in the XRD.
Table 2 Nitrogen sorption pore diameter (Dp), pore volumen (Vp) and BET surface area (SBET) of samples.
| CATALYST | SBET (m2/g) | Vp (cm3/g) | Dp (nm) |
|---|---|---|---|
| KIT-6 | 965 | 1.157 | 9 |
| SBA-15 | 898 | 1.230 | 9.1 |
| Ce-KIT-6 | 150 | 0.365 | 15 |
| Ce-SBA-15 | 138 | 0.342 | 11 |
| CeO2-P123 | 47 | 0.115 | 13 |
| CeO2-F127 | 54 | 0.104 | 10 |
The materials prepared employing P123 and F127 as “soft” template, CeO2-P123 and CeO2-F127, presented low surface areas, of 47 and 54 m2/g, respectively. The pore size of all materials falls within the IUPAC’s mesoporous range (2-50 nm) (Table 2).
Figure 8 shows the pore size distribution of the materials calculated with the BJH method. The siliceous mesoporous template, KIT-6, exhibited a narrow and uniform pore size distribution averaging 9 nm. The Ce-KIT-6 material had small size pores (5 nm) and a uniform pore size distribution.
3.6 ICP-OES Chemical composition analysis
The amount of residual silicon in the Ce-KIT-6 and Ce-SBA-15 catalyst after washing with NaOH at 75 ºC was quantified by induced coupled plasma (ICP-OES) measurements. Results in Table 3 show that the silicon content in the Ce-KIT-6 and Ce-SBA-15 sample was 0.41 y 1.0 % wt., respectively. Therefore, the small amount of the silica remaining in the catalysts may have influenced its activity.
3.7 Temperature-programmed desorption (NH3-TPD and CO-TPD)
Table 4 presents the total acidity and basicity obtained by NH3- and CO2-TPD of the materials. All samples had much higher total basicity relative to total acidity. Therefore, the CO2-TPD data suggest that a substantial fraction of the hydroxyl groups were eliminated. Using adsorption NH3-TPD, on CeO2-P123 a highest Brönsted acidity was observed (34 mmol NH3/g). And this can be corroborated by observing the reaction products in the dehydration of glycerol. With the sample that presents more basic centers (CeO2-P123) the selectivity to acetol is higher.
3.8 Temperature-programmed reduction (H2-TPR)
The H2-TPR profiles of the samples is displayed in Figure 9. Ce-KIT-6 and CeO2-P123 materials presented one intense signal at approximately 500 ºC, Liu et al. 2014 suggest that it can be attributed to the reduction of cerium on the surface form Ce4+ to Ce3+. This reduction is explained by the following reaction:
(V0 is a vacancy)
Based on a deeper analysis of the observed reduction temperatures (500ºC), it can be said that the reduction of the cerium oxide takes place on the surface (Ke & Lai, 2014). In the case of Ce-KIT-16, the reduction temperature is around 400ºC, which may indicate the beginning of the reduction of ceria in the bulk. If we observe the wide peak of the Ce-SBA-15, it starts at a low temperature, at approximately 350ºC which would indicate the reduction of the bulk, until reaching a maximum of 500ºC (Figure 9) where the superficial reduction of the sample occurs.
In Figure 9 b) these variations in the reduction temperatures are observed more clearly, CeO2-P123 and CeO2-F127. Although it should be noted that the morphology in each of the groups of samples are different, since in TEM micrographs it is observed that in the case of the samples by hard template, there is an ordering originated by the structures of the SBA-15 and the KIT-16, otherwise with the samples in the soft template, since Disordered spherical aggregates are observed, and all this creates structural defects that will vary the structural parameters in each of the samples, therefore this may give rise to variations in the reduction temperatures (Ke & Lai, 2014).
3.9 Catalytic evaluation
The catalysts were evaluated for the glycerol dehydration reaction in gas phase at 320 ºC with three W/F ratios: 4.54, 9.09 and 18.18 gcath/mol. Ce-KIT-6 and CeO2-P123 catalysts were chosen to be evaluated in the reaction because both showed a higher concentration of basic sites measured by TPD (Table 4).
The glycerol conversions with time-stream for all samples are shown in Figure 9. All samples were found to be catalytically active in this reaction.
Figure 10 shows the conversion of glycerol as function of the reaction time (TOS). Both catalysts, Ce-KIT-6 and CeO2-P123, exhibited high conversion at short reaction time. After the maximum conversion point, the conversion of the catalysts decreased with time. With 18.18 gcath/mol W/F the Ce-KIT-6 and the CeO2-P123 catalysts also reached a nearly 100% glycerol conversion. The Ce-KIT-6 catalyst has a high catalytic activity at low reaction time, reaching a 100% conversion at W/F of 9.09 gcath/mol. After 1 h and up to 2 h of reaction, conversion becomes considerable stable and of approximately 60%.
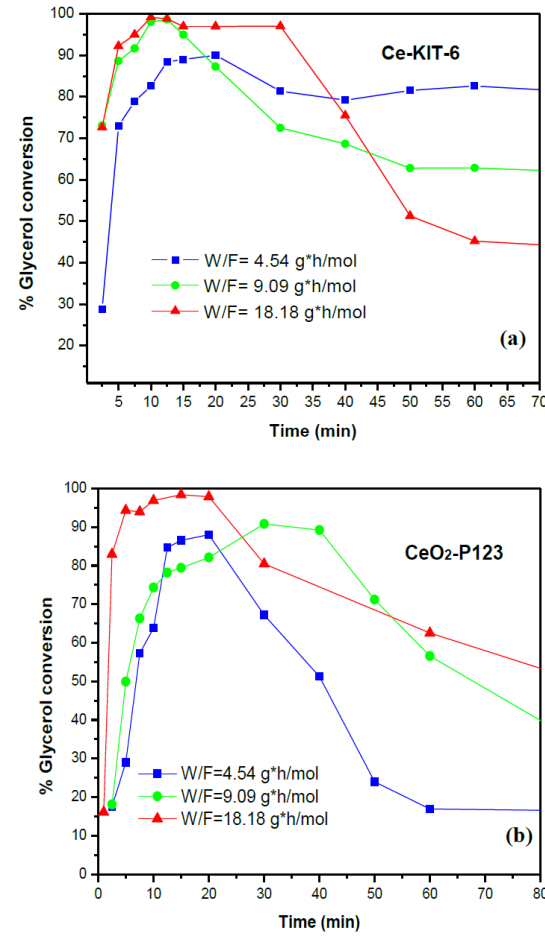
Fig. 10 Conversion of glycerol (T: 320 °C; W/F: 4.54, 9.09, and 18.18gcath/mol): a) Ce-KIT-6; b) CeO2-P123.
Also, during the dehydration of glycerol, it was observed that the glycerol conversion is less in the presence of CeO2-P123 than the corresponding Ce-KIT-6 sample. However, the latter is more stable in time than the former. It was also observed that at higher W/F there was greater stability (Figure 9). Pal, Cho, Kim, Gunathilake, and Jaroniec (2015) argue that may be attributable to the presence of tetra-coordinated Ce+4 ions, responsible for the activity, presumably being in the framework of Ce-KIT-6. It is clear that not all cerium atoms are available for catalysis. This is a common observation in the case of metal-incorporated MCM-41 and is correlated to the presence of heterometal ions inside the amorphous walls and thereby not accessible for reactants (Blasco, Corma, Navarro & Perez, 1995).
In the glycerol reaction, acetol, acrolein, allyl alcohol, acetaldehyde, propanol and 1,2-propanediol were the products detected under the applied experimental conditions.
Table 5 shows the selectivity (in mol%) to major products, acetol and acrolein, of the catalysts. The other products, allyl alcohol, propanol, acetaldehyde and 1,2-propanediol were present in low proportions (<10%). Both catalysts, Ce-KIT-6 and CeO2-P123, were selective to acetol (76% and 48%, respectively). The second important product was acrolein; the Ce-KIT-6 catalyst presented a 23% selectivity towards acrolein. Figure 11 compares the molar selectivity of acetol and acrolein with both catalysts at a reaction time of 1 h. A selectivity of higher acetol (76% mol) for the CeO2-P123 catalyst is clearly observed to 320 °C.
Table 5 Selectivity in glycerol dehydration of Ce-KIT6 and CeO2-P123 (tR: 60 min; T: 320 °C; W/F: 18.18gcath/mol).
| CATALYST | Ce-KIT-6 | CeO2-P123 |
| GLYCEROL CONVERSION (%) | 99 | 93 |
| SELECTIVITY TO PRODUCTS (% mol) | ||
| Acetol | 56 | 69 |
| Acrolein | 23 | 18 |
| Acetaldehyde | 10 | 4 |
| Allylic alcohol | 4 | 4 |
| Propanol | 1 | 2 |
| 1,2-Propanediol | 6 | 3 |
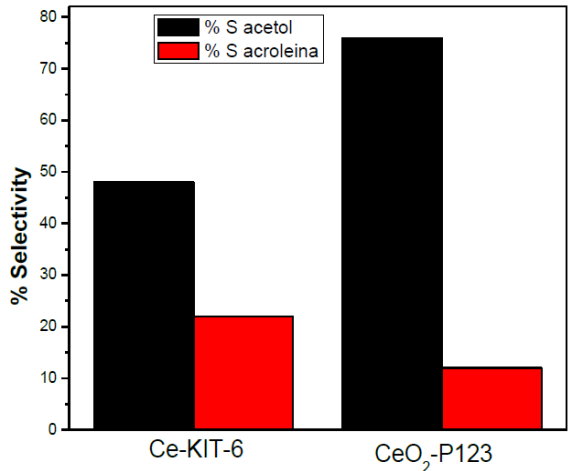
Fig. 11 Molar selectivity to acetol and acrolein of Ce-KIT-6 and CeO2-P123 catalysts (tR: 60 min; T: 320 °C; W/F: 9.09gcath/mol).
It is known that the catalytic acidity directly affects the glycerol conversion and the product selectivity. This effect was previously demonstrated for the catalytic dehydration of glycerol, where the Brönsted acid sites favoured acrolein (Laha et al., 2002). Which is formed by the protonation of the central hydroxyl group of glycerol followed by the consecutive elimination of a first water molecule, which leads to the formation of an enolic intermediate, which tautomerizes instantly to produce 3-hydroxy-propanal which is subjected to a second stage of dehydration that leads to the formation of acrolein (Katryniok, Paul & Dumeignil, 2013). Accordingly, Alhanash, Kozhevnikova, and Kozhenikov (2010) reported that a catalyst with a predominance of Lewis acid-base pair sites leads mainly to acetol production. Some researchers (Katryniok, Paul & Dumeignil, 2013; Kinage, Upare, Kasinathan, Hwang & Chang, 2010) proposed that the formation of acetol over basic sites is also possible and proceeds via sequential dehydrogenation, dehydration and re-hydrogenation of glycerol.
The formation of allyl alcohol can be ascribed to consecutive or parallel dehydration and reduction reactions, in which the enol intermediates in the presence of the redox catalyst resulted in a higher allyl alcohol yield (Katryniok, Paul, Belliere, Rey & Dumeignil, 2010).
The propanol, 1,2-propanodiol and acetaldehyde were products formed due to the hydrogenation of the C=C double bond by a consecutive gas-phase reaction.
According to several authors, Lafaye, Barbier, and Duprez (2015), Liu, Wang, Du, Zhong, and Borgna (2015), Shen, Yin, Wang, Lu, and Zhang (2014), and Martínez et al. (2018) a pathway for glycerol conversion was proposed considering consecutive or parallel dehydration-reduction reactions with the participation of both acidic and redox sites.
The presence of the other by-products is also reported due to the presence of residual silica in the material; such residual silica can increase the number of acid sites, for example in CeO2-F127 and CeO2-P123.
The presence of hydroxyl groups and basic sites on the materials used in this work was confirmed by NH3-TPD and CO2-TPD (Table 4). The basic aspect of the catalysts played an important role for the selectivity to acetol. We can observe that as the amount of basic sites increases the selectivity towards acetol also increases, according to the following order: CeO2-P123 > Ce-KIT-6.
A redox type mechanism can explain the formation of acetol. The reducing behaviour of the catalysts based on ceria supports this interpretation.
4. Conclusions
Mesoporous CeO2 was synthesised employing both, the soft and hard techniques, employing Pluronic P123 and F-127 (used like templates) and the ordered mesoporous silica SBA-15 and KIT-6 as templates, respectively.
The materials obtained with both techniques presented an ordered pore structure (observed with TEM) within the mesoporous size range (BET measurements). From TEM analyses it can be concluded that KIT6 (Figure 2a) and SBA-15 replicas (Figure 2b) are reasonably well ordered mesoporous metal oxides. The products mainly consist of large domains of CeO2 having a certain ordered framework. In the case of the samples made by soft template the morphology studied by TEM, it is observed that there are spherical agglomerates showing defined planes in some domains, Figure 2c and d.
The materials CeO2-P123 and CeO2-KIT-6 were active as catalysts for the glycerol dehydration reaction in gas phaseat 320 ºC.
The CeO2-P123 catalyst presented the highest catalytic activity (nearly 100% conversion) and was the more selective to acetol (76%) and had 12% selectivity to acrolein at 9.09 gcath/mol W/F reaction conditions.
At the same reaction conditions, the CeO2-KIT-6 catalyst had 56% selectivity to acetol and 23% to acrolein.
Results indicate that acid and basic properties are the most important parameters for the glycerol dehydration reaction: high acidity improves conversion and high basicity increases the selectivity to acetol.


 nueva página del texto (beta)


