


 nueva página del texto (beta)
 Inglés (pdf)
 Artículo en XML
 Referencias del artículo
 Enviar artículo por email
 Citado por SciELO
  Similares en
SciELO
Similares en
SciELO 
 Permalink
1. Introduction
The synthesis and application of non-stoichiometric materials have increased significantly in the last years; these materials have been shown to possess enhanced physicochemical properties (Zhang & Hong, 2017). Moreover, these materials can introduce extended defects regularly into a base structure (Kosuge, 1994).
Among the different non-stoichiometric materials, non-stoichiometric lithium cuprates (Li2+2xCuO2+x) can absorb CO2 as a function of extra lithium content (Lara-García et al., 2015; Palacios-Romero et al., 2009; Palacios-Romero & Pfeiffer, 2008). However, these studies focused on CO2 capture application rather than structural analysis. Recently, stoichiometric lithium cuprate (Li2CuO2) has attracted considerable attention due to its excellent CO2 chemisorption properties under a wide range of temperatures and different physicochemical conditions (Lara-García, Alcantar-Vázquez, et al., 2016; Lara-García & Pfeiffer, 2017; Lara-García, Ramírez-Moreno, et al., 2016; Matsukura et al., 2010; Yañez-Aulestia et al., 2018).
The Li2CuO2 crystalline structure was determined by Hoppe and Riek, 1970.This ceramic crystallizes into an orthorhombic structure with lmmm space group with the following cell parameters; a = 3.6615 Å, b = 2.8627 Å, and c = 9.3926 Å (Sapiña et al., 1990). Li2CuO2 crystalline structure can be observed as a layered arrangement because it is composed of parallel chains of CuO4 squares connected by tetrahedrons of LiO4 (Arai et al., 1998; Hewston & Chamberland, 1987; Ramos-Sanchez et al., 2017). These layer structures, i.e., Li2MO2 (where M is a transition metal), have attracted great interest for different applications. For instance, Li2CuO2 has been used as a cathode for lithium-ion batteries and as a superconductor material (Chung et al., 2003; Giri et al., 2001; Imanishi et al., 2006; Nakamura et al., 2006; Prakash et al., 2005; Ramos-Sanchez et al., 2017; Vitins et al., 2003; West et al., 2000). In addition to the CO2 captor application (Arai et al., 1998; Lara-García et al., 2015; Lara-García, Alcantar-Vázquez, et al., 2016; Lara-García & Pfeiffer, 2017; Lara-García, Ramírez-Moreno, et al., 2016; Matsukura et al., 2010; Palacios-Romero et al., 2009; Palacios-Romero & Pfeiffer, 2008; Yañez-Aulestia et al., 2018). All these applications are feasible due to the high lithium diffusion through the layer structure of Li2CuO2. In this work, the effect on crystalline structure produced by the excess addition of lithium atoms was analyzed to understand this material better and its possible new applications. Lithium excess into this crystalline structure produces new non-stoichiometric compounds, with the following general formula Li2+2xCu1-2xO2-x. Additionally, thermal treatments were performed on non-stoichiometric Li2+2xCu1-2xO2-x structure to study their effect on the crystalline lattice.
2. Materials and methods
Stoichiometric and non-stoichiometric lithium cuprates (Li2CuO2 and Li2+2xCu1-2xO2-x, respectively) were synthesized by the solid-state method. Both reagents, lithium oxide (Li2O, Aldrich 97%) and copper (II) oxide (CuO, Acros Organics 99%), were mixed mechanically and then calcined at 800 °C for 36 h. Li2+2xCu1-2xO2-x was synthesized with 5, 10, 25, 30, 40 and 60 at% of lithium excess. The nominal excess values were used to label the samples, i.e., 30-Li2CuO2 corresponds to the sample with 30 at% of lithium excess, while the stoichiometric sample was labeled as Li2CuO2. Finally, to evaluate the effect of thermal treatments on the crystalline structure, the 30-Li2CuO2 sample was calcined one and two times after synthesis at 800 °C for 8 h and 16 h. This temperature and calcined time were selected to be enough to see structural changes.
The samples were characterized by different techniques such as powder X-ray diffraction (XRD), pair distribution function (PDF G(r)) and solid-state nuclear magnetic resonance (NMR). The XRD patterns were obtained with a D8 Bruker diffractometer and a Cu anode X-ray tube with a Bragg-Brentano configuration. The Kα1 wavelength was selected with a Ge monochromator coupled to the primary beam. The scanned range was from 10 to 120° in 2θ, with a step size of 0.016° and 1 s/step. Crystalline structure refinements by the Rietveld method were performed using the FullProf-Suite software (Rodriguez-Carvajal, 1993). Molybdenum anode X-ray tube was used to reach the required high values of Q parameter (Q = (4π sin θ)/λ) for acquiring the pair distribution function. This anode was coupled to a Siemens D-500 diffractometer. The Kα radiation was selected with a cobalt filter, and the data were measured by step scanning of (1/8°) with a scintillation counter.
Li MAS NMR spectra were recorded on a Bruker avance 300 spectrometer at 116.6 MHz, with a standard 4-mm Bruker MAS probe. The spectra acquisition consisted of a single 2 μs pulse length; with a repetition delay of 2 seconds. Spinning frequencies were in the range of 8.25-11.33 kHz. A total of 2000 scans were accumulated for each spectrum. Chemical shift, reported in parts per million, are relative to a 1 N aqueous solution of lithium chloride (LiCl).
3. Results and discussion
Figure 1 shows the XRD patterns of different Li2+2xCu1-2xO2-x samples, including Li2CuO2 phase. As can be seen, all the samples fit the 01-079-1975 JCPDS file. Also, most of the samples present secondary phases with a total concentration lower than 3 wt%. The detected impurities are Li2O, CuO, LiOH, and Li3Cu2O4, produced by the lithium excess.
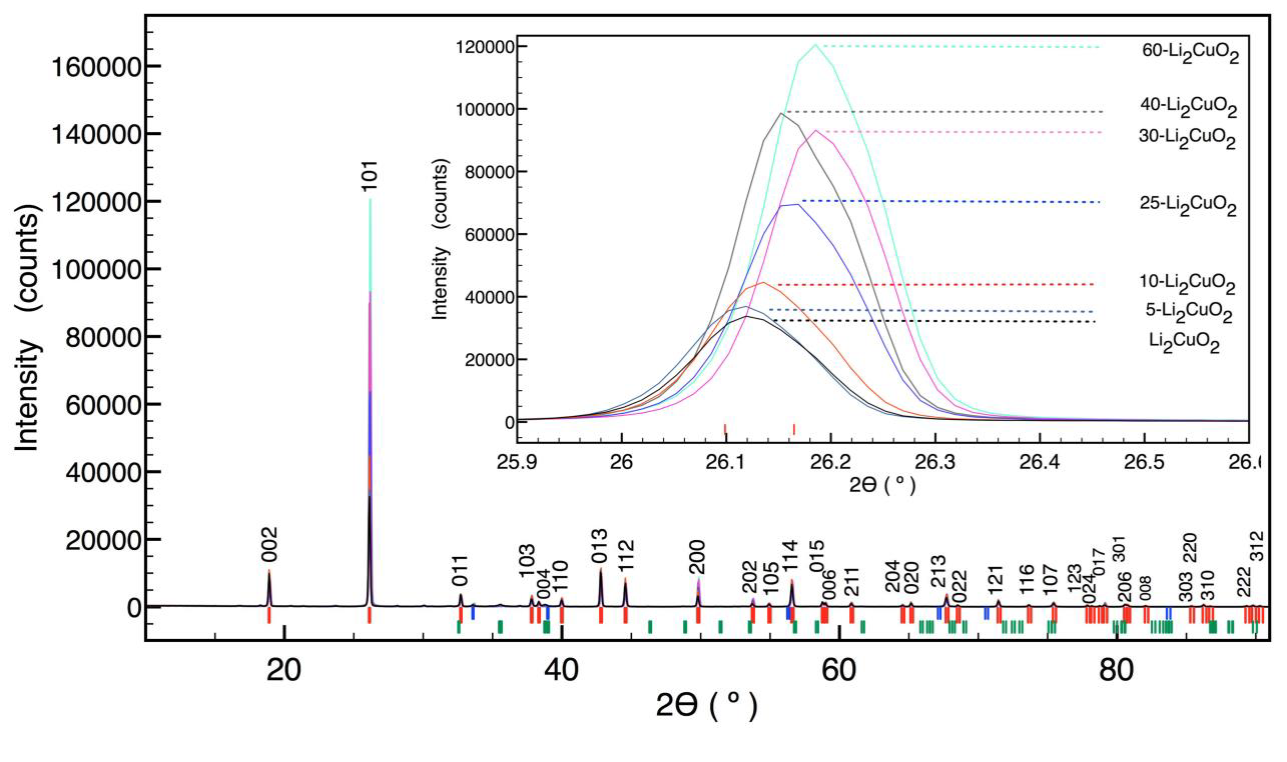
Figure 1 XRD patterns of 60-Li2CuO2 (-), 40-Li2CuO2 (-), 30-Li2CuO2 (-), 25-Li2CuO2 (-), 10-Li2CuO2 (-), 5-Li2CuO2 (-) and Li2CuO2 (-), with identification of phases Li2CuO2 (I), Li2O (I), CuO (I), LiOH (I) and Li3CuO4 (I).
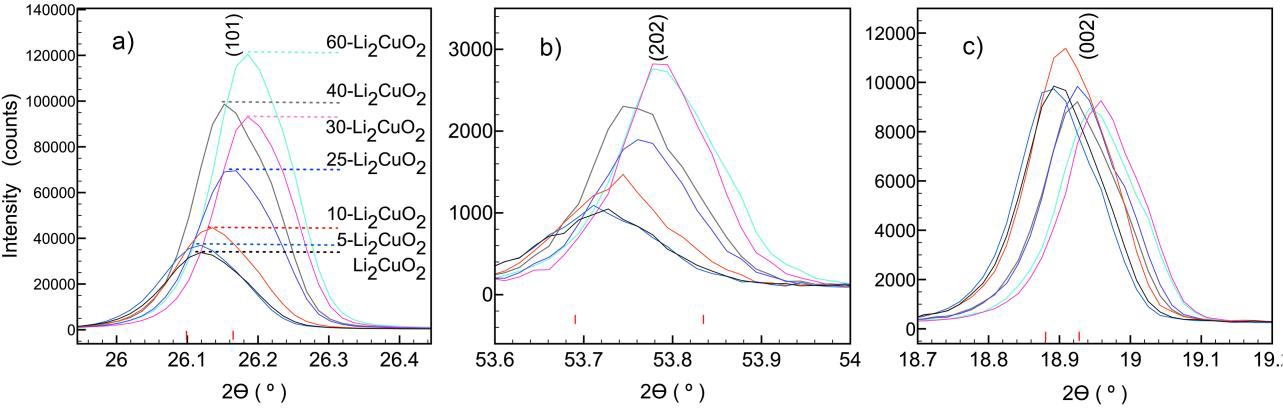
Figure 2 Comparison among XRD patterns of X-Li2CuO2 materials in planes: a) (101), b) (202) and c) (002).
Nevertheless, these phases are much lower than the total amount of lithium excess. Thus, they would not explain all the lithium excess added. The only significant difference among all these XRD patterns corresponds to the changes observed on the (101) peak intensity.
The intensity of (101) and (202) reflections for Li2CuO2 (Figure 2a and 2b, respectively) increases and the interplanar spacing “d” decreases with the lithium excess. However, the intensity does not show remarkable enhancement for (002) reflection (Figure 2c). The change of reflection intensity for the same family of planes would be produced by preferential orientation (Pecharsky & Zavalij, 2009). In this case, the (101) and (202) intensities increase 3.6 and 2.7 times at 60 at% of lithium excess. Therefore, the preferential orientation was discarded because the intensity gradient differed for the same family of planes. This result was confirmed by an additional XRD analysis for silica spheres; the results did not show a variation in the intensity peaks (data not shown). Hence, if this variation in a specific plane (hkl) is not produced by preferential orientation, it must be explained by a change in structural factors (Pecharsky & Zavalij, 2009).
In this study, the following two hypotheses are proposed to explain the change on intensity for (101) reflection as a function of lithium excess.
i. Copper atoms are substituted by lithium atoms.
The general formula of lithium cuprates with lithium excess, Li2+2xCu1-2xO2-x, is proposed considering the previous work of Suba et al. (1994) . In that study, the copper oxide was doped with lithium, obtaining materials of type Cu1-xLixO1-(. They demonstrated that lithium could substitute copper atoms in copper oxide structure until 25 at%. After this limit, the LiCu2O2 is formed, followed by the emergence of the Li2CuO2. Based on the previous statement, this work proposed the mechanism shown in Figure 3. Firstly, lithium is incorporated into the CuO structure by substituting copper sites with a concentration lower than 25 at%. Then, at higher concentrations of lithium (>25 at%), lithium cuprates are formed because copper oxide is oversaturated, Li2CuO2 is produced in the first instance. Finally, the copper oxide with lithium substitution forms the structure Li2+2xCu1-2xO2-x. Also, it is reported that lithium and copper atoms occupy the same crystallographic sites in different lithium cuprate structures (Hibble et al., 1990).

Rietveld refinement was performed to demonstrate that lithium is located in copper Wyckoff positions. The Li2CuO2 phase reported by Sapiña et al. (1990) was used as an initial model. The results of refined parameters for each X- Li2CuO2 sample are presented in Table 1. It can be observed that some of GOFs values could be considered rather high. There are two reasons to explain this. First, at low lithium concentrations (< 25%) the secondary phases could not be exhaustively refined due to the low intensity of their peaks. On the other hand, in the lithium cuprates with higher lithium concentrations (>10%), the experimental (101) intensity, evidenced crystallographic texture that, of course, affected the profile fitting.
Table 1 Rietveld refinement parameters for the lithium cuprates containing different lithiumexcess.
| Parameters | Previously reported by Sapiña et al. (1990) | Lithium excess (at%) | ||||||||
| 0 | 5 | 10 | 25 | 30 | 40 | 60 | ||||
| Cell Parameters (Å) | a | 3.6615 | 3.6608 | 3.6605 | 3.6603 | 3.6604 | 3.6606 | 3.6601 | 3.6603 | |
| b | 2.8602 | 2.8617 | 2.8618 | 2.8620 | 2.8626 | 2.8630 | 2.8623 | 2.8630 | ||
| c | 9.3926 | 9.3911 | 9.3905 | 9.3906 | 9.3923 | 9.3925 | 9.3919 | 9.3924 | ||
| Atomic positions | Li | z | 0.2869 | 0.2863 | 0.2837 | 0.2856 | 0.2691 | 0.2584 | 0.2560 | 0.2200 |
| O | z | 0.3578 | 0.3575 | 0.3580 | 0.3580 | 0.3612 | 0.3659 | 0.3666 | 0.3710 | |
| Occupation | Li | 1 | 1 | |||||||
| Cu | 1 | 0.864 | 0.840 | 0.856 | 0.432 | 0.304 | 0.288 | 0.208 | ||
| O | 1 | 0.940 | 0.972 | 0.936 | 0.616 | 0.460 | 0.448 | 0.300 | ||
| B isotropic (Å2) | Li | - | - | |||||||
| Cu | - | 1.154 | 1.148 | 0.987 | 1.580 | 1.970 | 2.120 | 2.440 | ||
| O | - | 1.657 | 2.357 | 1.627 | 4.500 | 5.500 | 6.300 | 5.600 | ||
| RF (%) | - | 3.91 | 4.88 | 3.16 | 2.66 | 3.76 | 4.32 | 4.24 | ||
| Rwp (%) | - | 8.19 | 7.13 | 4.69 | 2.80 | 4.68 | 4.95 | 3.70 | ||
| GoF | - | 3.38 | 3.39 | 2.99 | 2.52 | 3.04 | 3.56 | 3.33 | ||
As shown in Table 1, total copper occupancy decreases from 1 to 0.208, for Li2CuO2 and 60-Li2CuO2, respectively. Additionally, oxygen occupancy is reduced from 1 to 0.3. This result is according to the proposed stoichiometry (Li2+2xCu1-2xO2-x), where the reduction of oxygen concentration equilibrates the lithium excess into the structure. Also, it reinforces the idea that lithium substitutes copper positions into the Li2CuO2 structure.
Additionally, Li2CuO2 structure was modeled considering that the Wyckoff position (2b) is occupied by copper and lithium (Table 2). In this case, the refined parameters presented similar results to those obtained in the previous refinement. The copper occupancy remarkably varied as a function of lithium concentration; the atoms of lithium excess replaced copper from site 2b, significantly decreasing its occupancy. This methodology improved the Rietveld analysis because the weighted residual square sum (Rwp) decreased to 4.49, unlike the first model from above, where the Rwp value was 4.68. Based on these results, the increment of (101) intensity with the lithium excess is produced due to the structure factor modified by the copper substitution with lithium. It was also verified through simulations using CrystalMaker software (Palmer, 2014), where the structural model of Li2CuO2 was modified because of the intensity increment of the (101) plane. However, this hypothesis, although plausible, does not explain all the lithium added. The proposed stoichiometry (Li2+2xCu1-2xO2-x) only allows copper substitution with lithium excess concentration lower than 50 at%. Hence, it is necessary to determine the position of extra lithium added.
Table 2 Rietveld refinement, in which the copper Wyckoff position was share with lithium.
| Parameters | Previously Reported by Sapiña et al. (1990) | 30%, 36 h | ||
| Cell parameters (Å) | a | 3.66153 | 3.6606 | |
| b | 2.86022 | 2.8630 | ||
| c | 9.39258 | 9.3923 | ||
| Atomic positions | Li | z | 0.2869 | 0.261 |
| O | z | 0.3578 | 0.3636 | |
| Occupation | Li | 1 | 1 | |
| O | 1 | 0.312 | ||
| Cu | 1 | 0.104 | ||
| Li | 0 | 0.948 | ||
| Rwp (%) | - | 4.49 | ||
| GoF | - | 2.95 | ||
i..Intercalation of lithium atoms in interstitial positions.
In order to determine the probable position of lithium atoms, further analyses were carried out. Isotropic atomic displacement parameters (B) for lithium were omitted from the refinement due to its small structure factor, but lithium excess affects the atomic oxygen positions (Table 1). These structural changes are quantified by analyzing the deformation of the polyhedron formed by Li-O. Figure 4 shows that Li-O-Li angle varies from 140° to 105.9° for stoichiometric Li2CuO2 and 60-Li2CuO2 samples, respectively. This effect notably increases the Li2CuO2 cavity volume, where lithium excess would be located and occupy interstitial positions. Also, the Li-O bond distance decreases from 1.967 Å for stoichiometric Li2CuO2 sample to 1.687 Å for 60-Li2CuO2 sample.
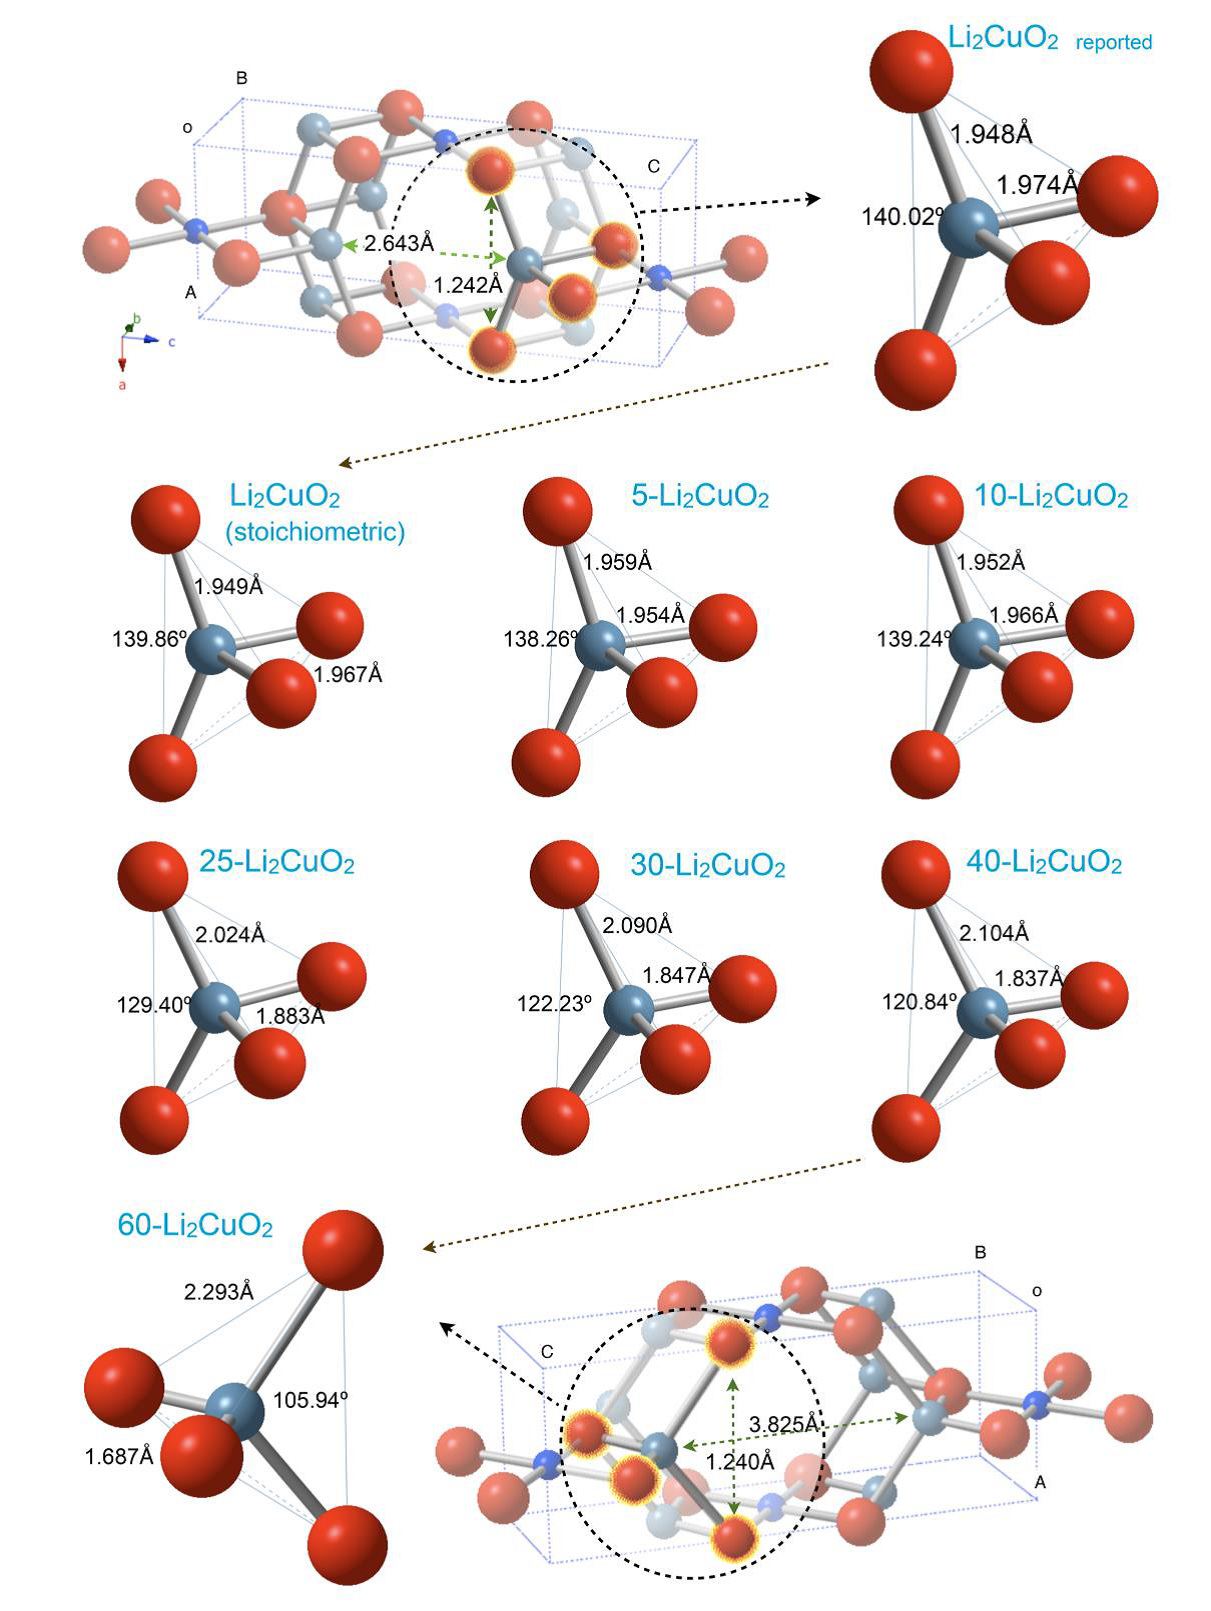
Figure 4 Schematic representation of crystal structures of the different X-Li2CuO2 samples, showing the Li-O tetrahedral deformation evolution as a function of the lithium excess. Only the complete structures of the Li2CuO2 and 60-Li2CuO2 are presented.
These bond distances agree with other studies (Migeon et al., 1975).
The delocalization of lithium atoms can distort the crystalline lattice and produce limited structural coherence or intrinsic disorder. Therefore, pair distribution function analysis was used for further characterizing the atomic-scale structure of lithium cuprate samples. The maximum wave vector (Qmax) acquired with Kα Mo radiation was 15.34 Å-1, and the real-space resolution of the PDFs was 0.4 Å. This resolution does not allow to resolve some Li-O and Cu-O bonds because they are merged, but yet allows to reveal well the characteristic sequence of distinct interatomic pair distances and to differentiate between the high or low degree of structural coherence in crystalline Li2+2xCu1-2xO2-x.
Figures 5a and 5b show the PDF G(r) for stoichiometric Li2CuO2, 30- and 60-Li2CuO2 samples. As shown, the peaks in the atomic PDFs do not suffer a loss of sharpness in all the radial distance lengths, representing structural coherence at short distances (< 1 nm). The peaks below 3 Å are overlapped (Figure 5b) due to the PDF resolution. However, the integrated area of the peaks, directly related to the profile broadening, can provide the number of atomic neighbors of type j around atomic species of type i. Therefore, the partially merged peaks centered at 1.7, 2.1 and 2.6 Å, independently of the lithium content, can be associated with the deviation of the lithium atomic positions and the lithium excess in interstitial sites. The number of neighbors or multiplicity determines the size of the peaks (the integrated area) at that length. In Li2CuO2, every Li has two nearest neighbors (NN) at 1.7 Å, two second-NN oxygen atoms at 2.1 Å, four third-NN lithium atoms at 2.6 Å, and one NN copper atom at about 2.7 Å.
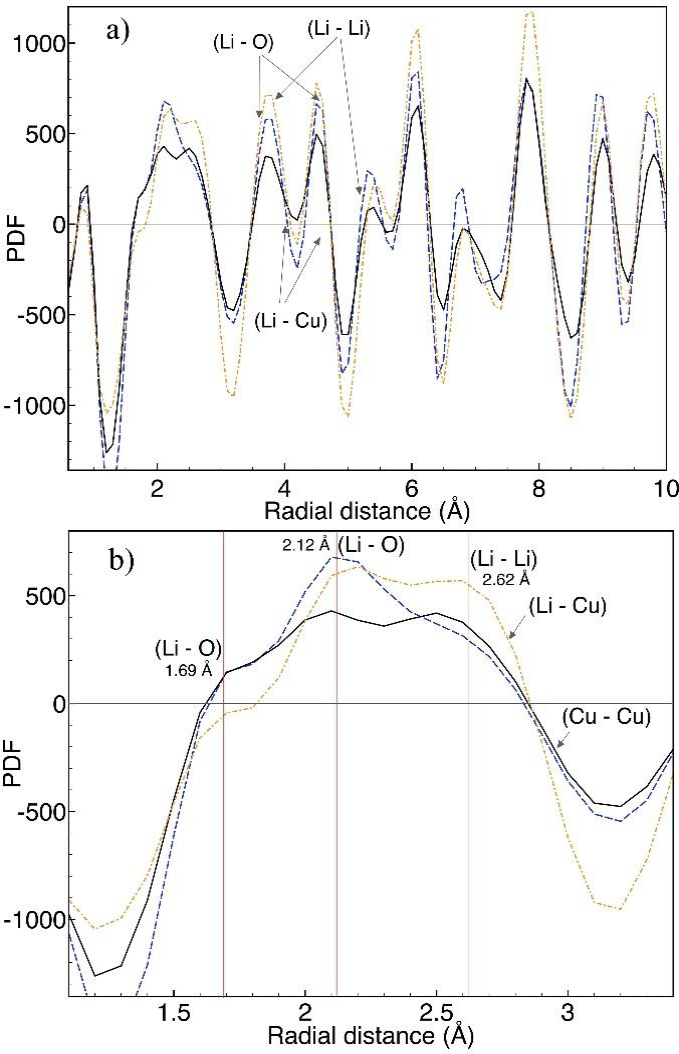
Figure 5 Pair distribution functions of the Li2CuO2 (blue), 30-Li2CuO2 (black) and 60-Li2CuO2 (orange) samples. a) From 1 to 10 Å, b) from 1 to 3.5 Å.
The width of the peaks in a PDF represents the probability distributions for the interatomic distances associated with given atom pairs. This distribution is affected by both atomic motion and atomic disorder. When the disorder is sufficiently small, it can be described by a Gaussian distribution with some width. The Gaussian widths can be modeled in isotropic or anisotropic atomic displacement parameters (ADPs), and highly anisotropic ADPs indicate the presence of non-Gaussian disorder. Also, when atoms are directly neighboring one another, their dynamics tend to affect one another. For example, the thermal motions of neighboring atoms tend to push and pull one another, thus decreasing the time-averaged distance distribution. This has the effect of narrowing the width of the associated peak. In this study, we focused on peak position rather than the broadening of the peaks.
7Li MAS-NMR spectra were obtained to study the local atomic arrangement for X-Li2CuO2 samples (Figure 6). All these spectra showed the presence of two different isotropic signals: The first one is close to 0.1 ppm, and the second appears at 350 ppm. The order or relationship between the lithium content in the X-Li2CuO2 samples and the relative intensities of NMR signals was not observed. A previous study (Palacios-Romero et al., 2009) found a direct relation between lithium content and NMR signals. However, the samples had different thermal history, changing lithium location into X-Li2CuO2 structures. In any case, NMR results confirm the presence of lithium atoms in two different crystallographic positions, according to Nakamura (Nakamura et al., 2005) . Furthermore, peak wideness and position remained practically constant for all samples, meaning that strong paramagnetic effect did not occur. This result confirms that the copper oxidation state remains constant in all samples, independently of lithium excess.
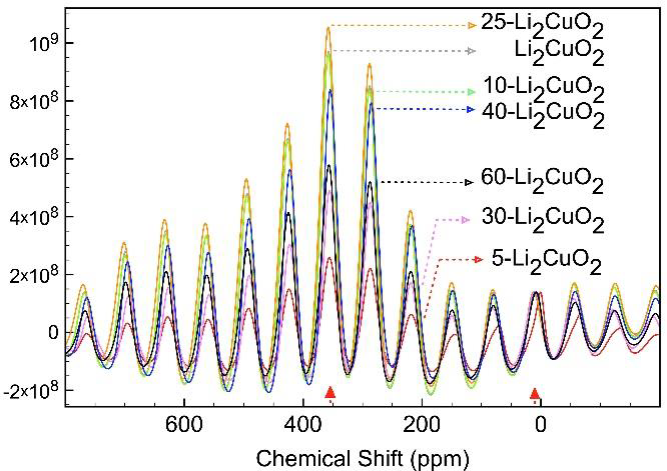
Figure 6 7Li MAS NMR of the different X-Li2CuO2 samples after 36 hours of thermal treatment. Isotropic peaks were identified at 0.1 and 350 ppm; all other signals correspond to spinning side bands. All the spectra were normalized to the 0.1 ppm signal peak.
The 30-Li2CuO2 sample was annealed at 800 °C for 8 to obtain high Li2CuO2 stability. Figure 7 shows that the (101) reflection intensity decreases as the annealing time increases, acquiring the regular relative intensity of the stoichiometric structure. Thus, the kinetic energy supply by the temperature rearranges the grating into a more stable Li2CuO2 structure. This behavior was also observed for the other X-Li2CuO2 samples (data not shown). Additionally, the Rietveld refinement results (Table 3) show that all the modeled parameters have quite similar values to the previously refined Li2CuO2 structure (Sapiña et al., 1990). The GoF of the refinement decreased from 3.04 to 1.90 for samples no-heat treated and annealed for 16 h, respectively. The previous results represent a significant improvement of the refined parameters as a function of the heating time.
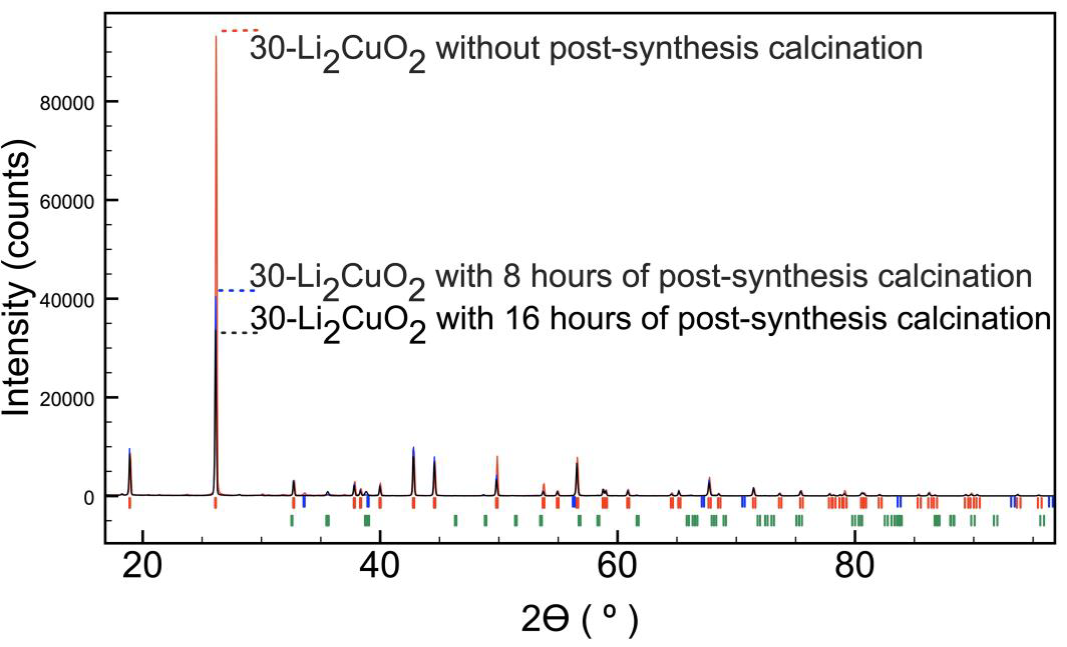
Figure 7 XRD patterns of the 30-Li2CuO2 sample after 36, 44 and 52 hours of thermal treatment, with identification of phases Li2CuO2 (I), Li2O (I), CuO (I).
Table 3 Rietveld refinement parameters for the 30-Li2CuO2 after different thermal treatments.
| Parameters | Previously reported by Sapiña et al. (1990) | Post-synthesis calcination time, sample 30-Li2CuO2 | ||||
| 0 hours | 8 hours | 16 hours | ||||
| Cell parameters (Å) | a | 3.66153 | 3.6606 | 3.6606 | 3.6606 | |
| b | 2.86022 | 2.8630 | 2.8623 | 2.8623 | ||
| c | 9.39258 | 9.3924 | 9.3917 | 9.3916 | ||
| Atomic Positions | Li | z | 0.2869 | 0.2684 | 0.2892 | 0.2824 |
| O | z | 0.3578 | 0.3636 | 0.3558 | 0.3590 | |
| Occupation | Li | 1 | 1 | 0.980 | 0.980 | |
| Cu | 1 | 0.304 | 0.824 | 0.856 | ||
| O | 1 | 0.460 | 1 | 1 | ||
| B isotropic (Å2) | Li | - | - | |||
| Cu | - | 1.970 | 1.200 | 1.084 | ||
| O | - | 5.500 | 2.820 | 2.199 | ||
| Rwp (%) | - | 4.68 | 3.02 | 2.95 | ||
| GoF | - | 3.04 | 1.94 | 1.90 | ||
Also, lithium polyhedral deformations were analyzed to determine the effect of time annealing on crystalline structure (Figure 8). The 30-Li2CuO2 sample presents a distorted O-Li-O angle of 122.23° and Li-O bond distances of 2.090 Å and 1.847 Å before the heating treatment. However, these values are 137.09°, with 1.967 Å and 1.952 Å, respectively, after 8 and 16 h of extra heating time. These final values agree with those reported by Sapiña et al. (1990) . Then, further thermal treatments must produce lithium diffusion to initial crystallographic positions.
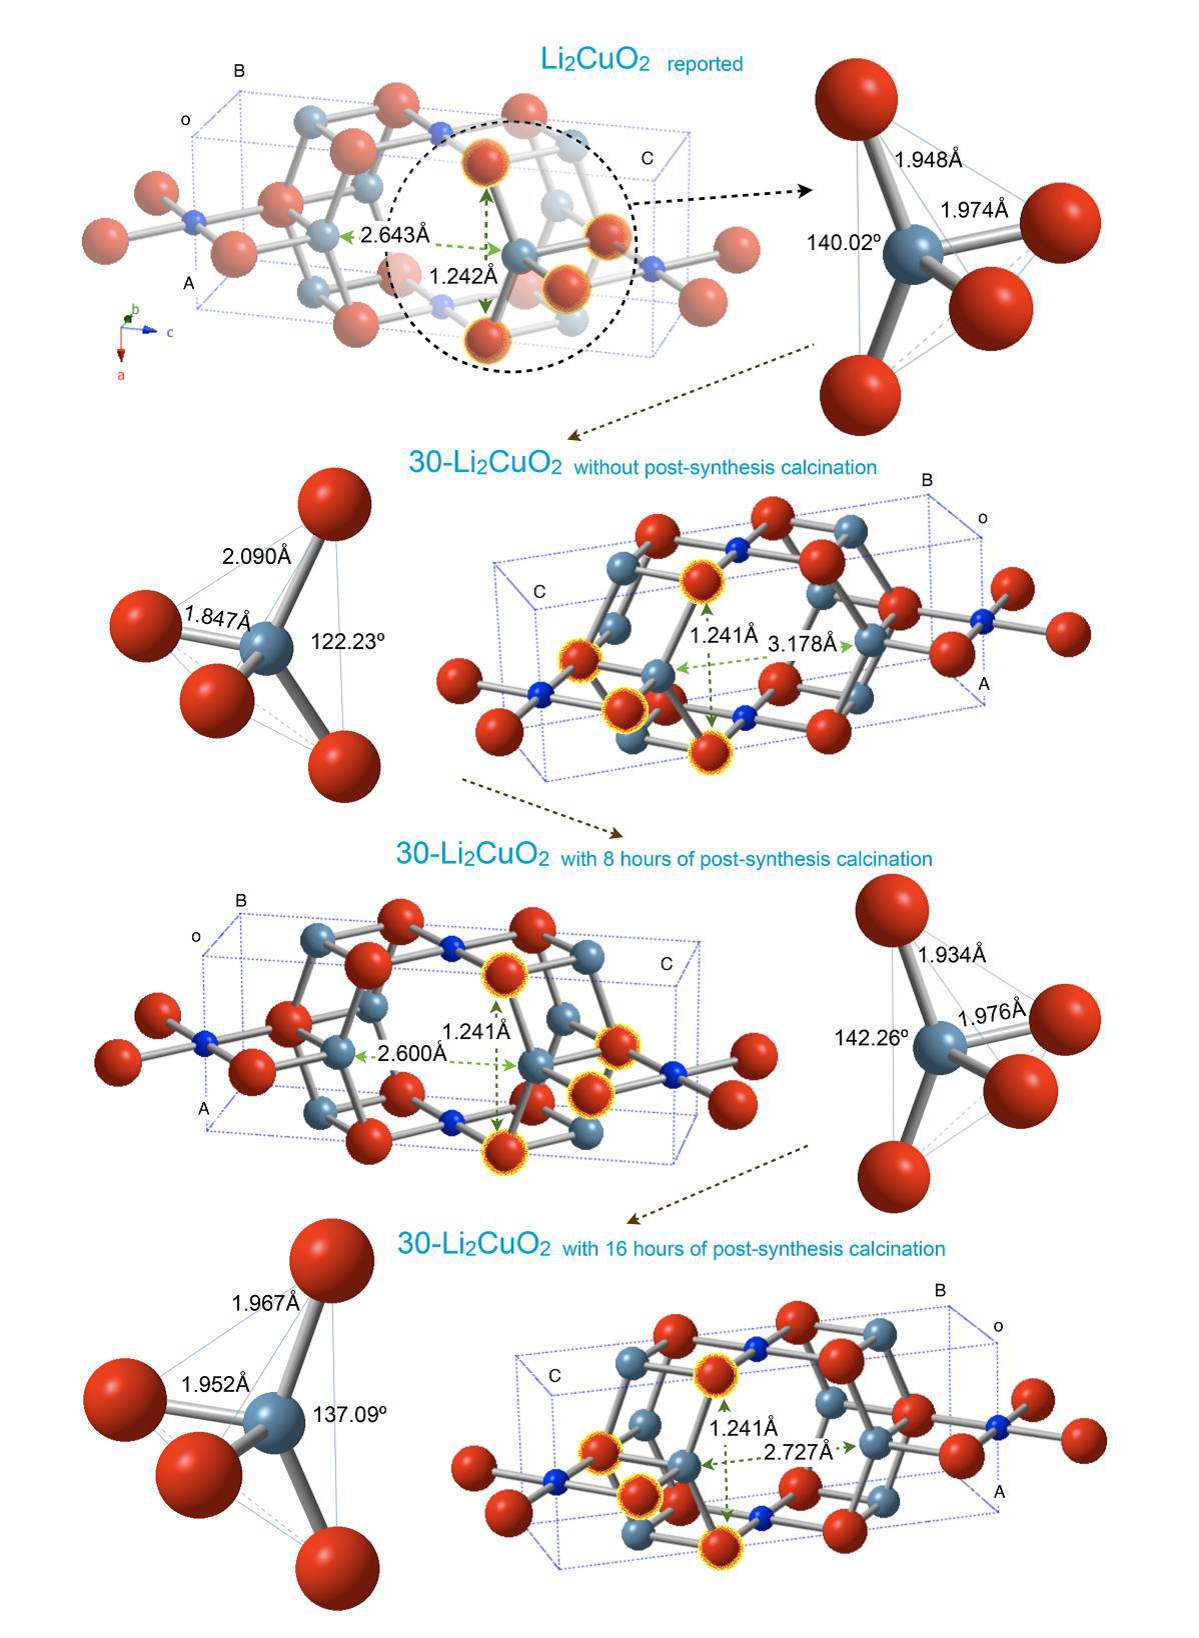
Figure 8 Schematic representation of crystal structures of the 30-Li2CuO2 sample after the different times of thermal treatments. The complete structures and the Li-O tetrahedral deformation are shown.
PDF analysis was performed to determine the effect of thermal treatments on the structural coherence of Li2CuO2 (Figure 9).
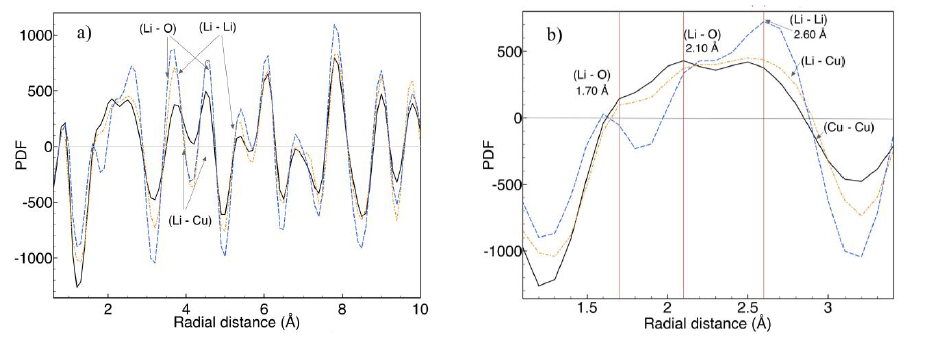
Figure 9 Pair radial distribution functions of 30-Li2CuO2 sample after 36 (black), 44 (orange) and 52 hours (blue) of thermal treatment. a) From 1 to 10 Å, b) from 1 to 4 Å.
PDF G(r) indicates local order at distances shorter than 1 nm (Figure 9a). Below 0.3 nm (Figure 9b), the sample with the longest thermal treatment presents the highest atomic order due to the sharpest peaks. In this case, the wide peak is deconvoluted into three peaks centered at 1.7, 2.1 and 2.6 Å, as in the stoichiometric Li2CuO2 sample (Figure 5). The intensity of these peaks changes between the stoichiometric Li2CuO2 and 30-Li2CuO2 samples. Thus, the Li2CuO2 crystal structural order is recovered at radial distances shorter than 0.3 nm, but with different M-O bond abundance (where M = Li or Cu). This result suggests that thermal treatment induces lithium diffusion with the consequent relocation of some of these atoms to copper positions. However, as mentioned before, not all lithium in excess can be accepted in copper sites. Therefore, the thermal treatment must give enough energy to produce the sublimation of this extra lithium.
Finally, 7Li MAS NMR spectra were obtained for 30-Li2CuO2 samples thermally treated for different times (Figure 10). Spectra show the presence of the same two isotropic signals located at 0.1 and 350 ppm. However, in these cases, after normalizing the 0.1 ppm signal, 350 ppm signal intensity did present a relationship with time, increasing the NMR signal as a function of thermal treatment. Therefore, if it is considered that lithium excess is being relocated at the copper Wyckoff structural positions (according to all previous results), this signal must correspond to lithium atoms located at copper positions, which corresponds to lithium atoms being more polarized due to the oxygen square surrounding geometry.
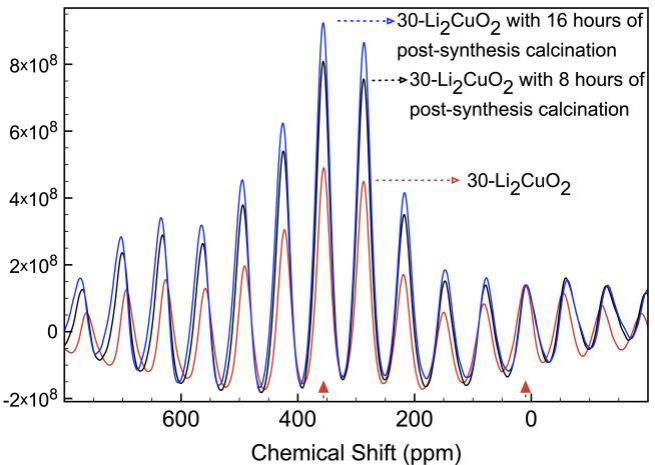
Figure 10 7Li MAS NMR of the 30-Li2CuO2 sample, after 36, 44 and 52 hours of thermal treatment. Isotropic peaks were labeled with filled triangles, all other peaks correspond to spinning side bands. All the spectra were normalized to the 0.1 ppm signal peak.
The results suggest that lithium cuprate Li2CuO2 was modified by adding extra lithium (from 5 to 60 at%). This extra lithium is in two different positions in the Li2CuO2 base structure. The expression in Kröger-Vink notation, shown in eq. 1, describes lithium cuprates with lithium excess. This expression is analyzed in four parts to describe the different positions and relative concentrations of lithium, copper, and oxygen atoms:
I. The first part of the expression is related to copper and lithium atoms in the crystallographic sites 4j and 2b respectively, in accordance with Sapiña et al. (1990) . However, in X-Li2CuO2 materials a copper deficiency (1-2y) occurs when lithium concentration increases.
II. The copper vacancies, induced by adding extra lithium, are substituted by lithium atoms in a relation of 2y. Also, “y” should be lower than 50%; otherwise, lithium cuprate converts completely to lithium oxide, which disagrees with the experimental data.
III. The oxygen occupancy is reduced when the lithium concentration is increased, maintaining the electroneutrality of the phase. Therefore, this part of the expression defines the oxygen concentration as a function of lithium concentration.
IV. The last part of the expression describes the second position for lithium in excess. The “z” coefficient defines the lithium fraction in the interstitial sites at the center of the Li2CuO2 cell. Therefore, the total concentration of lithium in excess (X) is the sum of “y” and “z” coefficients.
4. Conclusions
XRD, PDF and NMR structural analyses of different lithium cuprates synthesized by the solid-state reaction were carried out, varying the excess lithium amounts (5, 10, 25, 30, 40, 50 and 60 at%). In all the cases, synthesized samples presented Li2CuO2 type-structures. XRD patterns showed that (101) peak intensity increased as a function of lithium content. To analyze these results different Rietveld refinement analyses were done on XRD patterns, while other characterization techniques (NMR and PDF) were performed to corroborate the analysis. All these structural analyses strongly suggest that lithium excess is taking place in two different positions. Some lithium atoms could be in copper Wyckoff positions, while others would be in interstitial positions, as previously proposed.
On the other hand, when samples were further thermally treated, the (101) peak tended to recover its relative standard intensity. In these cases, Rietveld analyses and NMR and PDF experiments suggest that lithium atoms are reorganized where lithium was initially located.

