1. Introduction
HSLA steels are widely used in the pipeline industry (Xie et al., 2014). In this sense, research continues in the direction reducing weight in vehicles and construction components, contributing to fuel reduction, and improving safety standards (Caballero et al., 2009). Olivares et al. (2008) reported that steel used in the pipeline industry must fulfill stringent requirements. These necessities can be achieved by improving steel-making procedures, plate-rolling schedules, and pipe-making technologies. In this way, being feasible the production of high-grade pipes for critical applications, such as sour-service, heavy wall-pipes for deep-sea, and pipelines for arctic regions. Thus, it is noticeable that in all these applications a combination of strength, toughness, and weldability are needed (Takechi et al., 2003). In this respect, from an engineering point of view, the yield strength value is one of the most important mechanical properties for pipeline design. Pipeline steel must satisfy specific yield strength values to perform its function adequately. To achieve this goal, it is essential to control the microstructure of the steel, which depends on the chemical composition and thermomechanical processing control (Sanz et al., 2017).
In the present work, the results of microstructural and mechanical characterization of a Fe-0.2C-0.6Mn-0.2Mo-1.0Cr steel are reported. The studied steel was thermomechanically treated, from a soaking temperature of 1250 °C to 870 °C, and the plate cooled either in water + tempering (HR+WQ+T) or air (HR+AC). The microstructure and mechanical properties obtained from the proposed processing routes were used to quantify the different strengthening mechanism contributions to the yield strength value by using different approaches reported in literature.
2. Materials and Methods
The steel for this research was made from high purity elements Fe, Mn, Ti (99.99%) and FeSi, FeCr, FeCa, FeMo ferroalloys, placed, into an alumina crucible to avoid external contamination. Fusion started by evacuating the induction furnace’s chamber until an internal pressure of 1×10⁻³ atmospheres was reached, and argon gas was immediately fed. This procedure was repeated three times, after this, melting of elements and ferroalloys was initiated. Once the bath was fully liquid, a degassing procedure was executed for 30 minutes, with the main purpose of removing any gases dissolved in the liquid melt. Then, the liquid steel was cast into a rectangular Cu-mold with the following dimensions: 3 cm thickness × 10 cm length × 5 cm width. The steel-ingot was chemically analyzed using the mass spectrophotometric technique, and the resultant chemical composition is given in Table 1.
Table 1 Chemical composition of steel (in wt. %).
| C | Mn | Si | P | S | Mo | Cr | V | Nb | Ti | Ca | N | Fe |
|---|---|---|---|---|---|---|---|---|---|---|---|---|
| 0.20 | 0.60 | 0.15 | 0.010 | 0.001 | 0.2 | 1.0 | <0.001 | <0.001 | 0.012 | 0.0020 | <0.004 | Bal. |
Hot rolling of the ingot was carried out on a Fenn reversible mill (0.127 m rolls, 25 tons, and 0.166 m/s of rolling speed). The rectangular ingot had a Pt-Pt-18 % Rd thermocouple inserted at its center, and it was heated up to 1250 ºC, at a heating rate of 0.4 ºC/s, soaked for 60 minutes, and immediately hot-rolled as shown schematically in Fig. 1.
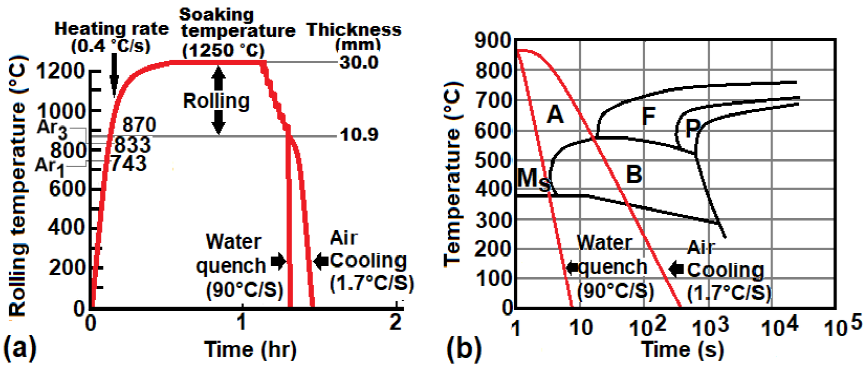
Figure 1 (a) Thermomechanical processing involving heating, soaking, rolling of slab, and cooling of the plate in different media, (b) TTT diagram (Vander Voort, 1991). A=Austenite, F=ferrite, P=Pearlite, B=bainite, Ms= Martensite start temperature.
Ingot hot rolling started at 1250 °C and ended at 870 ºC, achieving a total deformation of 63%.
After the last hot rolling pass, the plate was cooled either in stirring water with a cooling rate of 90 °C/s or in the air with a cooling rate of 1.7 °C/s. It is important to remark that the water quenched specimen was also tempered at 500 °C for 20 min as an alternative heat treatment condition.
The microstructure of the hot-rolled and cooled plates was analyzed using a scanning electron microscope (SEM, JEOL - 7600f), and a transmission electron microscope (TEM, JEOL- 1200EX), both microscopes equipped with EDS microanalysis. Samples analyzed by optical microscope (OM) and SEM were roughened to 1200 SiC sandpaper, polished with alumina, and etched with 2% Nital solution. An OM coupled to an image analyzer with a software Image Pro-Plus was used, for the quantitative determination of grain size, measuring ten fields per sample, which accounted for a total analyzed area of about 6 mm2 per specimen. Thin foils for TEM were prepared using a Struers Tenupol 235 Twin Jet Electro Polisher in a 60 vol. % HNO3 + 40 vol. % H2O solution as the electrolyte. Finally, mechanical characterization involving tensile test measurements was evaluated according to (ASTM E8-04, 2004) specifications. The specimens (n = 3) were machined with the following dimensions: 50 mm in gauge length, 12.5 mm in width, and 2 mm in thickness. Then, they were pulled to fracture at room temperature (25 °C ± 1) at a strain rate of 5.0 ×10⁻³ s-1 using an Instron 1125 machine (MTS Systems Corporation, Eden Prairie, MN, USA). One-way ANOVA analysis (Minitab 19, USA) was applied to determine significant differences between groups. p < 0.05 was accepted as statistically significant.
3. Prediction of yield strength
The approaches used for predicting the yield strength tensile property consisted of adding different strengthening mechanisms. In this sense, several mathematical equations have been reported, for instance:
Edmonds et al. (1990) report:
Where
Yakubtsov et al. (2008) and Kozasu (1988) proposed:
The above equations account for the contribution of short-range internal stresses
produced by interstitial and substitutional elements in solid solution and grain
size (
To feed Eq. 1 (Charleux et al., 2001; Honeycombe, 1997; Misra et al., 2005):
where
To feed Eq. 2 (Wang et al., 2006):
In those expressions, the concentration of the different elements is expressed in wt. %, and the grain size (d) in millimeters(mm).
The corresponding dislocation hardening contribution is assumed to be the result of the contribution of forest dislocation. The flow stress is simply assumed to obey the classical relation with statistical store dislocation density, ρ (Honeycombe, 1997):
where α is a numerical factor that characterizes the
dislocation-dislocation interaction, specific to the material, and takes a value of
0.3 for iron. M is the average Taylor factor for polycrystals
corresponding to 3 for bcc-crystals. μ is the shear modulus for
iron with a value of 81600 MPa, b is the Burger´s vector (
The precipitation strengthening contribution is described by the Ashby-Orowan´s equation (Gladman, 1999; Gutierrez & Altuna, 2008; Iza-Mendia & Gutierrez, 2013; Wang et al., 2006).
where
Eq. 1 and Eq. 2 were used to predict the yield strength of polycrystalline steels which resulted from a combination of the various strengthening contributions (Olivares et al., 2008), and as was presented, those equations posited a simple summation law. On the other hand, Koppenaal and Kuhlmann-Wilsdorf (1964), Majta et al. (1996) and Irvine (1976), employed a root mean square summation to determine the tensile property of yield strength. Carretero-Olalla et al. (2014) present the following equation:
In this sense, the present work (PW) reports the impact of the steel chemistry, coupled with the contribution of the strengthening mechanisms, which are activated by the applied hot rolling and cooling schedule, to the experimental yield strength of a developed pipeline steel grade, through quantification of the microstructural features, such as grain size, precipitation, and dislocation density; and to compare it with linearly and root square equations for the prediction of the yield strength property.
4. Results and discussions
Fig. 2a shows the microstructure obtained after hot rolling of the ingot (1250°C to 870 °C) and water cooling of the plate, from 870 °C to room temperature (and tempered at 500 °C, 20 min.), while Fig. 2b shows the microstructure of the plate hot rolled under the same experimental conditions but air-cooled.
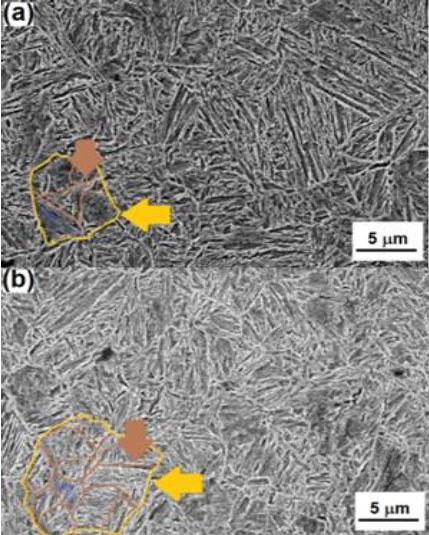
Figure 2 SEM micrographs showing microstructures of (a) HR+ WQ+ T, and (b) HR+AC. In both figures, the yellow contours are delineating packages of bainite, and the brown contours remark specimen’s grain size.
Both microstructures are composed of bainite packages, with carbides located at the limits of bainite packages and grains, and all along the bainite phase. Grain size measurements performed on the obtained microstructures (HR+ WQ+ T and HR+AC) showed that the average packet size of the HR+ WQ+ T specimen has a value of 7.12 ± 1.22 μm with an average grain size value of 3.21 ± 0.24 μm (3.21×10⁻³ mm), while the HR+AC specimen showed an average packet size 9.37 ± 1.02 μm and average grain size of 4.23 ± 0.41μm (4.23×10⁻³ mm) as shown in Fig. 3.
The resulting mechanical properties for the studied conditions presented in Table 2 and named as HR+WQ+T and HR+AC are as follows: 0.2% YS = 975.5 ± 9.7 MPa, UTS = 1047 ±10.9 MPa, ε = 35.5 ± 1.1 %, and 0.2% YS = 875.5 ± 15.2 MPa, UTS = 914.7 ± 49.0 MPa, ε = 31.5 ± 0.5 %, respectively. The results of packet size, grain size, and mechanical properties are reported as average values and the standard deviation is considered. One-way ANOVA (Minitab 19, USA) was applied to determine significant differences in groups. p < 0.005 was accepted as statistically significant.
Table 2 Mechanical properties of the studied conditions: HR+WQ+T, and HR+AC.
| Condition |
(°C/s) |
0.2 % YS (MPa) |
UTS (MPa) |
ε (%) |
Grain Size (mm) |
|---|---|---|---|---|---|
| HR+WQ+T | 1.7 | 975.5 ± 9.7 | 1047 ± 10.9 | 31.5 ± 1.1 | 3.21 ± 0.24 |
| HR+AC | 90 | 875.5 ± 15.2 | 914.7 ± 49.0 | 35.5 ± 0.5 | 4.23 ± 0.41 |
From the chemical analysis of the steel under study (shown in Table 1),
The bainite microstructure obtained as a result of the two studied conditions,
HR+QW+T and HR+AC, showed
On the other hand, dislocation hardening contribution to the yield strength value was
estimated, according to the classical relation with statistical store dislocation
density,
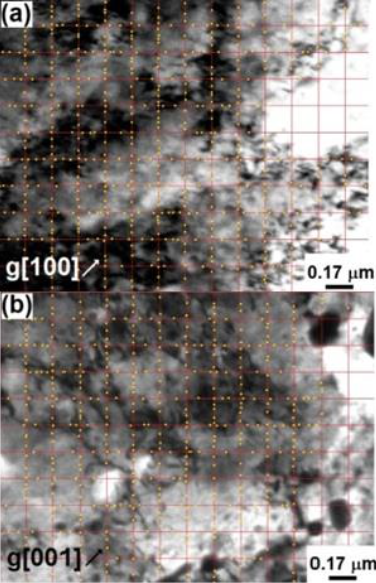
Figure 5 Bright-field TEM micrographs of the studied conditions: (a) HR+WQ+T, and (b) HR+AC, respectively. Interception points between the net and dislocations are highlighted.
An assumption was considered for practical purposes, consisting in fixing all the dislocation segments with random orientations, concerning the plane of the film. Thus, the dislocation density is calculated according to (Ham, 1961):
Where, t, is the thickness of the foil, and
Regarding foil thickness measurements, it was reported (Carretero-Olalla et al., 2014) a thickness of
1.8×10⁻⁷ m for Fe-0.06C-1.6Mn steel, thermomechanically treated from
1250 °C to 800 °C, followed by water cooling
Table 3 Foil thickness, dislocation density and
| Condition | Area (m2) |
N | L (m) |
t (m) |
ρ |
(MPa) |
|---|---|---|---|---|---|---|
| HR+WQ+T | 4.3×10⁻¹² | 1250 | 4.98×10⁻⁵ | 1.82×10⁻⁷ | 2.75×10¹⁴ | 302.48 |
| HR+AC | 4.3×10⁻¹² | 944 | 4.98×10⁻⁵ | 1.65×10⁻⁷ | 2.29×10¹⁴ | 276.07 |
The calculated contribution to the value of yield strength by dislocation hardening
is 302.48 MPa and 267.07 MPa for the HR+WQ+T and HR+AC conditions, respectively. In
this matter, Takebayashi et al. (2010)
pointed out that investigating the mechanical properties of Fe-C steels, dislocation
density, is one of the critical key factors that need to be evaluated. For instance,
Kehoe and Kelly (1970), and Morito et al. (2003) showed that the
dislocation density increases with carbon content in Fe-0.01 to 0.61 wt. % C steels
with ferrite or martensite microstructures, as is shown in Fig. 6, where the contribution to
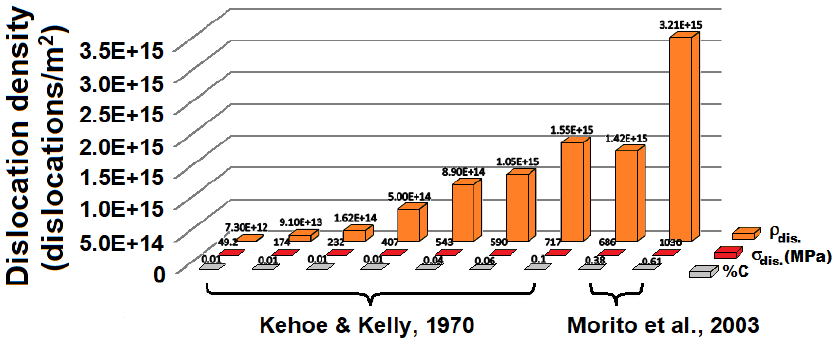
Figure 6 Contribution of dislocation density,
In addition, Fig. 7 shows the effect of
thermomechanical processing and cooling conditions (Carretero-Olalla et al., 2014; Misra et
al., 2005; Olivares et al., 2008;
Sarkar & Jha, 2011; Takebayashi et al., 2010; Tan et al., 2014; Wang et al.,
2006), on the value of
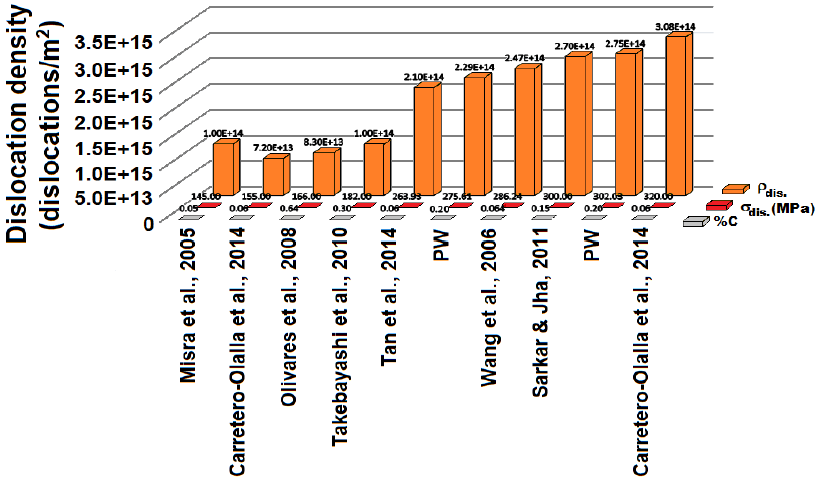
Figure 7 Contribution of dislocation density,
For this work,
In this sense, the increase of the yield strength value is also influenced by
particle precipitation (carbide precipitation). Due to particles can hinder the
dislocation motion increasing the yield strength, for instance, Fig. 8 shows the distribution of particle size at grain
boundaries and matrix in the HR+WQ+T and HR+AC microstructures. In these
micrographs, it was found a contribution to
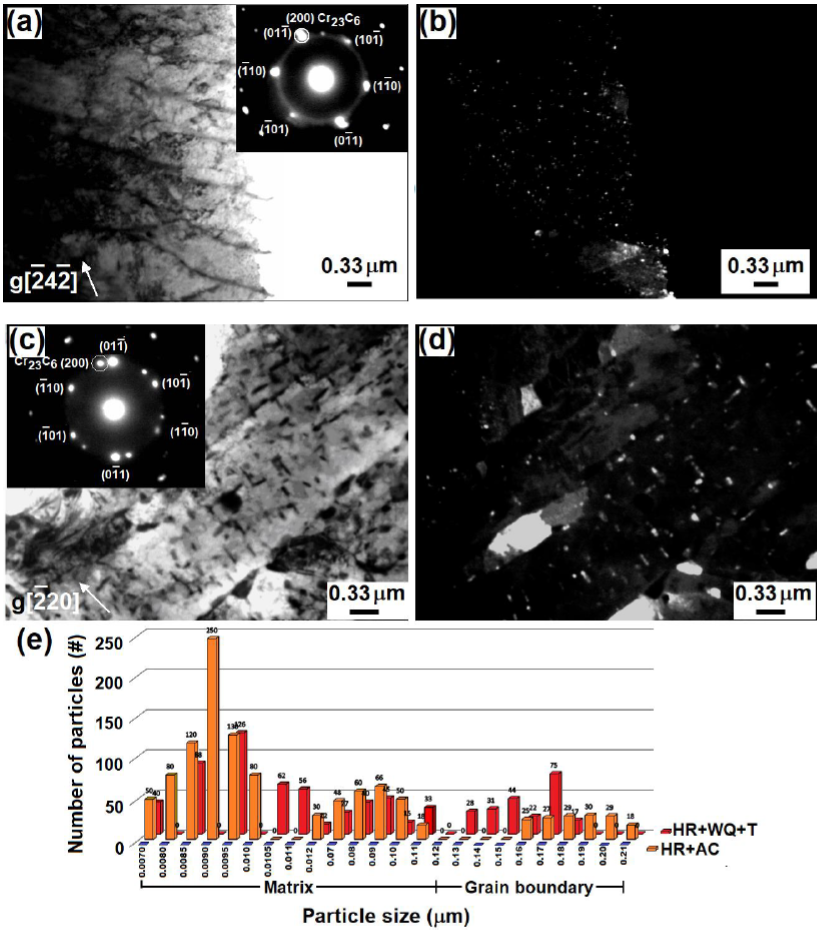
Figure 8 (a, c) TEM micrographs of the studied conditions: HR+WQ+T and HR+AC, respectively, with their corresponding electron diffraction patterns (insets); (b, d), darkfield images from selecta diffraction area where quantification of precipitates was performed, (e) distribution of particles.
From the above results, Table 4 compares the experimental yield strength values, with predictions, for HR+WQ+T and HR+AC conditions, which were obtained, by using linearly and root square equations. It is noticeable that the contribution of short-range internal stresses produced by interstitial and substitutional elements in solid solution, grain size, dislocation hardening, and precipitation hardening was considered. Results showed that the linear equation possesses an error of up to 7.3 %, while the root square equation showed an error of up to 30 %.
Table 4 Experimental and predicted (Eq. 1 and Eq. 8) values for yield strength, ultimate tensile strength, YS/UTS, and elongation of steel under study.
As shown in Table 4, the mechanical properties obtained for this experimental steel positioned as a steel grade HSLA 120, which could have applications as high strength pipelines.
5. Conclusions
The experimental Fe-0.2%C-0.6%Mn-0.2%Mo-1.0%Cr steel was fabricated and processed
putting particular attention to the yield strength value, relevant for pipeline
design. According to the proposed hot-rolling schedule together with the imposed
cooling-rate allowed to obtain unique microstructures with yield strength values
which positioned it to an equivalent high-strength low-alloy (HSLA) steel of the
HSLA-120 type. Chemical composition percentages together with a quantification of
microstructural features were fed to equations to predict the contribution of
different strengthening mechanisms. For example, lattice-friction and short-range
internal stresses produced by interstitial and substitutional elements in solution,
grain size, dislocation hardening, and precipitation hardening. In this way, it was
possible to quantify a contribution of
Conflict of interest
The authors do not have any type of conflict of interest to declare.
Financing
This work was supported by DGAPA-UNAM PAPIIT IT100119.


 nueva página del texto (beta)


