1. Introduction
The detection of deformations and optical flaws in automotive glass is a crucial yet challenging step in the manufacturing process. During fabrication, the glass is heated up to 700°C to be shaped into different forms, a process that can create optical flaws and imaging deformations in the resulting product. The likelihood of creating these defects is proportional to the curvature and complexity of the glass form. Compared to regular planed glass, outwardly curved glass, such as those used in vehicle windscreens, rearview mirrors, and security mirrors, are much more likely to experience these defects during fabrication. Curved glass also typically exhibits a wider field of view, a higher degree of transmission, and a higher degree of reflectance.
Defects in automotive glass can be a significant hazard. Deformations in the windscreen will distort the driver’s perception of the shape and motion of nearby objects, potentially causing driver errors that endanger other road users. Since these imaging deformations do not have regular shapes or clear boundaries, they are often difficult to detect and measure, especially on outwardly curved automotive glass that exhibits high transmission and reflectance. This study aims to investigate the automated visual inspection of transmitted deformation flaws of curved vehicle glass.
A certain degree of transmitted deformation is inherent to vehicle glass due to the glass curvature, but manufacturing defects can exacerbate the problem. Figure 1 shows two transmitted deformation scenes through defective car glass. The transmitted shapes of objects in the images are significantly distorted, causing objects to appear irregular, out of focus, or blurry to the driver. These distortions may contribute to driver errors and lead to dangerous accidents.
Inspection of deformation flaws during fabrication has its own set of challenges. In the current automotive glass industry, the most common method for detecting deformation flaws relies on visual examination by human inspectors. Even with rigorous training and standardization, human inspection is prone to errors due to differences in each person’s visual perception and subjectivity, especially when their eyes are fatigued. Figure 2 shows a typical inspection task, including a windscreen sample, a windscreen support frame, and an inspector measuring transmitted deformations in the imaging area of a standard pattern, and evaluating the sample by hand with a gauge.

Figure 2 (a) A windscreen hanging on a support frame; (b) and (c) an inspector measuring transmitted deformations in the imaging area of a standard pattern through a windscreen by hand with a gauge.
A complement to direct human inspection is the use of computer-aided vision systems. These overlay a standard pattern on the glass samples and capture images on which deformation magnitudes can be measured with gauges. These systems also tend to be plagued with difficulties, especially during image acquisition. Deformation defects could often become enlarged, shrunken, or even completely hidden in images due to uneven lighting of the surroundings, extreme viewing angles, or a variety of other factors. Additionally, the high transmission and reflectance of the automotive glass often hinder the ability of current optical systems to precisely detect deformation on these samples. This study presents the design of an automated distortion flaw detection system for transparent glass and proposes a circular Hough transform (CHT) based approach to distinguish transmitted deformation flaws on curved automotive glass.
A complement to direct human inspection is the use of computer-aided vision systems. These overlay a standard pattern on the glass samples and capture images on which deformation magnitudes can be measured with gauges. These systems also tend to be plagued with difficulties, especially during image acquisition. Deformation defects could often become enlarged, shrunken, or even completely hidden in images due to uneven lighting of the surroundings, extreme viewing angles, or a variety of other factors. Additionally, the high transmission and reflectance of the automotive glass often hinder the ability of current optical systems to precisely detect deformation on these samples. This study presents the design of an automated distortion flaw detection system for transparent glass and proposes a circular Hough transform (CHT) based approach to distinguish transmitted deformation flaws on curved automotive glass.
CHT is an efficient tool for isolating features of a circular shape in an image. It converts a circular object detection task in the image domain into a simpler local peak detection task in the parameter domain (Hassanein et al., 2015; Mukhopadhyay & Chaudhuri, 2015). The CHT is unaffected by image noise and has superior capabilities for handling instances of fractionally distorted and noisy forms due to its voting procedure. Given these advantages, this research proposes the approach of applying the CHT voting scheme to find the peak points of the base dots in parameter space andreconstructing the base dots of the captured image to find the deformation flaws. This study examines the potential of the proposed method of machine vision to replace human labor in automotive glass inspection.
2. Literature reviews
Automatic optical inspection in quality evaluation has become an essential process for production as it ensures that product quality is assured and production efficiency is enhanced through strict inspection and evaluation of all products in the industrial processes (Chen et al., 2021; Czimmermann et al., 2020; Rasheed et al., 2020; Ren et al., 2021; Tulbure et al., 2022). The inspection systems established on image processing and machine learning technology have generated many appliances in the manufacturing industry, for example, examination of drill point defects in micro-drilling applications (Huang et al., 2008), surface defect inspection in electronic parts of the high-speed trains (Zhao et al., 2020), classification of steel exterior defects (Fu et al., 2019). Surface quality inspection based on optical technology satisfies the quick and precision needs of a fabrication line and has been widely utilized in various industrial areas (Chen et al., 2021; Czimmermann et al., 2020; Fu et al., 2019; Huang et al., 2008; Rasheed et al., 2020; Ren et al., 2021; Tulbure et al., 2022; Zhao et al., 2020).
To improve glass product qualities, many studies have been developing non-contact automatic inspection devices inspecting the shape and poor surface of a glass product with the latest image processing technologies and analyzing the characteristics of glass. These researches investigated the surface defect inspection of glass-related products, such as developing a defect tracking system for optical thin film products in the smart-display-device industry (Jeon et al., 2020), implementing an inspection system for surface defects of car bodies (Zhou et al., 2019), designing an inspection structure for auto glass using fringe patterns (Xu et al., 2010), proposing a multi-crisscross filtering method established on Fourier domain to inspect surface defects of capacitive touch panels (Lin & Tsai, 2013), applying the Hotelling’s T2 statistic and grey clustering methods to cosine transform for detection of visible defects in appearances of LED lenses (Lin & Chiu, 2012), designing a visual inspection system for non-spherical lens modules of semiconductor sensors (Kuo et al., 2017). These optical inspection systems focus on surface flaw detection on glass-related products.
Image distortions because of perspective must be corrected to permit further image processing. Regarding the distortion detection and correction techniques, Mantel et al. (2020) proposed two methods for determining the perspective distortion on electroluminescence images of photovoltaic panels, and Cutolo et al. (2019) presented a method to calibrate transparent head-mounted panels by making the use of a calibrated camera. It is evident that most of the distortion-related works due to perspective concentrate on the distortion correction of optical lenses.
Transmitted deformation is the image degeneration of a visible object incurred by a transpicuous material. In inspection studies of transmitted deformation in industrial parts, Gerton et al. (2019) investigated deformation patterns of Ronchi grids mathematically for determining the effects of distortions in eyewear products. Youngquist et al. (2015) presented an explanation of optical deformation and permitted the use of a phase-shifting interferometer for determining the distortion of a large optical window. Dixon et al. (2011) developed a system using digital imaging and a classifier based on decision trees for quantifying optical deformation in aircraft transparencies. Lin and Hsieh (2018) applied small shift control charts to inspect distortion flaws on car mirrors. Currently, most optical inspection systems of clear glass products detect surface flaws, and the deformation flaws are not included. It is hard to accurately detect transmitted deformation flaws embedded on the surface of the curved glass of vehicles with higher transmission and reflection properties.
Hough transform (HT) is the majority regularly adopted method to identify distinct shapes in digital images. It was initially proposed by P.V.C. Hough (1962) and with the capabilities of detecting lines, circles, and other structures if their parametric equations are known. It is an effective way to improve image shape detection when the shape can be parameterized by a set of parameters in an equation (Duda & Hart, 1971). The major merit of the HT skill is that it has gap tolerance in feature border representations and is comparatively uninfluenced by image noise. This can be helpful when trying to find specific shapes with small interruptions in them due to image noise, or when searching for objects that are partly blocked (Hassanein et al., 2015; Mukhopadhyay & Chaudhuri, 2015). Circle detection is often a preceding work employed in distinct applications associated with image analyses in medicine, military, biometrics, security, robotics, etc. The CHT has been extensively successful in conforming to the real-time prerequisite of finding circles in noisy images (Al-karawi, 2014). The potential circles are determined through voting in the Hough domain and next choosing local maxima in the accumulators.
Related studies used CHT-based cycle detections and its derivatives in defect inspections, such as detecting the spot defects in welding applications (Ding et al., 2016; Liang et al., 2019), implementing human eye pupil detection (Nandhagopal et al., 2018), locating nuclei in cytological images of breast aspiration cytology samples (Pise & Longadge, 2014), presenting a sturdy method for intricate building segmentation from remote sensing images (Cui et al., 2012). Some works proposed hybrid approaches based on CHT for object detections and classifications, such as combining with the adaptive mean-shift technique to detect and track balls in object tracking systems (Bukhori et al., 2018), fusing with the skin ratio to detect occluded faces for a human tracking system (Charoenpong & Sanitthai, 2015). Additionally, advancements to the CHT method for circle detection were developed, for example, improving the voting process to detect multiple circles to avoid false positives (Barbosa & Vieira, 2019), modification on the use of the incremental feature for reducing the resources and the parallel feature for lowering the calculation time in a biometric iris identification device (Djekoune et al., 2017).
Most of the distortion-related works focus on the distortion correction of optical lenses. Many of the automated inspection systems of glass and mirrors detect surface defects and distortion flaws are not included. It is difficult to precisely detect reflected distortion flaws embedded on the surface of curved car mirrors with high reflection (Lin & Hsieh, 2018). Currently, there is little literature on the inspection of transmitted distortion flaws on transpicuous glass using an automated visual inspection system. This study implements a CHT-based vision system to inspect transmitted deformation flaws on automotive glass. The detection rate of correct identification of deformation flaws and the false alarm rate of misjudged deformation flaws are the main indicators to evaluate the performance of the developed vision system.
3. Proposed circular Hough transform-based approach
The common image processing techniques are to use the template-matching approach to identify circle shapes (Gonzalez & Woods, 2018). But this approach is very inexact due to image noise disturbance. This study proposes a vision-based system with a known standard pattern for image acquisition and applies a CHT voting scheme to inspect deformation flaws on curved automotive glass. Figure 3 illustrates three common standard patterns used in this study: lines pattern, checkers pattern, and dots pattern. To quantify the deformation level of curved vehicle glass, we first use the digital imaging of the standard pattern through a testing auto glass to create a transmitted deformation map of that glass. This deformation map is regarded as a testing image to be analyzed to find the existence of deformations and locations of the flaws. Second, the captured image is pre-processed by the histogram equalization approach (Gonzalez & Woods, 2018), Canny edge detector (Canny, 1986), and Otsu method (Otsu, 1979) to do image enhancement, edge detection, and segmentation sequentially to obtain a binary edge image. Third, the binary edge image is transformed to the CHT parameter domain to obtain the coordinates of the correct axis positions of the multiple base elements. Fourth, by applying the accumulator’s voting scheme to find the peak points of the base elements in the CHT accumulator space, an image with new base elements is reconstructed from the selected peak points. Fifth, the binary testing image is subtracted from the binary reconstructed image to obtain a binary difference image displaying the detected deformation flaws. Figure 4 shows the workflow of the stages of the proposed approach.
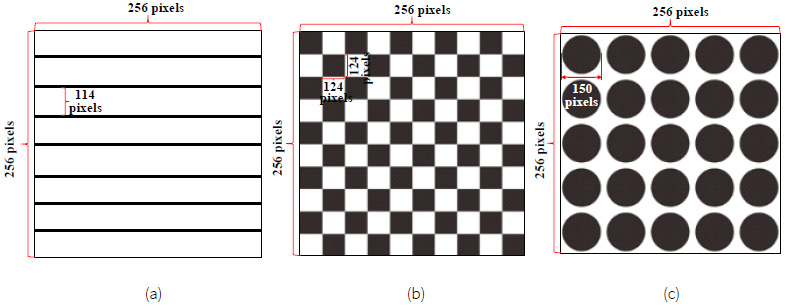
Figure 3 Three common standard patterns used in this study: (a) lines pattern; (b) checkers pattern; (c) dots pattern.
3.1. Image acquisition
In this study, testing samples with a length of 25.4 cm, a width of 20.4 cm, and a thickness of 0.2 cm are randomly selected from the fabrication line of an automotive glass manufacturer. To acquire images with digital imaging of a standard pattern through a testing sample for creating a transmitted deformation map of the sample, this study proposes an image capture system with a dots pattern for image acquisition shown in Figure 5. Figure 5 illustrates the setup of image capturing devices and the diagrammatic drawings (the front, top and side views) from the camera angle and the apparatus arrangement of image acquisition for capturing a testing glass. The testing sample is inserted in a custom-made fixture vertically and is in front of the standard pattern. The testing sample is partitioned into 4 regions for individual image acquisitions. The standard pattern with base dots is attached to a wall. A camera with a stand is used to take images from the view transmitted on the dots pattern through the testing glass. To acquire the digital imaging of a standard pattern with proper intensity, the lighting control of the environment is also important when acquiring images.
3.2. Image pre-processing
For capturing better image resolution and representation of flaw evaluation, a trial specimen is partitioned into 4 parts for image acquisition. The captured image is preprocessed in several steps to increase the clearness of object appearances on transpicuous glass. Figures 6(a) and 6(b) show the originally captured image and enhanced image using the dots pattern performed in the histogram equalization approach (Gonzalez & Woods, 2018) for increasing contrast in gray levels. From the analysis of the intensity histogram, the contrasts of gray levels have been increased and the dots pattern looked clearer in the enhanced image. To quantify the deformation level of the pattern image, Figures 6(c) and 6(d) depict the binary edge images of the defective areas and normal regions that the Canny edge detector (Canny, 1986) and Otsu method (Otsu, 1979) are applied to do edge detection and segmentation sequentially while using the dots pattern. Most of the base dots are segmented from the background in the binary images by the two methods. The results disclose that the slight deformation faults in transpicuous glass surfaces are rightly divided in the binary images, irrespective of insignificant deformation differences.
3.3. Reconstruction of the base-dot image by circular Hough transform voting scheme
The algorithm of HT can discover incomplete examples of objects inside some categories of shapes through a voting procedure. The motive of the HT is to fulfill the clustering of boundary points into object potentials by conducting a clear voting process upon a group of parameterized image objects (Hassanein et al., 2015; Mukhopadhyay & Chaudhuri, 2015).
3.3.1. Circular Hough transform
The potential circles can be determined by the CHT voting procedure in the Hough parameter domain. The edge image obtained from the Canny algorithm is the input to identify the circles employing the CHT approach. The parameter domain is explained by the parametric denotation employed to depict circles in the spatial domain. An accumulator is an array employed to discover the presence of the circle in the parameter domain. The dimensionality of the accumulator is equivalent to the amount of not known parameters in a circle. The formula of the circle in mathematical format is expressed as:
where (x, y) are the coordinates of a point on the circle, and (a, b) is the circle center with the radius r. This parameter domain is a three-dimensional matrix with 3 variables, (a, b, r). In the 3-D domain, the circle parameters are recognized by the cross of numerous conic surfaces determined by points on the 2-D circle. Every point (x, y) on the image circle defines a circle centered at (x, y) with a radius r in the parameter domain. The crossing point of whole these circles in the Hough domain is connected to the center point of the image circle.
Figure 7 shows conceptual diagrams of the CHT. In Figure 7(a), each edge point in the spatial domain determines a set of circles in the 2D-CHT parameter space (Duda & Hart, 1972). These circles are determined by all radius values and are centered on the coordinates of the edge point. Figure 7(b) shows three circles determined by three edge points marked 1, 2, and 3 for a given radius value. Each edge point can also determine the circles for other radius values. These edge points map to a voting cone in the 3D-CHT accumulator space, as shown in Figure 7(c) (Prajwal Shetty, 2011).
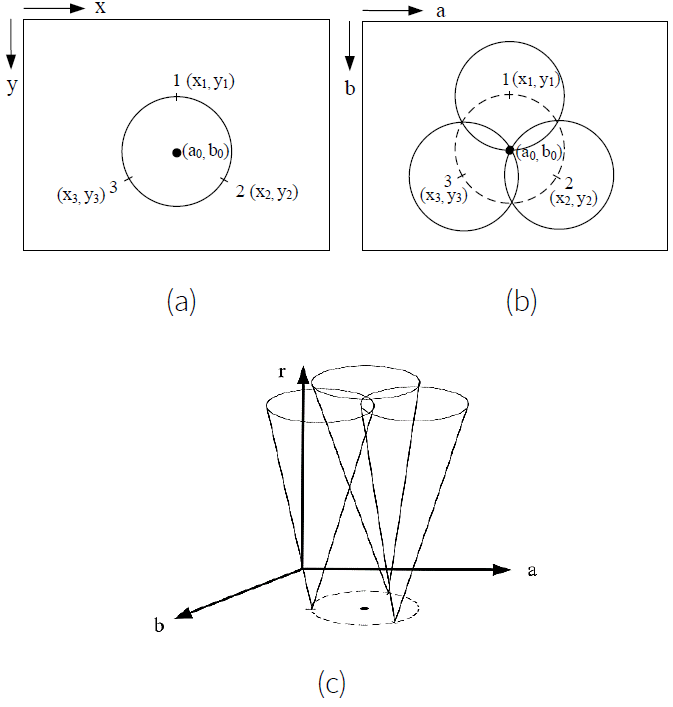
Figure 7 Conceptual diagrams of the CHT: (a) a circle in the spatial domain, (b) 2D-CHT parameter representation, and (c) 3D-CHT accumulator space.
Those circles are determined by the entire feasible values of the radius as well as they are centralized on the coordinates of the boundary point. The HT must pass through (a, b, r) three parameters to depict every circle. If an image has a known radius or a radius scope, it will be decreased from 3-D to 2-D and the pass-through rate is quicker. The goal converts to discovering the coordinates (a, b) of the cycle centers. The input to a CHT is normally a binary image that has been segmented. Figure 8 shows the corresponding Hough parameter domains in 3-D and 2-D perspectives of the defective regions from the binary edge images. We cannot find any difference between the normal and defective images in these Hough parameter domains.
3.3.2. Accumulators and voting procedure in circular Hough domain
The accumulator array is employed for following the crossing point in the parameter domain. The component in the accumulator array indicates the number of circles in the Hough domain that traverse the connecting bin in the accumulator space. For every boundary point in the spatial domain, we create a circle in the Hough domain and grow the voting amount of the bin that the circle traverses. After the voting procedure, we can discover the local maxima in the parameter space. The locations of the local maxima are connected to the circle centers in the spatial domain.
The local maxima of the accumulators will give significant circles. Figure 9 shows the conceptual relationship diagram between the binary edge image in spatial space and the corresponding detected cycles in the Hough parameter domain. It indicates that the standard pattern with 5x5 dots is displayed on its binary edge image of a testing sample and there are 5x5 corresponding intersection points of circles in the circular Hough domain. The CHT is to pass through the entire boundary points of the original space, and every point is associated with a circle in the Hough domain. Next, calculate the amount of crossing of entire circles, then the largest number of points is the circle center.
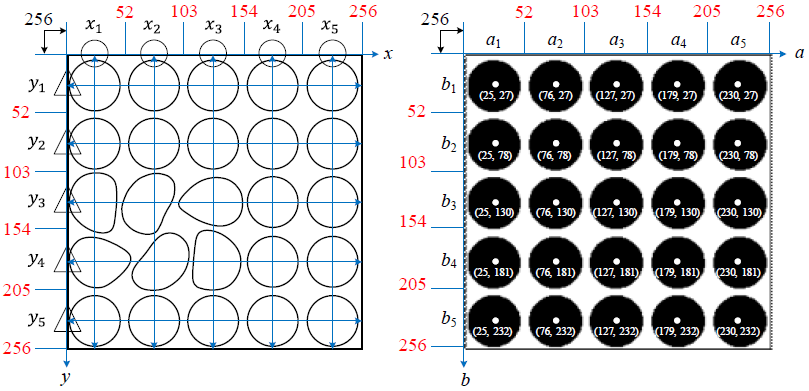
Figure 9 The conceptual relationship diagram between the binary edge image in spaial space and the corresponding detected cycles in the Hough parameter domain.
By discovering the bins having the largest values, usually by seeking local maxima in the accumulator’s domain, the highly probable circles could be found. The straightforward means of discovering these peaks is via employing a certain type of threshold. In addition, owing to unideal variations in the edge detection stage, there are regular variations in the accumulator domain, which might cause it complicated to find suitable peaks, and hence adequate circles.
3.3.3. Reconstructed base element images and binary difference images
After the positions of all peaks are in parameter space, we need to transform them back to the spatial domain for obtaining a base-dot image. The peaks in the parameter domain transformed back to the spatial domain are the base dots in the reconstructed image. Similarly, the horizontal and vertical line segments follow the line voting procedures in the Hough domain and take inverse transform to obtain the horizontal and vertical baselines in the reconstructed image. Figure 10 shows the reconstructed images from the Hough domain for the checkers pattern and dots pattern images. The width of the vertical and horizontal baselines for the checkers pattern is 1 pixel in Fig. 8(a) and the radius of circles for the dots pattern is 23 pixels in Fig. 8(b). These grids of the base-line image for the checkers pattern need to be further filled to become black and white checkers shown in Fig. 8(a). These reconstructed images will be the binary base element images for comparison with those of the testing images to locate deformation flaws.
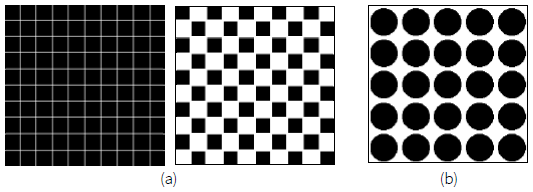
Figure 10 The reconstructed base element images from the Hough domains using (a) checkers pattern, and (b) dots pattern.
If the binary testing image and the reconstructed base element image are precisely aligned, the deformation flaws can be identified and located through image subtraction. The binary testing image subtracts the binary reconstructed image to obtain a binary difference image indicating the locations of detected deformation flaws. Figure 11 shows the resulting binary difference images for the checkers pattern and dots pattern images.
4. Implementation and analyses
To assess the performance of the suggested approach with three common standard patterns, assessments are performed on 120 real vehicle glass products (40 faultless samples without any flaws and 80 faulty samples with various transmitted deformation flaws) to evaluate the capability of the recommended technique. Every captured image including a quarter of a vehicle glass is 256 × 256 pixels and each pixel has 8 bits. The developed deformation flaw inspection arithmetic is compiled in the MATLAB platform and carried out on version 7.9 of MATLAB interactive environment on a computer (INTEL CORE i7-6500U 2.5GHz 4GB RAM).
To numerically verify the capability of the deformation flaw inspection methods, we differentiate the results of our assessments from those provided by the empirical evaluators (ground truth). The locations and ranges of deformation flaws are marked by the experienced quality inspectors from the testing images as the standards for evaluating the performance of the inspection methods. The detected deformations in an image are expressed as the total pixel number of the detected deformation areas in the image. The deformation detection rate in an image is the percentage of the detected true deformation areas over the total true deformation areas in the image. Two measures, (1-α) and (1-β), are employed to indicate suitable detection appraisals; the greater the two measures, the more accurate the detection consequences. False alarm error α, considering regular regions as deformation flaws, divides the districts of regular regions inspected as deformation flaws by the districts of true regular regions to acquire the error. Missing alarm error β, defeating to alert true deformation flaws, divides the districts of undetected true deformation flaws by the districts of overall true deformation flaws to gain the error. To evaluate the result on a testing image, these two errors can be expressed as follows,
Because the inspection process and interfering factors of deformation flaws are more difficult and more numerous than the inspection of regular surface defects, the performance of the deformation flaw detection system will be lower. In practical applications in the automotive glass industry, deformation detection rates (1-β) above 80% and false alarm rates (α) below 5% are good rules of thumb for performance evaluation of deformation inspection vision systems.
4.1. Detection results of using the dots pattern with various dot radiuses
The pixel size of dot radius in the reconstructed base-dots image also will affect the detection performance of deformation flaws by the proposed method. If a suitable pixel size of dot radius is selected in the reconstructed base-dots image, the smaller deformation flaws will be more completely recognized. We examine the dots patterns with 22, 23, and 24-pixel radiuses of dots in the reconstructed base-dots images by the proposed method. Figures 12 and 13 show the captured, processed, and resulting images for the normal and defective samples by the proposed method using the dots patterns with the three types of pixel radiuses, respectively. We find that the smaller and larger pixel radiuses are more sensitive to the detection of deformation flaws and cause more fake alert errors. Table 1 indicates the detection results using the 23-pixel radius for the dots pattern are suitable and have better deformation inspection performance because of the higher detection rate and lower false alarm rate.
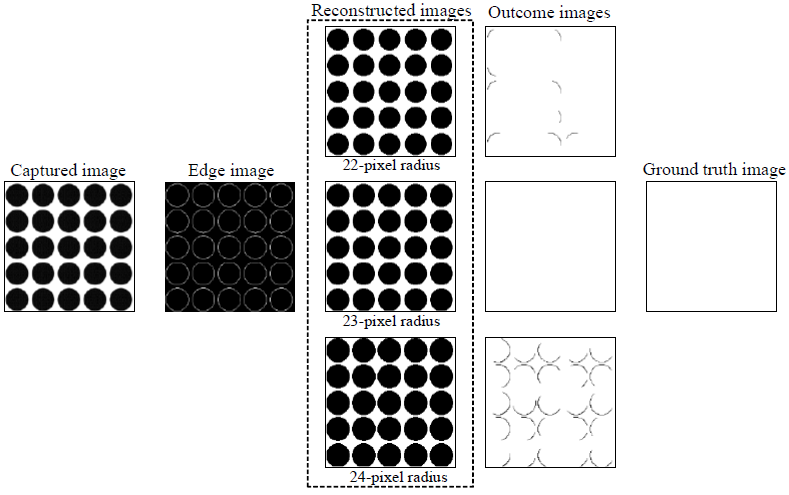
Figure 12 A normal captured image with the processed images of transmitted deformation inspection by the proposed method for producing reconstructed base-dots images with various dot radiuses.
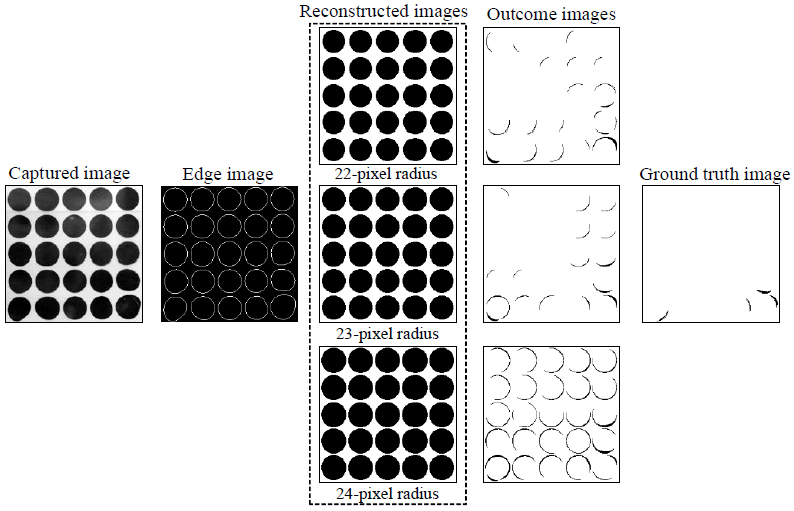
Figure 13 A defective captured image with the processed images of transmitted deformation inspection by the proposed method for producing reconstructed base-dots images with various dot radiuses.
Table 1 Performance indices of transmitted deformation inspection by the proposed method for producing reconstructed base-dot images with various dot radiuses.
| Indicators | 22-pixel radius | 23-pixel radius | 24-pixel radius |
| False alarm rate (α) | 1.72 % | 0.95 % | 4.31% |
| Detection rate (1-β) | 60.81 % | 67.580% | 67.635% |
4.2. Deformation detection results of the proposed method using different standard patterns
Three common standard patterns are used to detect deformation by the proposed approach for differentiating outcomes of deformation flaw inspection. To reveal the deformation inspection effects of originally captured images, Figure 14 illustrates partial results of inspecting deformation flaws by the proposed approach using the lines pattern, checkers pattern, and dots pattern, and the ground truth supplied by empirical evaluators, separately. The method using the lines pattern produces some incorrect discernments in missing alarms and the method using the checkers pattern causes several incorrect discernments in false alarms on deformation flaw inspection. The proposed method using the dots pattern inspects most of the deformation flaws and produces fewer incorrect discernments. Consequently, the proposed method with dots pattern is superior to the methods using lines pattern and checkers pattern in the deformation flaw inspection of transpicuous glass images.
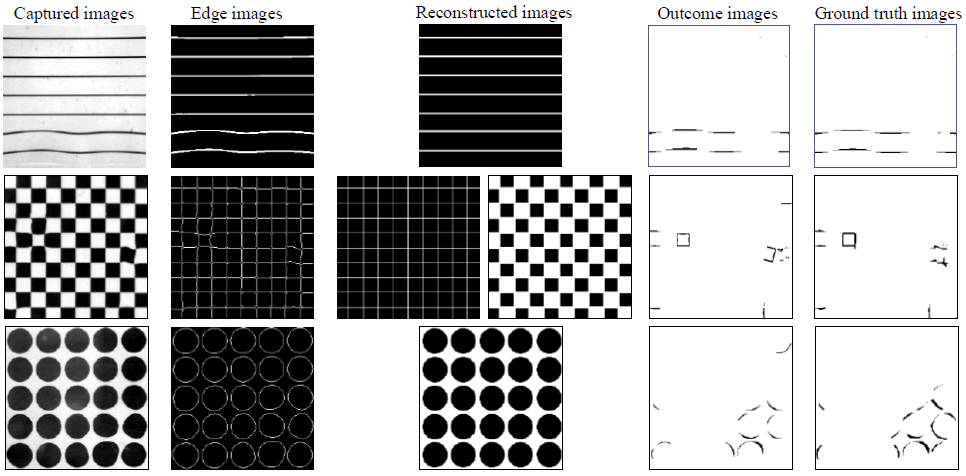
Figure 14 Partial results of transmitted deformation inspection by the proposed method using three common standard patterns.
Table 2 indicates the differentiating outcomes of deformation flaw inspection effects in the conducted experiments. The suggested methods individually using three common standard patterns are appraised contrary to the results by empirical evaluators. The mean deformation detection rates (1-β) of entire sample trials by using the three standard patterns are, 66.86% by using the lines pattern, 76.25% by using the checkers pattern, and 82.76% by using the dots pattern. Nevertheless, the proposed method with a checkers pattern has a remarkably greater false alarm rate, 2.628%, and the scheme with a dots pattern has a smaller false alarm rate 1.144%. More specifically, the suggested method with dots pattern has a greater deformation detection rate and possesses a smaller false alarm rate employed to transmitted deformation inspection of transpicuous glass images. The mean processing times for dealing with a captured image having 256 x 256 pixels are as follows, 0.092 seconds by using the lines pattern, 0.525 seconds by using the checkers pattern, and 0.846 seconds by using the dots pattern.
Table 2 Performance indices of transmitted deformation inspection by the proposed method using three common standard patterns.
| Standard patterns | Detection rate (1-β) | False alarm rate (α) | Processing time (Sec.) |
|---|---|---|---|
| Lines pattern | 66.86 % | 0.574 % | 0.0916 |
| Checkers pattern | 76.25 % | 2.628 % | 0.5247 |
| Dots pattern | 82.76 % | 1.144 % | 0.5663 |
The average conducting time of the recommended method with checkers pattern is the same as that of the method with dots pattern. The suggested approach using the dots pattern overcomes the difficulties of inspecting deformation flaws on transpicuous glass images with transmitted and reflected exteriors as well as excels in its capability of accurately discerning deformation flaws from regular regions.
5. Concluding remarks
This study proposes a potential substitute for human inspectors in the production of automotive glass by developing a frequency reconstruction technique established on CHT to examine deformation flaws. The study recommends a base dot reconstruction approach by CHT voting scheme to detect deformation flaws on high transmitted images of automotive glass samples. By self-contrasting the binary testing image and the binary reconstructed image from the CHT voting scheme, the proposed method eliminated the need for precise positioning of testing glass products or any templates for pattern accordance check. Experimental outcomes suggest that the proposed method achieves a high 82.76% probability of accurately discriminating deformation flaws and a low 1.14% probability of incorrectly identifying regular regions as deformation flaws on transmitted images of automotive glass. The proposed method is a promising tool for glass inspection, with potential for further refinement and applications in future studies.
Conflict of interest
The authors do not have any type of conflict of interest to declare.
Funding
This research project is funded by the Ministry of Science and Technology of Taiwan under funding number: MOST 104-2221-E-324-010, many thanks from the authors.


 nueva página del texto (beta)


