


 nueva página del texto (beta)
 Inglés (pdf)
 Artículo en XML
 Referencias del artículo
 Enviar artículo por email
 Citado por SciELO
  Similares en
SciELO
Similares en
SciELO 
 Permalink
1. Introduction
Environmental and economic concerns are stimulating research in the development of eco-friendly composites for several engineering applications. In this regard, researchers put their attention towards the utilization of low-cost lignocellulosic fibers, such as bamboo, jute, sisal, PALF, coir, ramie, etc. as reinforcements in petroleum-based thermoplastics. Owing to their exceptional features such as lightweight, renewability, biodegradability, easy availability, high specific strength & stiffness, good acoustic, thermal, and electrical insulation make them as promising candidates compared to inorganic fibers (Ali et al., 2017; Ali et al., 2018; Basu et al., 2017; Bodirlau et al., 2013; Holt et al., 2014; Khalil et al., 2007; Latif et al., 2015; Li et al., 2016; Qaiss et al., 2014; Salasinska et al., 2016; Shi et al., 2013).
Among all the natural cellulosic fibers, the PALF has significant potential to be used as a reinforcing agent in fiber or powder form. This is because of the presence of high cellulose content (70-85%), low-density, and low microfibrillar angle. Moreover, PALF is a waste product of pineapple cultivation and therefore relatively inexpensive which can be employed for industrial purposes (Arib et al., 2004; Mishra et al., 2001; Pavithran et al., 1987). The fibers derived from pineapple leaves have excellent characteristics for use in automotive, building & construction, packaging, and general engineering applications. According to the statistical database (2017) of ‘Food and Agricultural Organization’, the total production of pineapple fruit in the entire world is 25.8 million tons (FAOSTAT, 2017).
Studies showed that the PALF could be used effectively for polypropylene (PP), polyethylene (PE), thermoplastic starch, and rubber reinforcement (Kengkhetkit & Amornsakchai, 2012). In addition, its carbon footprint is much lower than that of other cultivated natural and synthetic fibers (Kengkhetkit & Amornsakchai, 2014). Although cellulosic fibers have number of advantageous features, they exhibit some problems such as hydrophilic nature, limited thermal stability, and poor dispersion characteristics within the non-polar thermoplastic matrix (Bledzki et al., 1998; Cantero et al., 2003; Kazayawoko et al., 1999; Raj et al.,1989). These limitations can be remedied by several methods like grafting functional moieties onto the fibers, introduction of coupling agents, or pre- treatment of fibers with suitable agents. There have been numerous studies conducted for improving the interfacial adhesion between natural fibers and the matrix.
Table 1 reported that the chemical treatment has profound influence on the mechanical properties of fiber-reinforced composites (FRCs). It was observed that the use of a coupling agent containing maleic anhydride, polyethylene-grafted-maleic anhydride (MAPE) has not been addressed significantly. Therefore, in the present communication, the effect of maleic anhydride coupling agent on mechanical properties of PALF/HDPE/MAPE biocomposite was investigated. A review of the existing literature (Table 2) revealed that the fiber length and loading are the other critical parameters that can affect the thermo-mechanical properties of biocomposites. It was observed from literature review that most of the work includes one parameter effect at a time while keeping other at a fixed level. The interaction effect of various parameters has not been discussed so far. Therefore, to solve this problem, the design of experiment (DOE) method was used (Ashenai Ghasemi et al., 2016; Mhalla et al., 2017; Rostamiyan et al., 2014; Rostamiyan, Fereidoon, Mashhadzadeh et al., 2015; Rostamiyan, Fereidoon, Rezaeiashtiyani et al., 2015; Rostamiyan, Fereidoon, Nakhaei et al., 2017; Subasinghe et al., 2016; Ghasemi et al., 2016).
Table 1 Previous research work on chemical treatment of fibers.
| Authors | Chemical treatment of fibers | Results |
| (Siddique et al., 1984) | Grafting of jute fiber with vinyl polymer. | The moisture affinity of treated composite was less than the untreated one. |
| (Mwaikambo & Ansell, 2002) | Effect of alkaline treatment on properties of hemp, sisal, jute, and kapok fibers. | The thermal stability and mechanical properties of cellulosic fibers were improved after alkaline treatment. |
| (Jandas et al., 2011) | Effect of alkalization and silane treatments on thermo-mechanical properties of banana fiber (BF). | Increase of tensile strength to 136%, and impact strength to 49%. Thermal stability of BF treated biocomposites also increased. |
| (John et al., 2008) | Effect of alkaline modification on the mechanical properties of Sisal/OPEFB hybrid composite. | The 4% NaOH treated composite exhibits maximum tensile strength and torque value. |
| (Tripathy et al., 2000) | Effect of cyanoethylation on moisture absorption behavior of jute fiber. | The treated jute fiber exhibits better hydrophobicity than the untreated one. |
| (Dash et al., 2000) | Effect of alkaline treatment on interfacial wettability in Jute/Polyester composite. | The Resin pick-up or wettability of jute fiber was significantly improved after alkaline chemical treatment. |
| (Fung et al., 2003; Fung et al., 2002; Joseph et al., 1996; Mohanty, Verma et al., 2004; Xie et al., 2002) | Effect of compatibilizer on the interfacial bonding strength in sisal fiber reinforced polyolefin composites. | The Interfacial adhesion between sisal fiber and polyolefin matrix was improved after compatibilization. |
| (Mathew et al., 2004) | Effect of several chemical treatments such as mercerization, acetylation, benzoylation, and silanation on the mechanical properties of isora fiber/natural rubber composites. | The mechanical properties of biocomposites were significantly improved after chemical treatments. |
| (Venkateshappa et al., 2012) | Effect of alkaline treatment on mechanical properties of areca/epoxy biocomposites. | The tensile, flexural, and compressive strengths of Areca/Epoxy composites were improved after the alkali treatment. |
| (García-Hernández et al., 2004) | Effect of chemical treatments on interfacial bonding strength in bagasse/polyester composites. | The interfacial adhesion and shear strength (IFSS) of bagasse/polyester composites were improved after chemical treatments. |
| (Maheswari et al., 2013) | Effect of alkali and alkali-silane treatments of tamarind fiber on the mechanical properties of tamarind/polyester composites. | The tensile and flexural strengths of alkali-silane treated composites were higher than the untreated and other treated ones. |
| (Wong et al., 2004) | Treatment of flex fiber with 4,4’-thiodiphenol (TDP) | SEM revealed good adhesion between flax fiber and poly (3-hydroxybutyrate) matrix after treatment |
| (Anand & Anbumalar, 2014) | Effect of alkaline treatment on mechanical properties of hemp/epoxy composites. | The alkali-treated composite has better mechanical properties than the untreated one. |
| (Maffezzoli et al., 2004) | Treatment of hemp, ramie, flax, and jute fabrics with silane coupling agent | The void content decreased in composites containing chemically treated fibers. |
| (Oushabi et al., 2017) | Effect of alkali treatment on thermos-mechanical properties of date palm fiber (DPF)/polyurethane composites. | The tensile strength, thermal stability, and interfacial shear strength (IFSS) of DPF reinforced polyurethane composites were increased after alkalization. |
| (Ismail et al., 2002) | Effect of silane-coupling agent on the mechanical properties of bamboo fiber/natural rubber composites. | The mechanical properties were improved due to better fiber-matrix interfacial adhesion. |
| (Mohanty, Nayak et al., 2004) | Effect of compatibilizer on flexural strength of jute fiber/PP composites. | Treated composite exhibits 72.3% higher flexural strength than the untreated Jute/PP composite. |
| (Mishra et al., 2000) | Effect of compatibilizer on mechanical properties of natural fiber reinforced composites. | The tensile modulus, flexural modulus, impact strength, and hardness were improved after maleic anhydride compatibilization. |
Table 2 Literature studies on the effect of fiber length and content on properties of biocomposites.
| Authors | Factors explored by researchers | Results |
| (Devi et al., 1997) | Effect of PALF length and content on the mechanical properties of PALF/Polyester composites. | The optimum mechanical properties are achieved at 30 mm fiber length and 30% fiber content. |
| (Venkateshwaran et al., 2011) | Effect of sisal fiber addition on the mechanical properties of banana fiber composites. | The mechanical properties of banana fiber composites were increased with the addition of sisal fiber up to 50%. |
| (Idicula et al., 2005) | Effect of fiber length and content on the mechanical properties of banana/polyester composites. | The composite consists of 40% fiber loading with fiber length of 30-40 mm exhibits better mechanical properties than the other. |
| (Dabade et al., 2006) | Effect of fiber length and weight ratio on tensile properties of Sun hemp and palmyra/polyester composites | The optimum fiber length and weight ratio was 30 mm and around 55% respectively. |
| (Liu et al., 2007) | Influence of fiber length and content on thermal and mechanical properties of kenaf-reinforced soy plastic biocomposites. | The modulus, impact strength, and heat deflection temperature of biocomposites were increased with increase of fiber length and content of kenaf fiber. |
| (Das & Biswas, 2016) | Effect of fiber length and content on the mechanical properties of coir/epoxy composites. | The optimum fiber length and content are 12 mm and 15 wt.% respectively. |
| (Mittal & Chaudhary, 2018) | Effect of fiber content on thermal behavior of coir-epoxy composites. | The peak decomposition temperature of epoxy thermoset was increased from 371.96oC to 386.03oC after 23 vol.% loading of coir fiber. |
| (Chen et al., 2006) | Effect of wood particle size on mechanical properties of wood/HDPE composites. | The plastic composites made of coarse wood particles had higher strength than the fine particles composites. |
| (Alvarez et al., 2004) | Effect of sisal fiber loading on the creep properties of starch composites. | The creep resistance of starch matrix was significant improved after loading of sisal fibers. |
| (Park & Balatinecz, 1998) | Effect of wood-fiber content on creep property of wood/PP composites. | The creep resistance of polypropylene matrix was improved with the increase of wood-fiber content. |
| (El-Shekeil et al., 2012) | Effect of kenaf fiber content on tensile properties of Kenaf/PU composites. | The composite of 30% kenaf fiber yields maximum tensile strength. |
| (Nakagaito & Yano, 2008) | Effect of fiber loading on tensile modulus of phenolic resin/micro fibrillated cellulose composites. | The tensile modulus was increased linearly up to 40 wt.% fiber content. |
| (Özturk, 2010) | Effect of fiber loading on mechanical properties of kenaf/phenol-formaldehyde (PF) and Fiberfrax/PF composites. | The tensile and flexural strength was increased with increase of kenaf and Fiberfrax content up to 43% and 36 vol.% respectively. |
| (Kalapakdee & Amornsakchai, 2014) | Effect of PALF content on mechanical properties of PALF strengthened elastomer composites. | The modulus and tear strength were increased significantly with increase of PALF content. |
| (El-Shekeil et al., 2014) | Influence of fiber content on the mechanical properties of kenaf fiber reinforced PVC/PU blend composites. | The composite exhibits lower tensile strength, higher tensile modulus, and higher impact strength with the increase of fiber content. |
| (Leblanc et al., 2007) | Effect of green coconut fiber (GCF) content on the mechanical properties of GCF/PVC composites | The impact strength and hardness were not significantly influenced with the addition of GCF up to 30%. |
Several optimization techniques such as RSM, Taguchi method, full factorial, fractional factorial, ANN, fuzzy logic, and GA are available which have significant potential to optimize the performance parameters (Mohamed et al., 2015). Furthermore, these techniques have significant potential to develop models that can predict and established the relationship between different inputs and response variables. RSM is a promising analytical tool to determine the significance of interactions and square terms of parameters, 3D response surface generation, and optimize the parameters. A three-level BBD is economical and popular in industrial research for modeling and optimizing the parameters to satisfy the defined desirable response variables. Therefore, in this study, the Box-Behnken design (BBD) which is a subset of RSM was employed as a DOE method for optimizing the mechanical properties of HDPE/PALF/MAPE biocomposite. The individual and simultaneous effects of the fiber length, PALF loading, and MAPE compatibilizer content on tensile, flexural, and impact properties were investigated.
2. Experimental
2.1. Materials
High-density polyethylene [HDPE, density=950 kg/m3, melt flow index (MFI)=12.3 g/10 min] and the coupling agent, polyethylene maleic anhydride (MAPE, Mw 26000) was obtained from M/s Solvay Chemicals Ltd. Kerala, India. The pineapple leaf fiber (PALF) with diameter ranging in between 60 to 100 µm was collected from M/s Go Green products, Chennai, India. The collected fibers were thoroughly washed and then dried in an oven at 60oC to a final moisture content of 5%. The elemental composition and SEM micrograph of the studied PALF is shown in Table 3 and Figure 1, respectively.
Table 3 Elemental composition of PALF.
| C | O | N | Ca | P | Fe | K | Mg | Cu | O/C ratio | References |
| 73.13 | 24.17 | 2.70 | 0.00 | - | - | - | - | 0.00 | 0.33% | (Uhlig, 1998) |
| - | - | 6.4-10 | 2.5-10 | 0.1-0.18 | 0.06-0.11 | 2.89 | 0.33 | 0.002-0.02 | - | (Heinicke & Gortner, 1957) |

2.2. Fabrication of biocomposite samples
Biocomposite samples of each formulation (Table 4) were obtained through melt-blending in a twin-screw extruder (Brabender plasticorder, Germany), which has a mixing chamber of 69 cm3 volumetric capacity. To improve the interfacial bonding strength between fiber and matrix resin, a pre-impregnation technique was utilized. The obtained pre-pregs were cut into 6 mm long pellets and further blended with pure HDPE to obtain the desired composition. The mixing was conducted at 190oC and 35 RPM for 10 min. The pre-mixed pellets were molded in TS-270 injection molding machine (Windsor, India) under the temperature setting of injection hopper and nozzle at 170oC and 180oC, respectively. Specimens were conditioned in a laboratory atmosphere of 23±5oC and 50% RH prior to testing.
Table 4 Biocomposite samples according to box-Behnken experimental design.
| Actual levels of variables | ||||
| Run no. | Name | Fiber length (mm) | Fiber loading (%) | MAPE content (%) |
| 1 | P16L6M5 | 6 | 16 | 5 |
| 2 | P8L20M3 | 20 | 8 | 3 |
| 3 | P24L6M3 | 6 | 24 | 3 |
| 4 | P24L13M5 | 13 | 24 | 5 |
| 5 | P16L13M3 | 13 | 16 | 3 |
| 6 | P8L13M5 | 13 | 8 | 5 |
| 7 | P16L20M1 | 20 | 16 | 1 |
| 8 | P8L6M3 | 6 | 8 | 3 |
| 9 | P16L13M3 | 13 | 16 | 3 |
| 10 | P16L13M3 | 13 | 16 | 3 |
| 11 | P8L13M1 | 13 | 8 | 1 |
| 12 | P24L20M3 | 20 | 24 | 3 |
| 13 | P16L6M1 | 6 | 16 | 1 |
| 14 | P16L13M3 | 13 | 16 | 3 |
| 15 | P16L13M3 | 13 | 16 | 3 |
| 16 | P24L13M1 | 13 | 24 | 1 |
| 17 | P16L20M5 | 20 | 16 | 5 |
2.3. Mechanical tests
Tensile and flexural (three-point bending) tests were conducted on a calibrated Tabletop Tinius Olsen Horizon H50KS, a Universal testing machine as per ASTM D638 and D790 standard, respectively. A digital pendulum impact tester was employed to determine impact strength. Four specimens for each composite sample were evaluated and their average values were reported.
2.4. Response surface method
RSM is a mathematical and statistical technique that can assess the effect of individual parameters and the interaction of parameters on response variables. It has significant potential in modeling and analysis of problems with a small number of experimental data points (Myres et al., 2016). In RSM, a three-level Box Behnken design (BBD) was used to study the effect of linear, quadratic, cubic, and cross product models of three performance parameters and to develop an experimental design matrix. The design was built in Design-Expert software (version 6.0.8) with consideration of three critical variables i.e., fiber length (A), fiber loading (B), and MAPE content (C). The range and levels of the selected parameters are shown in Table 5. In this work, the second order polynomial equation was used for fitting the experimental data and find out the relevant model terms.
Table 5 Actual and coded experimental variables in Box-Behnken design.
| Experimental values | |||||
| Variables | Units | Symbol code | Lower (-1) | Center (0) | Higher (+1) |
| Fiber length | mm | A | 6 | 13 | 20 |
| Fiber loading | wt.% | B | 8 | 16 | 24 |
| MAPE content | wt.% | C | 1 | 3 | 5 |
Where y represents the predicted response, b o , regression equation constant; b i , linear coefficient; b ii , square coefficient of each parameter; and b ij , first order interaction coefficient. To estimate the desired responses with reliable measurements, a total number of 17 experiments were conducted with 12 factorial points. Furthermore, the experimental sequence was randomized to minimize the effect of uncontrollable parameters. The regression (R2), adjusted (R2), predicted (R2), pure error sum of squares, lack of fit, response plots, and adequate precision were used in the determination of the robustness of the developed model.
3. Results and discussion
3.1. ANOVA and regression models
The experimental test results were used to generate the mathematical models for each response variable. Among different mathematical models (linear, quadratic, cubic and 2FI), the quadratic was selected according to three different tests - the sequential model sum of squares, adequacy, and lack-of-fit (Table 6). The sum of square and mean square in ANOVA results (Tables 7-11) also revealed the adequacy of quadratic model for fitting the experimental data. The second-order equations (ii-vi) express the overall predictive model in terms of variables:
Table 6 Summary of the models.
| Response | Model | Sequential
p-value |
Lack of fit value | R2 | R2adj | R2pred | PRESS | Precision | Remarks | |
| Tensile strength (MPa) | Linear | 0.3313 | <0.0001 | 0.2242 | 0.0451 | -0.2169 | 397.21 | Insufficient | ||
| 2FI | 0.9947 | <0.0001 | 0.2297 | -0.2325 | -1.2653 | 739.41 | Insufficient | |||
| Quadratic | <0.0001 | 0.0637 | 0.9902 | 0.9776 | 0.8704 | 42.29 | Sufficient | Suggested | ||
| Cubic | 0.0637 | - | 0.9981 | 0.9925 | - | - | Insufficient | Aliased | ||
| Tensile modulus (MPa) | Linear | 0.0538 | <0.0001 | 0.4336 | 0.3029 | 0.0747 | 54345.97 | Insufficient | ||
| 2FI | 0.3944 | <0.0001 | 0.5740 | 0.3184 | -0.1068 | 65006.07 | Insufficient | |||
| Quadratic | <0.0001 | 0.0621 | 0.9986 | 0.9968 | 0.9816 | 1081.94 | Sufficient | Suggested | ||
| Cubic | 0.0621 | - | 0.9997 | 0.9990 | - | - | Insufficient | Aliased | ||
| Flexural strength (MPa) | Linear | 0.0334 | <0.0001 | 0.4765 | 0.3557 | 0.2169 | 892.27 | Insufficient | ||
| 2FI | 0.7691 | <0.0001 | 0.5301 | 0.2482 | -0.1138 | 1269.06 | Insufficient | |||
| Quadratic | <0.0001 | 0.41 | 0.9984 | 0.9963 | 0.9820 | 20.50 | Sufficient | Suggested | ||
| Cubic | 0.1957 | - | 0.9994 | 0.9977 | - | - | Insufficient | Aliased | ||
| Flexural modulus (MPa) | Linear | 0.0062 | <0.0001 | 0.6018 | 0.5100 | 0.3252 | 15204.63 | Insufficient | ||
| 2FI | 0.4738 | <0.0001 | 0.6867 | 0.4987 | 0.0499 | 21410.35 | Insufficient | |||
| Quadratic | <0.0001 | 0.0085 | 0.9881 | 0.9728 | 0.8214 | 4023.30 | Sufficient | Suggested | ||
| Cubic | 0.0085 | - | 0.9992 | 0.9968 | - | - | Insufficient | Aliased | ||
| Impact strength (J/m) | Linear | <0.0001 | 0.0790 | 0.8400 | 0.8030 | 0.6877 | 212.25 | Insufficient | ||
| 2FI | 0.0141 | 0.2534 | 0.9420 | 0.9072 | 0.7964 | 138.40 | Insufficient | |||
| Quadratic | 0.0178 | 0.9766 | 0.9851 | 0.9660 | 0.9670 | 22.41 | Sufficient | Suggested | ||
| Cubic | 0.9766 | - | 0.9858 | 0.9431 | - | - | Insufficient | Aliased |
Table 7 Initial ANOVA results and statistical parameters for tensile strength.
| Source | Sum of squares | DF | Mean square | F-value | p-value prob>F | |
| Model | 323.22 | 9 | 35.91 | 78.74 | <0.0001 | Significant |
| A - fiber length | 0.19 | 1 | 0.19 | 0.41 | 0.5401 | |
| B - fiber loading | 65.61 | 1 | 65.61 | 143.85 | <0.0001 | |
| C - MAPE | 7.37 | 1 | 7.37 | 16.17 | 0.0051 | |
| A2 | 34.91 | 1 | 34.91 | 76.55 | <0.0001 | |
| B2 | 184.50 | 1 | 184.50 | 404.52 | <0.0001 | |
| C2 | 11.21 | 1 | 11.21 | 24.59 | 0.0016 | |
| AB | 0.24 | 1 | 0.24 | 0.53 | 0.4916 | |
| AC | 0.038 | 1 | 0.038 | 0.083 | 0.7811 | |
| BC | 1.53 | 1 | 1.53 | 3.34 | 0.1102 | |
| Residual | 3.19 | 7 | 0.46 | |||
| Lack of fit | 2.58 | 3 | 0.86 | 5.66 | 0.0637 | Not significant |
| Pure error | 0.61 | 4 | 0.15 | |||
| Cor total | 326.41 | 16 | ||||
| R2=0.9902 | Adjusted
R2=0.9776 |
Predicted
R2=0.8704 |
Table 8 ANOVA results and statistical parameters for tensile modulus.
| Source | Sum of squares | DF | Mean square | F-value | p-value prob>F | |
| Model | 58651.48 | 9 | 6516.83 | 560.03 | <0.0001 | Significant |
| A - fiber length | 7823.75 | 1 | 7823.75 | 672.34 | <0.0001 | |
| B - fiber loading | 10136.03 | 1 | 10136.03 | 871.04 | <0.0001 | |
| C - MAPE | 7509.25 | 1 | 7509.25 | 645.31 | <0.0001 | |
| A2 | 2263.10 | 1 | 2263.10 | 194.48 | <0.0001 | |
| B2 | 14376.86 | 1 | 14376.86 | 1235.48 | <0.0001 | |
| C2 | 6068.41 | 1 | 6068.41 | 521.49 | <0.0001 | |
| AB | 1966.48 | 1 | 1966.48 | 168.99 | <0.0001 | |
| AC | 993.83 | 1 | 993.83 | 85.40 | <0.0001 | |
| BC | 5284.56 | 1 | 5284.56 | 454.13 | <0.0001 | |
| Residual | 81.46 | 7 | 11.64 | |||
| Lack of fit | 66.12 | 3 | 22.04 | 5.75 | 0.0621 | Not significant |
| Pure error | 15.33 | 4 | 3.83 | |||
| Cor total | 58732.93 | 16 | ||||
| R2=0.9986 | Adjusted
R2=0.9968 |
Predicted
R2=0.9816 |
Table 9 ANOVA results and statistical parameters for flexural strength.
| Source | Sum of squares | DF | Mean square | F-value | p-value prob>F | |
| Model | 1137.56 | 9 | 126.40 | 475.55 | <0.0001 | Significant |
| A - fiber length | 14.07 | 1 | 14.07 | 52.94 | 0.0002 | |
| B - fiber loading | 302.09 | 1 | 302.09 | 1136.59 | <0.0001 | |
| C - MAPE | 226.74 | 1 | 226.74 | 853.09 | <0.0001 | |
| A2 | 172.84 | 1 | 172.84 | 650.30 | <0.0001 | |
| B2 | 209.54 | 1 | 209.54 | 788.39 | <0.0001 | |
| C2 | 96.69 | 1 | 96.69 | 363.78 | <0.0001 | |
| AB | 6.18 | 1 | 6.18 | 23.23 | 0.0019 | |
| AC | 2.62 | 1 | 2.62 | 9.87 | 0.0163 | |
| BC | 52.35 | 1 | 52.35 | 196.95 | <0.0001 | |
| Residual | 1.86 | 7 | 0.27 | |||
| Lack of fit | 1.22 | 3 | 0.41 | 2.53 | 0.1957 | Not significant |
| Pure error | 0.64 | 4 | 0.16 | |||
| Cor total | 1139.42 | 16 | ||||
| R2=0.9984 | Adjusted
R2=0.9963 |
Predicted
R2=0.9820 |
Table 10 Initial ANOVA results and statistical parameters for flexural modulus.
| Source | Sum of squares | DF | Mean square | F-value | p-value prob>F | |
| Model | 22265.74 | 9 | 2473.97 | 64.63 | <0.0001 | Significant |
| A - fiber length | 2293 | 1 | 2293 | 59.91 | 0.0001 | |
| B - fiber loading | 8930.49 | 1 | 8930.49 | 233.31 | <0.0001 | |
| C - MAPE | 2338.25 | 1 | 2338.25 | 61.09 | 0.0001 | |
| A2 | 5172.35 | 1 | 5172.35 | 135.13 | <0.0001 | |
| B2 | 850.98 | 1 | 850.98 | 22.23 | 0.0022 | |
| C2 | 301.46 | 1 | 301.46 | 7.88 | 0.0263 | |
| AB | 1500.40 | 1 | 1500.40 | 39.20 | 0.0004 | |
| AC | 154.63 | 1 | 154.63 | 4.04 | 0.0844 | |
| BC | 256.32 | 1 | 256.32 | 6.70 | 0.0361 | |
| Residual | 267.94 | 7 | 38.28 | |||
| Lack of fit | 249.68 | 3 | 83.23 | 18.23 | 0.0685 | Not significant |
| Pure error | 18.26 | 4 | 4.56 | |||
| Cor total | 22533.68 | 16 | ||||
| R2=0.9881 | Adjusted
R2=0.9728 |
Predicted
R2=0.8214 |
Table 11 Initial ANOVA results and statistical parameters for impact strength.
| Source | Sum of squares | DF | Mean square | F-value | p-value prob>F | |
| Model | 669.50 | 9 | 74.39 | 51.47 | <0.0001 | Significant |
| A - fiber length | 124.98 | 1 | 124.98 | 86.47 | <0.0001 | |
| B - fiber loading | 246.98 | 1 | 246.98 | 170.87 | <0.0001 | |
| C - MAPE | 198.90 | 1 | 198.90 | 137.61 | <0.0001 | |
| A2 | 10.52 | 1 | 10.52 | 7.28 | 0.0307 | |
| B2 | 14.38 | 1 | 14.38 | 9.95 | 0.0161 | |
| C2 | 4.53 | 1 | 4.53 | 3.13 | 0.1201 | |
| AB | 1.20 | 1 | 1.20 | 0.83 | 0.3927 | |
| AC | 42.45 | 1 | 42.45 | 29.37 | 0.0010 | |
| BC | 25.70 | 1 | 25.70 | 17.78 | 0.0040 | |
| Residual | 10.12 | 9 | 1.45 | |||
| Lack of fit | 0.46 | 5 | 0.15 | 0.063 | 0.9766 | Not significant |
| Pure error | 9.66 | 4 | 2.42 | |||
| Cor total | 679.62 | 16 | ||||
| R2=0.9851 | Adjusted
R2=0.9660 |
Predicted
R2=0.9670 |
where A, B, and C are fiber length, fiber loading, and MAPE content, respectively. The significance of each model term was explained in terms of probability value (p-value). To eliminate non-effective terms and make regression model best fitted, ANOVA was repeated, and the results are presented in Tables 12-14. A fitted regression model with statistical significance is presented in the following equations:
Table 12 Final ANOVA results and statistical parameters for tensile strength.
| Source | Sum of squares | DF | Mean square | F-value | p-value prob>F | |
| Model | 321.41 | 6 | 53.57 | 107.22 | <0.0001 | Significant |
| A - fiber length | 0.19 | 1 | 0.19 | 0.38 | 0.5521 | |
| B - fiber loading | 65.61 | 1 | 65.61 | 131.32 | <0.0001 | |
| C - MAPE | 7.37 | 1 | 7.37 | 14.76 | 0.0033 | |
| A2 | 34.91 | 1 | 34.91 | 69.88 | <0.0001 | |
| B2 | 184.95 | 1 | 184.50 | 369.29 | <0.0001 | |
| C2 | 11.21 | 1 | 11.21 | 22.45 | 0.0008 | |
| Residual | 5 | 10 | 0.50 | |||
| Lack of fit | 4.39 | 6 | 0.73 | 4.80 | 0.0753 | Not significant |
| Pure error | 0.61 | 4 | 0.15 | |||
| Cor total | 326.41 | 16 | ||||
| R2=0.9847 | Adjusted
R2=0.9755 |
Predicted
R2=0.9433 |
Table 13 Final ANOVA results and statistical parameters for flexural modulus.
| Source | Sum of squares | DF | Mean square | F-value | p-value prob>F | |
| Model | 21553.33 | 6 | 3592.22 | 36.64 | <0.0001 | Significant |
| A - fiber length | 2293 | 1 | 2293 | 23.39 | 0.0007 | |
| B - fiber loading | 8930 | 1 | 8930 | 91.10 | <0.0001 | |
| C - MAPE | 2338.25 | 1 | 2338.25 | 23.85 | 0.0006 | |
| A2 | 5319.36 | 1 | 5319.36 | 54.26 | <0.0001 | |
| B2 | 907.65 | 1 | 907.65 | 9.26 | 0.0124 | |
| AB | 1500.40 | 1 | 1500.40 | 15.30 | 0.0029 | |
| Residual | 980.35 | 10 | 98.03 | |||
| Lack of fit | 962.09 | 6 | 160.35 | 35.13 | 0.0920 | Not significant |
| Pure error | 18.26 | 4 | 4.56 | |||
| Cor total | 22533.68 | 16 | ||||
| R2=0.9565 | Adjusted
R2=0.9304 |
Predicted
R2=0.8446 |
Table 14 Final ANOVA results and statistical parameters for impact strength.
| Source | Sum of squares | DF | Mean square | F-value | p-value prob>F | |
| Model | 663.78 | 7 | 94.83 | 53.86 | <0.0001 | Significant |
| A - fiber length | 124.98 | 1 | 124.98 | 70.99 | <0.0001 | |
| B - fiber loading | 246.98 | 1 | 246.98 | 140.29 | <0.0001 | |
| C - MAPE | 198.90 | 1 | 198.90 | 112.98 | <0.0001 | |
| A2 | 9.83 | 1 | 9.83 | 5.58 | 0.0424 | |
| B2 | 13.58 | 1 | 13.58 | 7.71 | 0.0215 | |
| AC | 42.45 | 1 | 42.45 | 24.11 | 0.0008 | |
| BC | 25.70 | 1 | 25.70 | 14.60 | 0.0041 | |
| Residual | 15.84 | 9 | 1.76 | |||
| Lack of fit | 6.18 | 5 | 1.24 | 0.51 | 0.7598 | Not significant |
| Pure error | 9.66 | 4 | 2.42 | |||
| Cor total | 679.62 | 16 | ||||
| R2=0.9767 | Adjusted
R2=0.9586 |
Predicted
R2=0.9256 |
validation of regression models at 95% confidence interval was explained in terms of p, F, and R2 values. The insignificant “Lack-of-Fit” and p-values less than 0.05 confirmed the rejection of null-hypothesis. The model F (107.22) and p (<0.0001) values for tensile strength, F (560.03) and p (<0.0001) values for tensile modulus, F (475.55) and p (<0.0001) values for flexural strength, F (36.64) and p (<0.0001) values for flexural modulus, and F (53.86) and p (<0.0001) values for impact strength showed that the quadratic model was significant. The regression model was further analyzed by evaluating R2, adjusted R2, and predicted R2 which indicates the proportion of total variation in response variable predicted by model. The higher correlation coefficients confirm the suitability and correctness of the model. The adjusted R2 can be used to prevent probability error while predicted R2 indicates how well the model predicts responses for new observations. The adjusted R2 and predicted R2 are in reasonable agreement with the values of 0.9755 and 0.9433 for tensile strength, 0.9968 and 0.9816 for tensile modulus, 0.9963 and 0.9820 for flexural strength, 0.9304 and 0.8446 for flexural modulus, and 0.9586 and 0.9256 for impact strength, respectively. The R2 value for response variables implying that a high correlation exists between observed and predicted values. In addition, the adequacy of the model was confirmed using normal probabili-ty plots of the residuals, predicted versus actual values, and residuals versus predicted values plots. Figures 2-4 revealed that the error points are normally distributed along a straight line, implying that the model is adequate, and it represents the experimental data. The correlation between predicted response values and the actual values is shown in Figures 5-7, presenting uniformly distributed data points around the mean of the response variables. The linear regression fit is obtained with an R2 values of 0.9847, 0.9986, 0.9984, 0.9565, and 0.9767 for the tensile strength, tensile modulus, flexural strength, flexural modulus, and impact strength respectively, indicating that the model is accurately describing the experimental observations. In the end, the final plots of residuals versus predicted values (Figures 8-10) concluded that the residuals scattering for all mechanical responses were not significant which confirms that the proposed model was suitable. The maximum error (Tables 15-17) lies in between predicted and measured values were 4.10%, 0.26%, 1.51%, 1.01%, and 4.02% for the tensile strength, tensile modulus, flexural strength, flexural modulus, and impact strength, respectively.

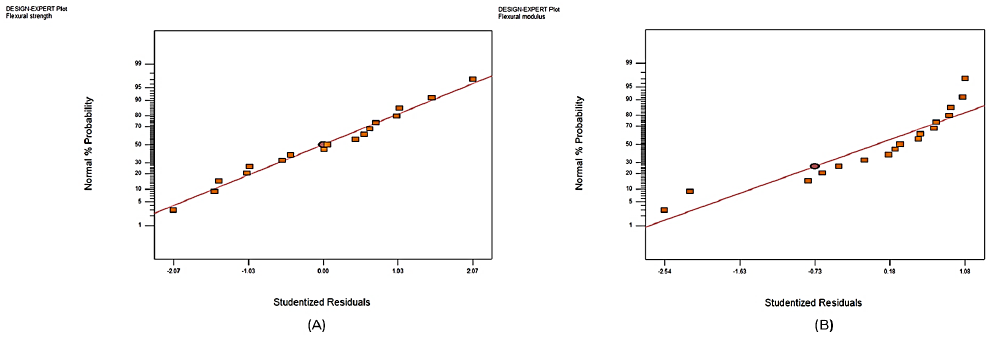
Figure 3 Normal probability plot of the residuals for (a) flexural strength and (b) flexural modulus.


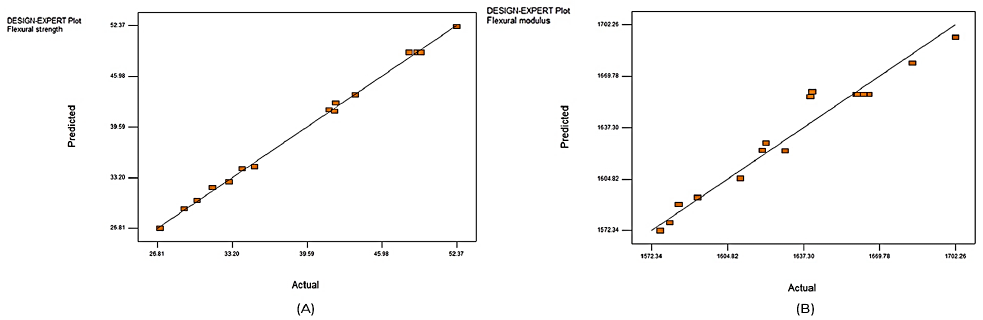
Figure 6 Plots of predicted versus actual values for (a) flexural strength and (b) flexural modulus.


Table 15 Comparison between measured and predicted values for tensile strength and modulus.
| Tensile strength (MPa) | Tensile modulus (MPa) | |||||
| Name | Experimental | Predicted | Error (%) | Experimental | Predicted | Error (%) |
| P16L6M5 | 19.75 | 19.98 | -1.16 | 1415.80 | 1412.16 | 0.25 |
| P8L20M3 | 20.01 | 19.68 | 1.64 | 1303.46 | 1305.27 | -0.14 |
| P24L6M3 | 24.89 | 25.71 | -3.29 | 1440.82 | 1439.01 | 0.13 |
| P24L13M5 | 26.13 | 25.41 | 2.75 | 1417.17 | 1420.81 | -0.26 |
| P16L13M3 | 27.30 | 26.88 | 1.53 | 1428.37 | 1431.18 | -0.196 |
| P8L13M5 | 25.74 | 26.57 | -3.22 | 1339.75 | 1337.11 | 0.197 |
| P16L20M1 | 29.43 | 28.80 | 2.14 | 1458.29 | 1460.93 | -0.18 |
| P8L6M3 | 28.26 | 28.49 | -0.81 | 1432.72 | 1429.91 | 0.196 |
| P16L13M3 | 20.89 | 20.12 | 3.68 | 1348.82 | 1349.65 | -0.061 |
| P16L13M3 | 25.48 | 25.85 | -1.42 | 1349.14 | 1348.14 | 0.074 |
| P8L13M1 | 21.17 | 22.04 | -4.10 | 1337.23 | 1338.23 | -0.074 |
| P24L20M3 | 28.23 | 27.77 | 1.62 | 1482.94 | 1482.11 | 0.055 |
| P16L6M1 | 31.92 | 32.19 | -0.84 | 1477.09 | 1475.93 | 0.078 |
| P16L13M3 | 32.49 | 32.19 | 0.92 | 1475.52 | 1475.93 | -0.027 |
| P16L13M3 | 31.69 | 32.19 | -1.57 | 1472.92 | 1475.93 | -0.20 |
| P24L13M1 | 32.24 | 32.19 | 0.142 | 1478.11 | 1475.93 | 0.15 |
| P16L20M5 | 32.63 | 32.19 | 1.34 | 1476.01 | 1475.93 | 0.005 |
Table 16 Comparison between measured and predicted values for flexural strength and modulus.
| Flexural strength (MPa) | Flexural modulus (MPa) | |||||
| Name | Experimental | Predicted | Error (%) | Experimental | Predicted | Error (%) |
| P16L6M5 | 31.56 | 31.95 | -1.24 | 1576.28 | 1572.34 | 0.25 |
| P8L20M3 | 27.07 | 26.81 | 0.96 | 1580.25 | 1577.22 | 0.19 |
| P24L6M3 | 41.49 | 41.75 | -0.62 | 1683.77 | 1677.90 | 0.35 |
| P24L13M5 | 41.97 | 41.58 | 0.93 | 1610.27 | 1605.30 | 0.31 |
| P16L13M3 | 35.13 | 34.60 | 1.51 | 1629.48 | 1622.68 | 0.42 |
| P8L13M5 | 30.21 | 30.32 | -0.36 | 1584.09 | 1588.82 | -0.29 |
| P16L20M1 | 43.74 | 43.63 | 0.25 | 1640.27 | 1656.88 | -1.01 |
| P8L6M3 | 42.06 | 42.59 | -1.26 | 1619.75 | 1623.02 | -0.20 |
| P16L13M3 | 29.14 | 29.29 | -0.51 | 1592.21 | 1593.18 | -0.06 |
| P16L13M3 | 34.07 | 34.34 | -0.79 | 1641.09 | 1660 | -1.15 |
| P8L13M1 | 32.97 | 32.70 | 0.81 | 1621.36 | 1627.37 | -0.37 |
| P24L20M3 | 52.37 | 52.22 | 0.29 | 1702.26 | 1694.19 | 0.47 |
| P16L6M1 | 48.32 | 48.98 | -1.37 | 1659.81 | 1658.35 | 0.088 |
| P16L13M3 | 49.01 | 48.98 | 0.06 | 1661.08 | 1658.35 | 0.16 |
| P16L13M3 | 48.99 | 48.98 | 0.02 | 1665.05 | 1658.35 | 0.40 |
| P24L13M1 | 49.28 | 48.98 | 0.61 | 1660.52 | 1658.35 | 0.13 |
| P16L20M5 | 49.32 | 48.98 | 0.69 | 1663.08 | 1658.35 | 0.28 |
Table 17 Comparison between measured and predicted values for impact strength.
| Impact strength (J/m) | ||||
| Name | Experimental | Predicted | Error (%) | |
| P16L6M5 | 64.31 | 63.19 | 1.74 | |
| P8L20M3 | 71.25 | 71.10 | 0.21 | |
| P24L6M3 | 51.92 | 52.08 | -0.31 | |
| P24L13M5 | 61.05 | 59.98 | 1.75 | |
| P16L13M3 | 57.30 | 57.57 | -0.47 | |
| P8L13M5 | 71.59 | 71.99 | -0.56 | |
| P16L20M1 | 53.42 | 54.11 | -1.29 | |
| P8L6M3 | 54.68 | 55.50 | -1.5 | |
| P16L13M3 | 72.29 | 73.14 | -1.18 | |
| P16L13M3 | 56.29 | 56.96 | -1.19 | |
| P8L13M1 | 57.67 | 58.10 | -0.75 | |
| P24L20M3 | 51.81 | 52.05 | -0.46 | |
| P16L6M1 | 60.71 | 58.27 | 4.02 | |
| P16L13M3 | 59.67 | 58.27 | 2.35 | |
| P16L13M3 | 56.98 | 58.27 | -2.26 | |
| P24L13M1 | 57.39 | 58.27 | -1.53 | |
| P16L20M5 | 58.77 | 58.27 | 0.85 | |
3.2. Effect of design parameters on tensile properties of biocomposites
Figure 11 (a)-(d) illustrate the 3D surface response plots for tensile strength and modulus as a function of fiber length and content, keeping the MAPE load fixed at 1 and 5 wt.%. The tensile strength was increased to a maximum value and then decreased slowly with the increase of fiber length. However, the tensile modulus was varied inversely with fiber length, and it was due to the severe fiber breakage and fibrillation of longer PALF during composite compounding. Irrespective of fiber length, the incorporation of PALF beyond a specified limit did not produce any significant reinforcing effect. This was because of the agglomeration and poor interfacial adhesion of fibers within the polymer matrix.
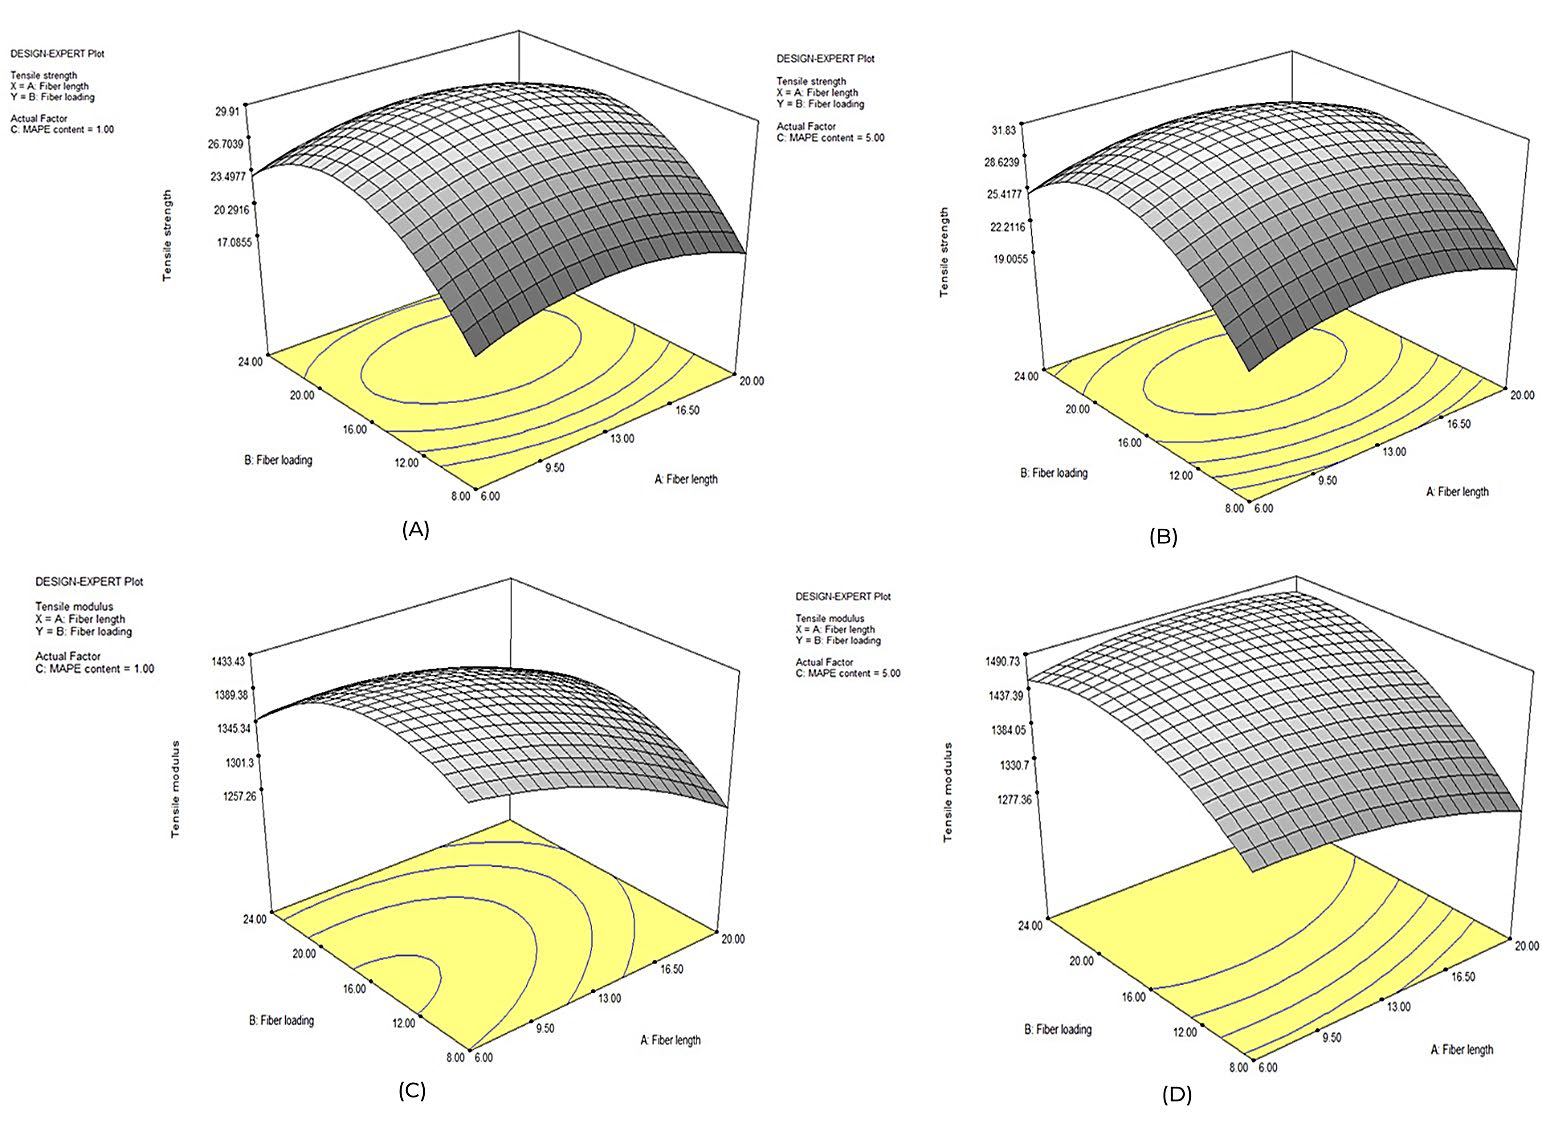
Figure 11 3D surface plots for the effect of fiber length and fiber loading on tensile strength (a) 1 wt.% MAPE, (b) 5 wt.% MAPE, and tensile modulus (c) 1 wt.% MAPE, (d) 5 wt.% MAPE.
The variation in tensile properties with fiber length and compatibilizer content is shown in Figure 12 (a)-(d). The tensile strength and stiffness were increased to maximum values and then decreased with the increase of MAPE content. It was due to the excess removal of lignin compound in highly concentrated solution. Figure 13 (c)-(d) reveals the significant effect of fiber loading and MAPE content on tensile strength and modulus. The compatibilizer effect was pronounced only under high fiber loading condition (24 wt.%) which results in an increase of tensile modulus with the increase of MAPE content. It was due to the formation of rigid networks which constraint the movement of polymeric chains. The 3.6 wt.% MAPE compatibilized composite having 17% fiber content with 13 mm fiber length exhibits maximum tensile strength (Table 18).
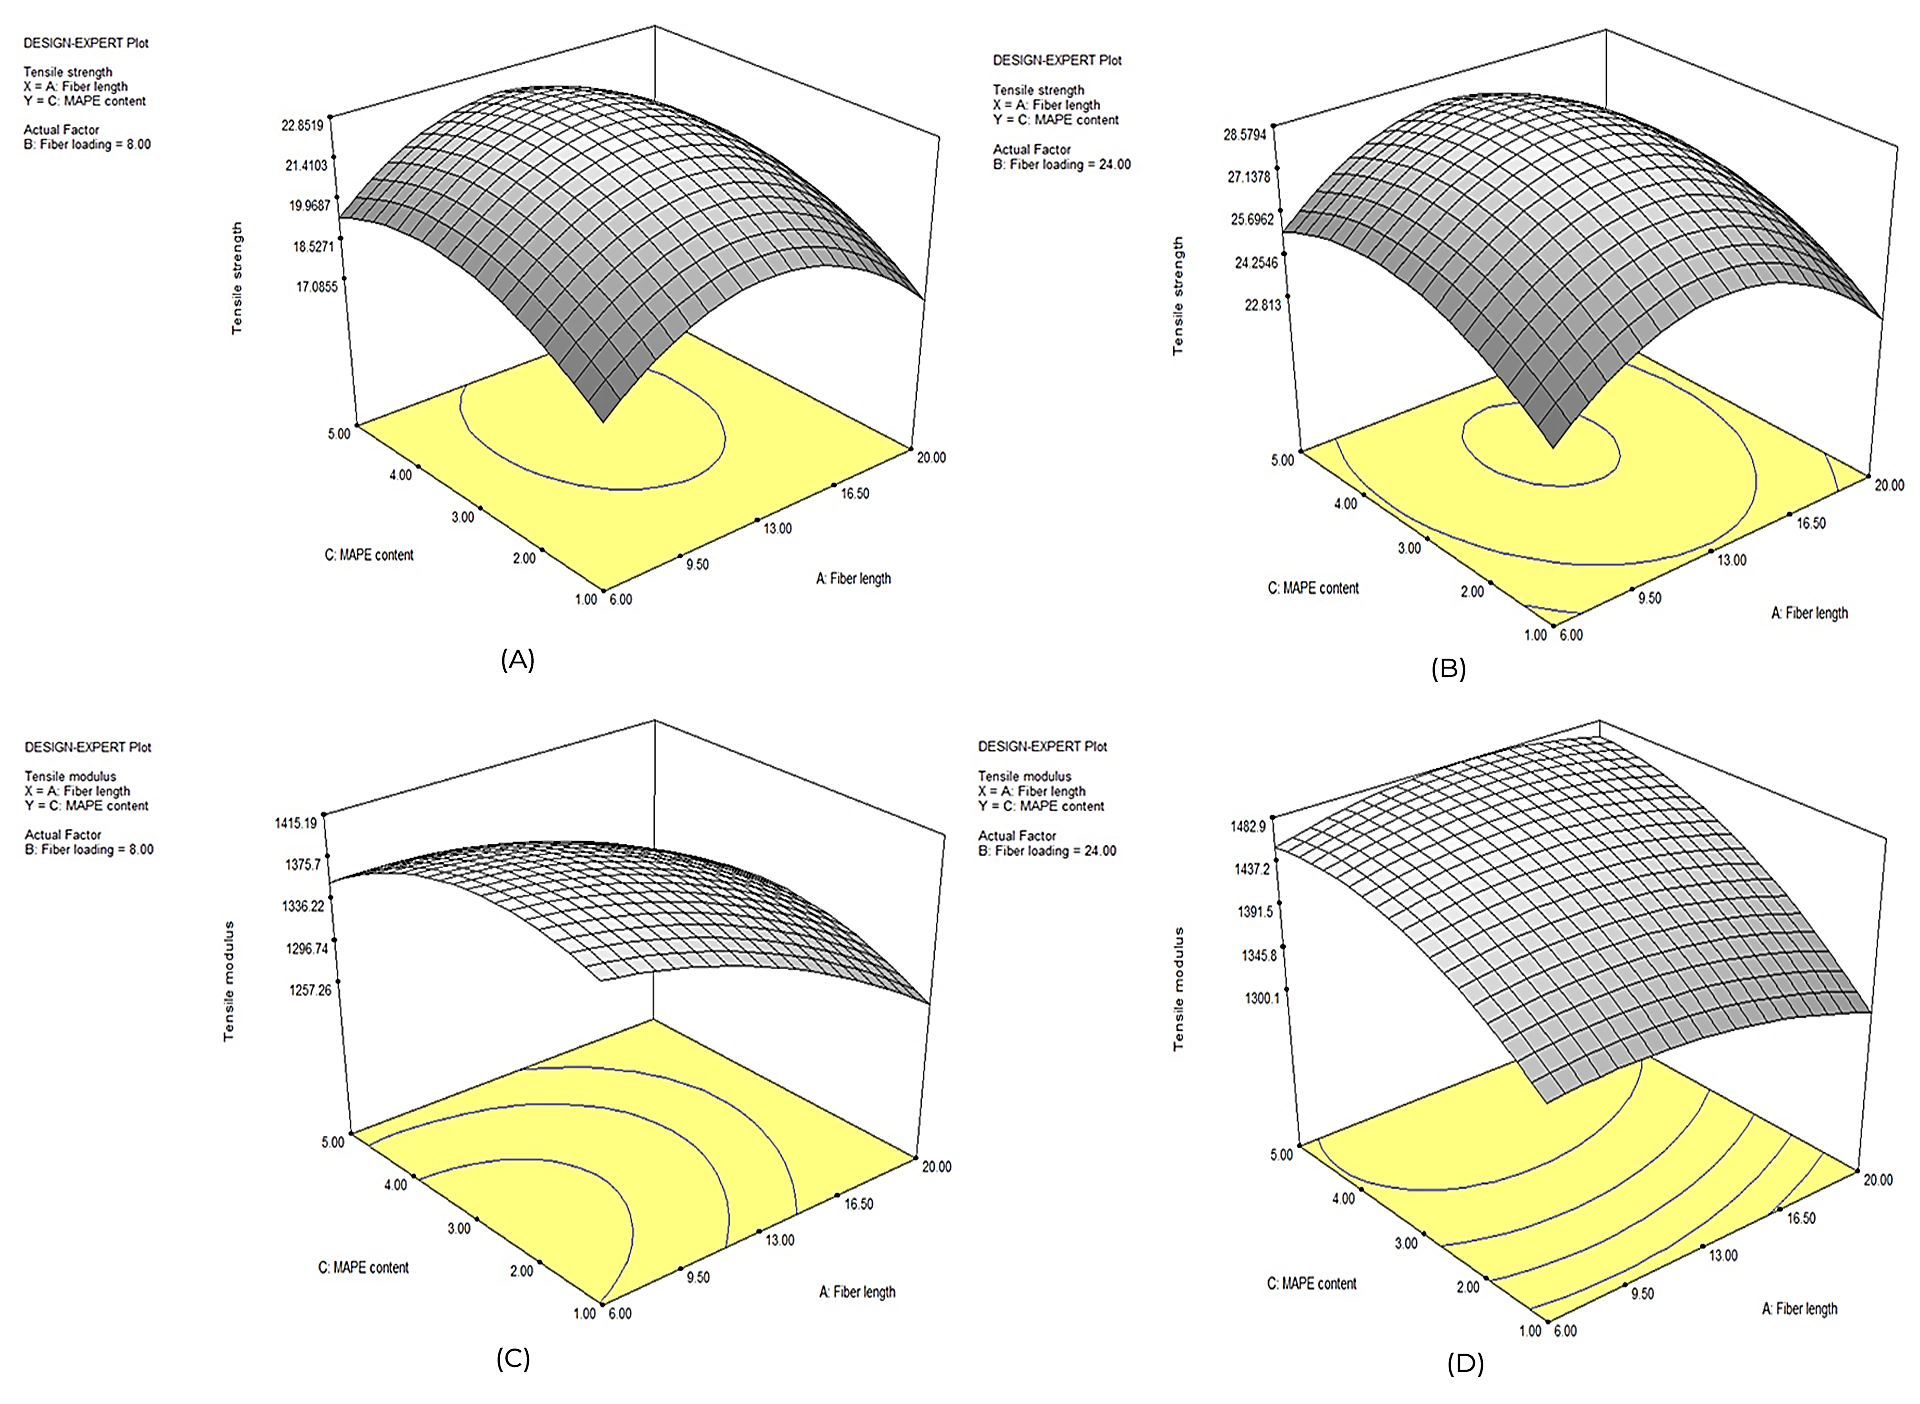
Figure 12 3D surface plots for the effect of fiber length and MAPE on tensile strength (a) 8 wt.% PALF, (b) 24 wt.% PALF, and tensile modulus (c) 8 wt.% PALF, (d) 24 wt.% PALF.
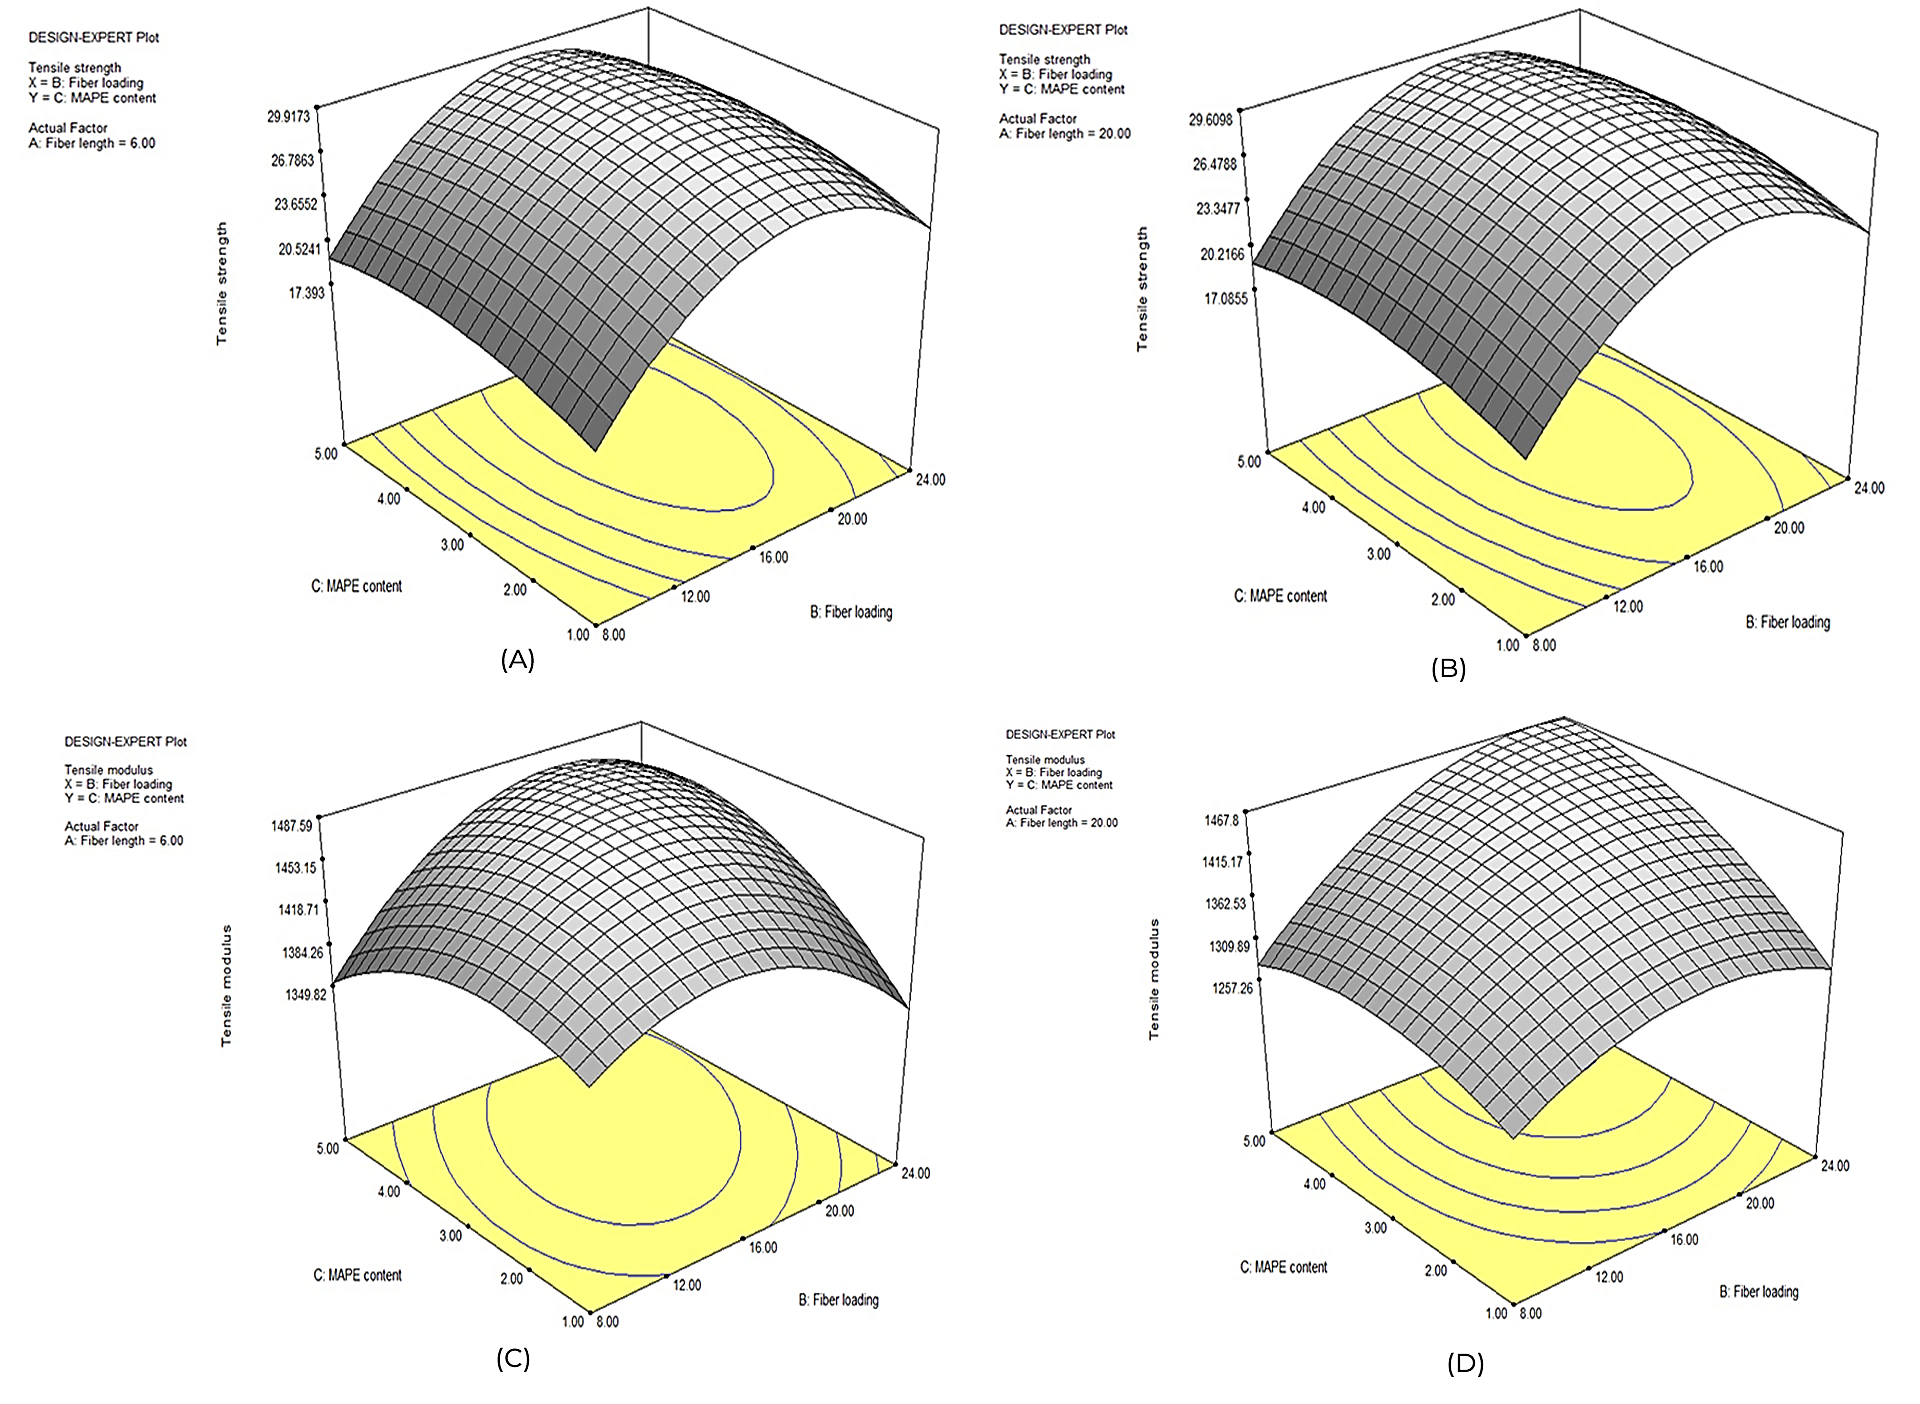
Figure 13 3D surface plots for the effect of fiber loading and MAPE on tensile strength (a) 6 mm fiber length, (b) 20 mm fiber length, and tensile modulus (c) 6 mm fiber length, (d) 20 mm fiber length.
Table 18 Optimum values of design parameters for maximum mechanical properties.
| Fiber length (mm) | Fiber loading (%) | MAPE content (%) | Properties | |
| Predicted | Experimental | |||
| 13 | 17 | 3.6 | Max tensile strength: 32.64 MPa | 32.63 MPa |
| 11 | 16 | 4 | Max tensile modulus: 1488 MPa | 1481 MPa |
| 14 | 22 | 4.5 | Max flexural strength: 52.72 MPa | 51.59 MPa |
| 9 | 24 | 5 | Max. flexural modulus: 1702 MPa | 1701.01 MPa |
| 14 | 9 | 1 | Max. impact strength: 72.69 MPa | 70.89 MPa |
The main effect plot of each parameter on tensile properties of biocomposites is shown in Figure 14. Among all three critical variables, the fiber loading has highest degree of influence on tensile properties. The strength and stiffness of biocomposites were increased to maximum values and then decreased with the increase of fiber content.

3.3. Effect of design parameters on flexural properties of biocomposites
The interaction effect of fiber length and content on flexural properties of biocomposites is shown in Figure 15 (a)-(d). Like tensile strength, the flexural strength as well as flexural modulus were increased to maximum values and then gradually decreased with the increase of fiber length. The flexural modulus of biocomposites was increased with the increase of fiber content and it was due to the presence of hydroxyl groups in PALF which facilitate in binding of polymeric chains and the chains entanglement.
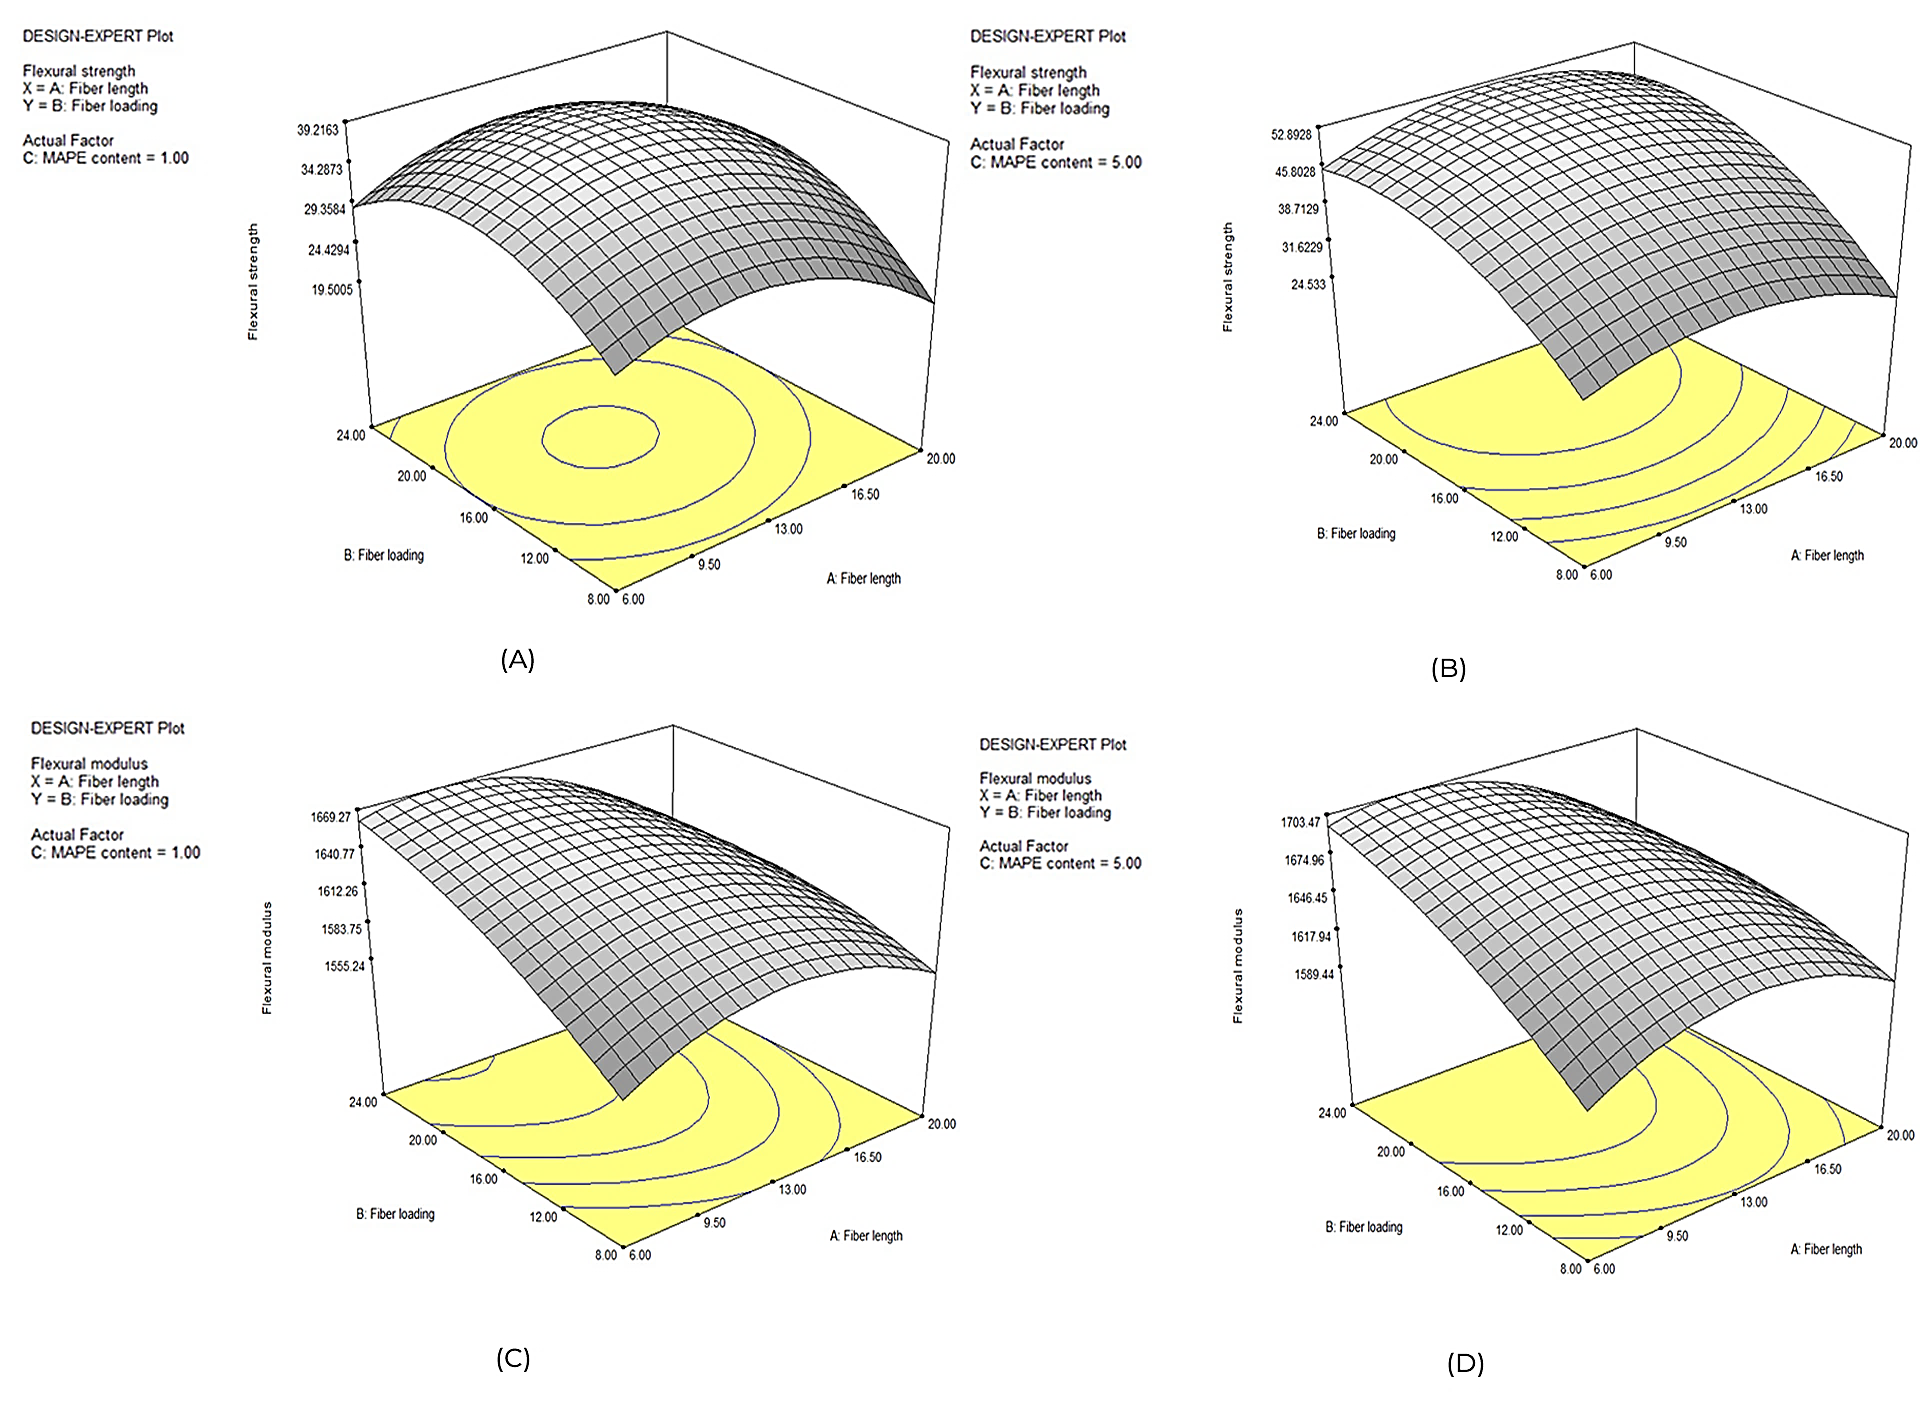
Figure 15 3D surface plots for the effect of fiber length and fiber loading on flexural strength (a) 1 wt.% MAPE, (b) 5 wt.% MAPE, and flexural modulus (c) 1 wt.% MAPE, (d) 5 wt.% MAPE.
Figure 16 (a)-(d) reveals the combined effect of fiber length and MAPE content on flexural properties of biocomposites. It was observed that for all fiber length, the flexural strength and modulus were increased with the increase of compatibilizer load, and it was due to the formation of covalent linkages in between anhydride and hydroxyl (-OH) groups of fibers. The interaction effect of fiber loading and MAPE content on flexural properties of biocomposites is shown in Figure 17 (a)-(d). It is worth to noted that the reinforcement efficiency of PALF was significantly increased after the addition of compatibilizer. The interaction between fiber loading and MAPE content significantly affects the flexural strength (p-value BC<0.05). The 4.5 wt.% MAPE compatibilized composite having 22% fiber content with 14 mm length exhibits maximum flexural strength (Table 18).
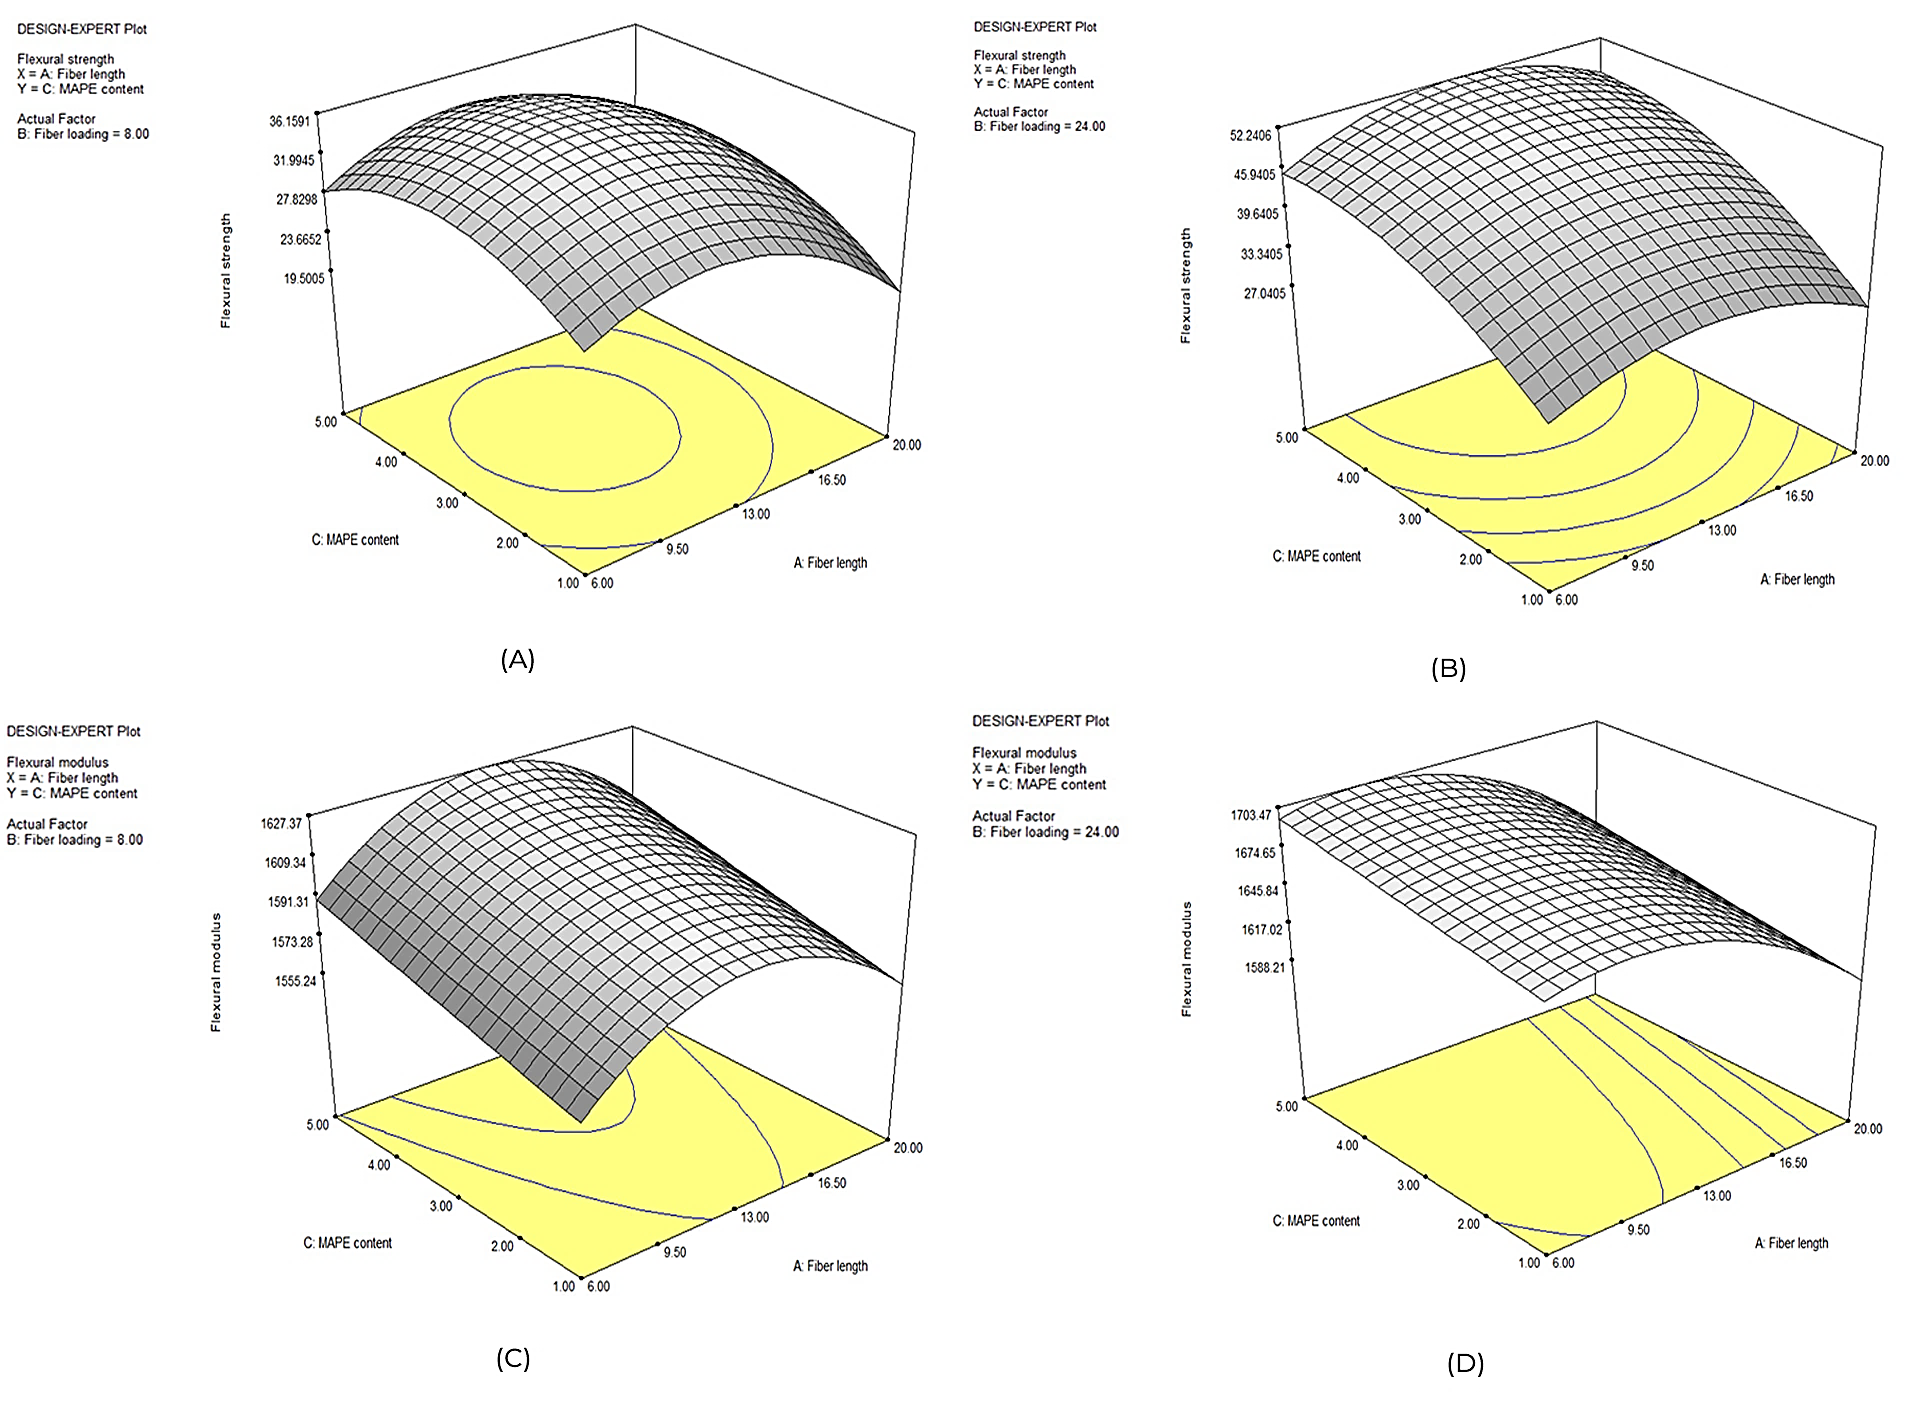
Figure 16 3D surface plots for the effect of fiber length and MAPE on flexural strength (a) 8 wt.% PALF, (b) 24 wt.% PALF, and flexural modulus (c) 8 wt.% PALF, (d) 24 wt.% PALF.
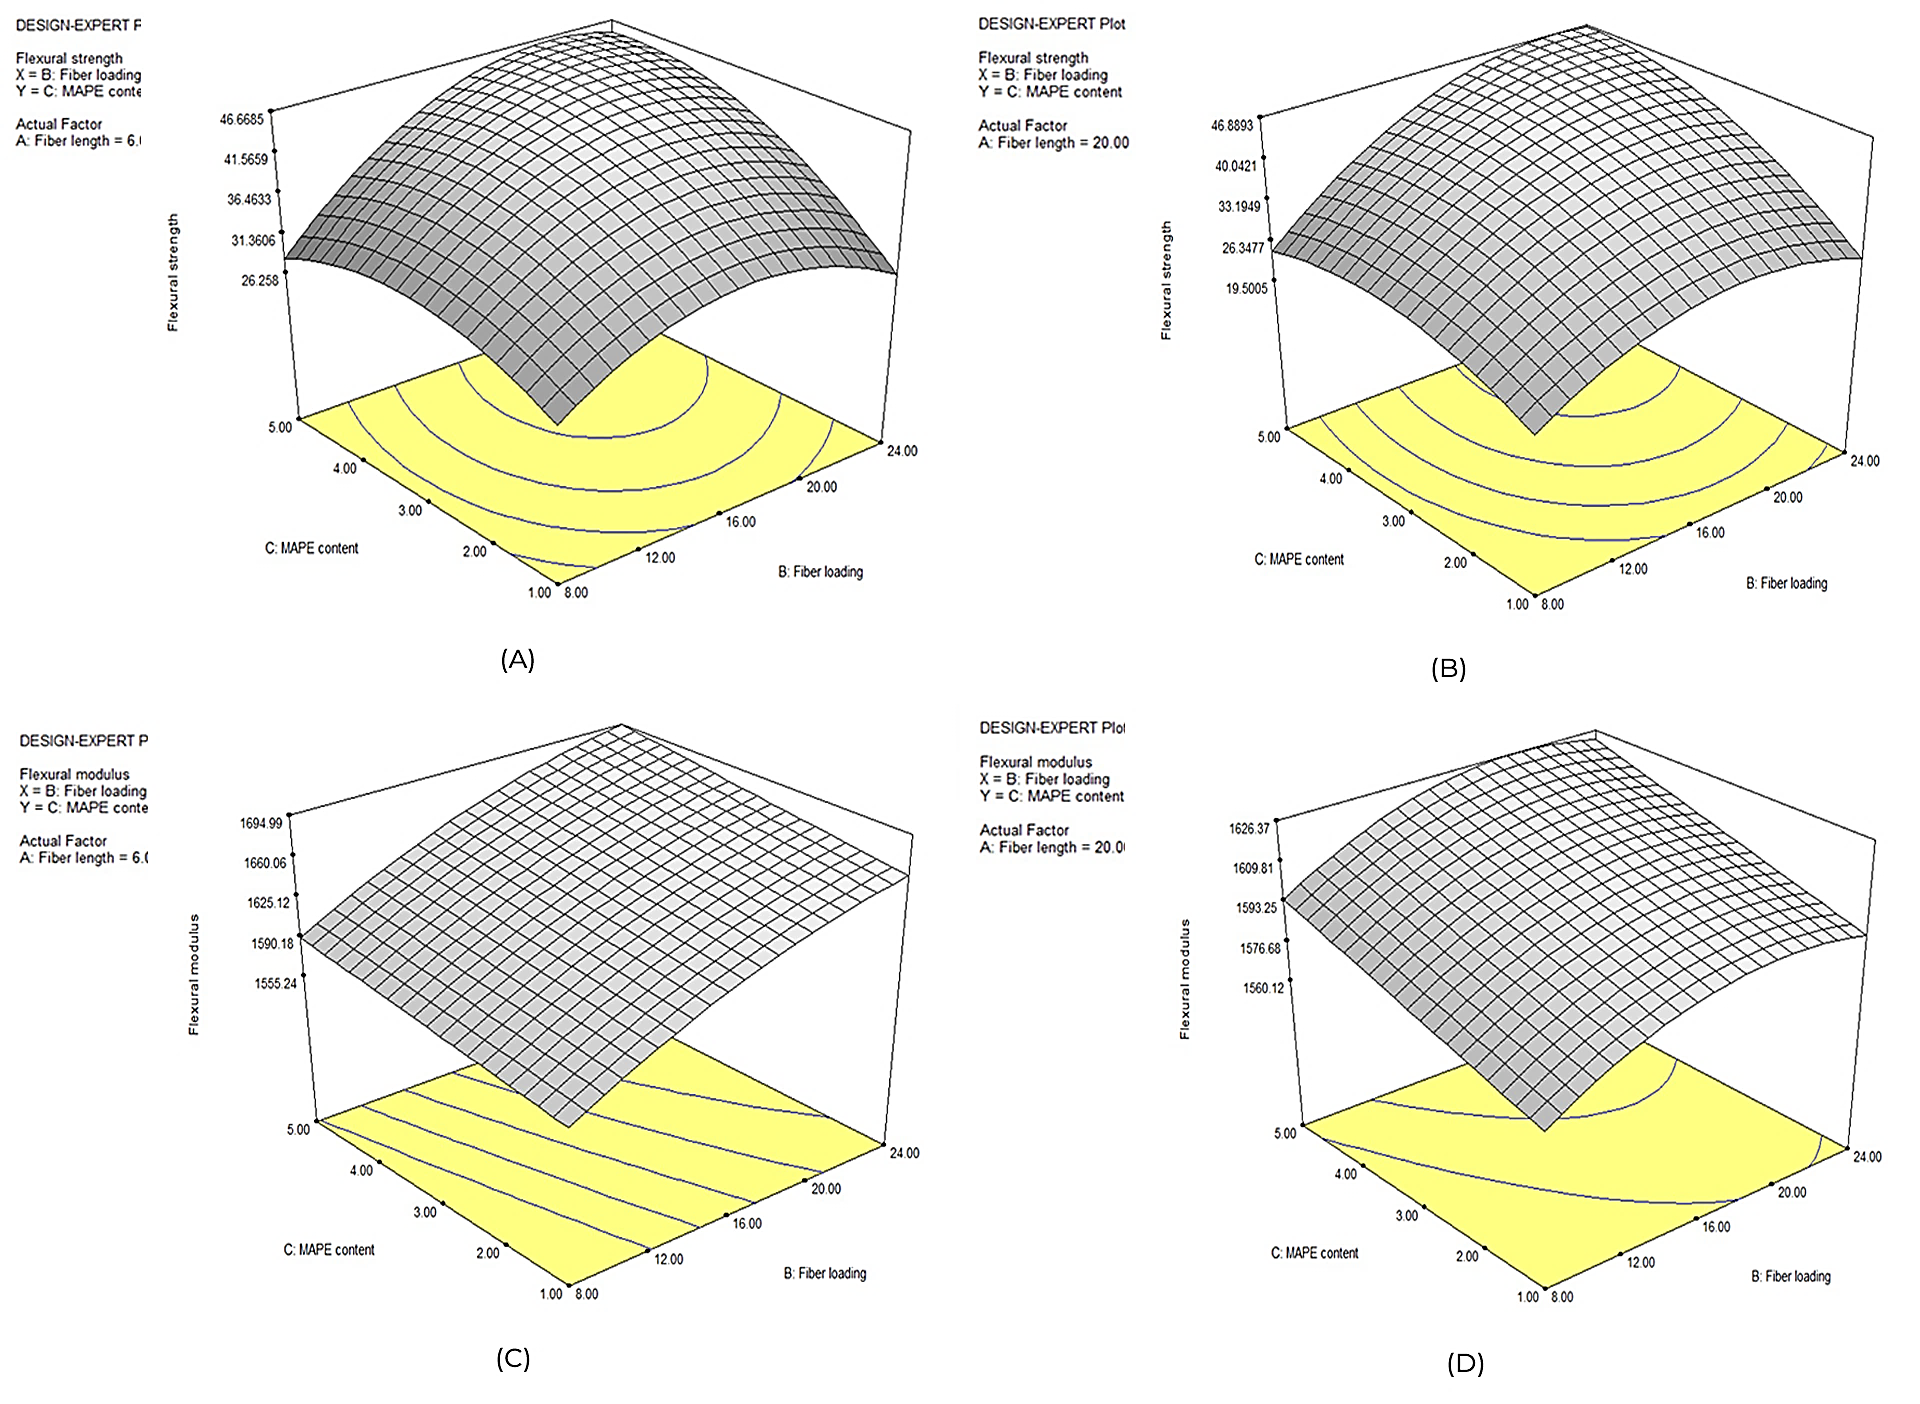
Figure 17 3D surface plots for the effect of fiber loading and MAPE on flexural strength (a) 6 mm fiber length, (b) 20 mm fiber length, and flexural modulus (c) 6 mm fiber length, (d) 20 mm fiber length.
Figure 18 illustrates the main effect plot of each individual parameter on flexural strength and modulus. It was observed that the fiber volume content has highest degree influence on the flexural behavior of developed composites. The addition of fibers beyond a limiting volume could not increase the strength of composite. However, the flexural modulus was increased progressively with the increase of fiber volume fraction. The fiber aspect ratio (length to diameter ratio) is a crucial parameter which dictates the reinforcing efficiency of fiber. The bending strength and stiffness were increased to maximum values and then decrease with the increase of fiber length. This kind of behavior was found in kenaf fiber-filled poly (butylene succinate) biocomposites (Thirmizir et al., 2011).

3.4. Effect of design parameters on impact strength of biocomposites
Figure 19 (a)-(b) illustrates the effect of fiber length and MAPE content on impact strength of biocomposites, keeping the fiber content was fixed at 8 and 24 wt.%. It was observed that the composite of higher aspect ratio (L/D) yields better impact toughness than the composite of low L/D ratio. Moreover, the low aspect ratio results in stress concentration and poor dispersion of fibers in HDPE matrix (Gamstedt et al., 2007). It is worth noted that the impact fracture strength of composites was decreased with the increase of compatibilizer content. This was attributed to the predominant action of fiber-fracture than the fiber pull-out.

In fiber composites having strong interfacial adhesion, fiber fracture is more common and dissipates lesser energy than the fiber pull-out (Wambua et al., 2003). The overall impact toughness of a fiber-reinforced composite (FRP) depends on the nature of the constituent elements, internal structure and geometry of the composite, fiber morphology, chemical composition, and interfacial adhesion between filler element and the matrix.
The interaction effect of fiber loading and MAPE content on impact strength of biocomposites is shown in Figure 20 (a)-(b). It was observed that the impact strength of composites was decreased with the increase of PALF content. This implies that the loading of PALF results in transition from ductile to brittle behavior. The important toughening mechanism in FRP is crack bridging by fibers associated with frictional sliding during fiber pull-out. It is worth noted that the composite shows poor mechanical strength at high fiber content (24 wt%)
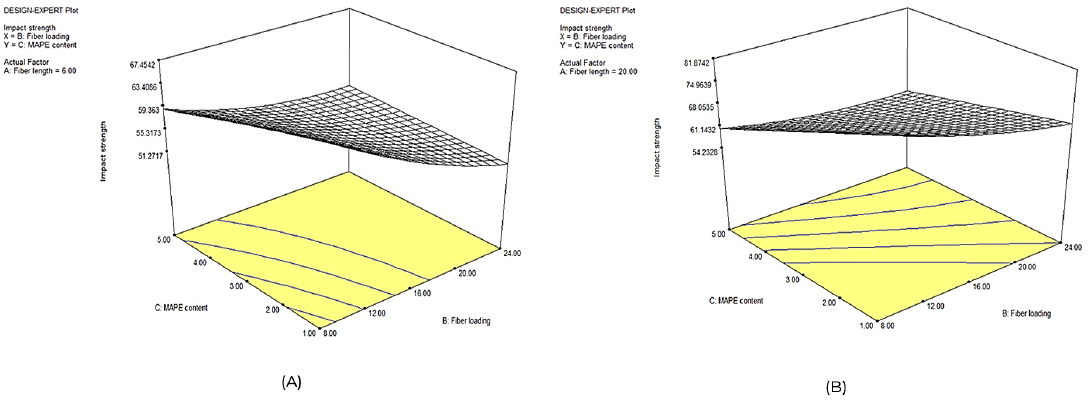
Figure 20 3D surface plots for the effect of fiber loading and MAPE on impact strength (a) 6 mm fiber length, (b) 20 mm fiber length.
The 1 wt.% MAPE compatibilized composite having 9% fiber content with 14 mm length exhibits maximum impact strength (Table 18).
The main effect plot of each individual parameter on impact strength of biocomposites is shown in Figure 21. The PALF content has highest degree of influence on impact strength. Moreover, the F value of fiber content (140.29) at 0.05 probability level confirms its highest significance on impact strength. The decrement in impact strength with increase of PALF content may be due to the agglomeration of fibers. Table 14 reported that the compatibilizer content is another crucial parameter with a significant F value (112.98). It was observed that the impact strength was decreased with the increase of MAPE content. The stronger interfacial adhesion results in the major occurrence of fiber fracture than that of fiber pull-out under loading condition.

3.5. Optimization of response variables
The numerical optimization method was employed to generate the optimal condition for each response variable. The goal was to maximize strength and modulus (Table 19); therefore, the target was set at highest value obtained from experimental results. The pre-defined goal, importance level, optimum and desirable values of each parameter are shown in Figures 22-23. To validate the Box-Behnken design model, a minimum of four samples were developed at the optimum condition of performance parameters. It was observed that the obtained experimental results (Table 20) are within a 5% difference from predicted values which proves the adequacy, reliability, and significance of current model.
Table 19 Optimization criteria and importance level
| Response | Lower value | Upper Value | Goal | Importance level |
| Tensile strength (MPa) | 19.75 | 32.63 | Maximize | ***** |
| Tensile modulus (MPa) | 1303.46 | 1482.94 | Maximize | ***** |
| Impact strength (J/m) | 51.81 | 72.29 | Maximize | ***** |
| Flexural strength (MPa) | 27.07 | 52.37 | Maximize | ***** |
| Flexural modulus (MPa) | 1576.28 | 1702.26 | Maximize | ***** |


Table 20 Experimental results at optimum values of performance parameters.
| Response | Test 1 | Test 2 | Test 3 | Test 4 | Mean |
| Tensile strength (MPa) | 33.15 | 32.06 | 33.86 | 31.98 | 33.04 |
| Tensile modulus (MPa) | 1472.62 | 1477.89 | 1471.05 | 1473.22 | 1475.27 |
| Flexural strength (MPa) | 48.64 | 46.69 | 48.31 | 48.96 | 50.21 |
| Flexural modulus (MPa) | 1654.71 | 1662.24 | 1660.07 | 1657.33 | 1660.58 |
| Impact strength (J/m) | 60.21 | 61.74 | 59.83 | 59.04 | 60.24 |
4. Conclusions
The primary objective of this work was to optimize the mechanical properties of biocomposites using Box-Behnken RSM technique. The effects of fiber length, fiber content, and compatibilizer load on mechanical properties of PALF/HDPE biocomposites as summarized below.
The quadratic model was suitable and showed reasonable agreement in correlation coefficients (R2, adj. R2, and pred. R2) for predicting the mechanical responses. Moreover, the verification of model fitness using statistical ANOVA technique confirmed its adequacy and reliability for navigating the design space.
The experimental and statistical results showed the significance of all three influential variables, i.e., fiber length, fiber loading, and MAPE content on tensile, flexural, and impact properties. Furthermore, the interaction of fiber loading and MAPE were highly related to the mechanical properties of biocomposites.
Based on final ANOVA results, the PALF loading had the greatest effect on modulus of rupture (MOR) and modulus of elasticity (MOE) of HDPE/PALF/MAPE biocomposites.
The most improvements of tensile and flexural properties (strength and modulus) were obtained in the medium levels of fiber length and high levels of fiber loading and MAPE content. However, the maximum impact strength was attained in low levels of fiber load and MAPE content and a medium level of fiber length. Under the synergistic combination of these optimal conditions; the tensile strength, tensile modulus, flexural strength, flexural modulus, and impact strength were predicted to be 32.35 MPa, 1475 MPa, 49.21 MPa, 1659.04 MPa, and 58.24 J/m, respectively.

