Introduction
The nuclear Overhauser effect (nOe) has long been used to determine molecular conformation, configuration and stereochemistry [1,2]. It is well known that intermolecular distances can be estimated from the cross relaxation rates between two spins, since this is proportional to the inverse of the sixth power of the internuclear distance (r-6) [3]. Cross-relaxation, which also depends on molecular motion, can be obtained by the build-up curve of the nOe as a function of mixing time. The related formalisms, as well as the corresponding methods have been described [1,3,4,5].
Due to the r-6 and motional dependence, the nOe quickly decreases with the distance for small molecules and it is generally accepted that a distance between 4 to 5 Å is the limit for the effect to be detected [1,2]. At very short correlation times the maximum achievable nOe enhancement is small in magnitude, because the dipole dipole relaxation mechanism is weak. Under normal conditions for nOe mixing time employed varies between 500-800ms and for ROE between 300-500ms, and long-range nOe, beyond 5 Å are not observable. Nevertheless, some cases have been described and some of these weak nOes were observed and used for structural purposes [6]. Since these signals can be quite relevant from the structural and conformational standpoint, it is important to rigorously establish their nature.
For large molecules, the motional dependence permits the detection of nOes at a longer distance [7]. Indeed, for the determination of the structure of proteins in solution, distance restrictions based on nOe intensities are a key step to perform the molecular optimization [8,9,10]. Similar approaches may be adapted for small and medium size molecules. Since this protocol is based on the correlation of known distances with their corresponding nOe intensities, it is extremely important to establish and document abnormal cases, such as that presented herein.
An artifact is a signal that does not have any physicochemical sense. It is a factor that affects the correct interpretation of a result. In NMR, an artifact is a senseless signal that can be originated by several factors such as the manipulation of a sample, the uncertainty of a determination, and the manipulation or transformation of the spectra. It can also be originated by electronical issues with the instruments used to make the determination. Artifacts are characterized by their variability and inconsistent reproducibility. Depending on the sample, artifacts can be intensified or disappear in different regions of the spectrum or show multiplicities that cannot be interpreted.
From the chemical perspective, the presence of double bonds in remote position in quinones has a remarkable influence in their structure and reactivity properties. For instance, in perezone [11], the first natural product isolated and described in America by Leopoldo Rio de la Loza in 1852 [12], (1a, Fig. 1) the double bond in remote position influences the formation of β (2a) and α - pipitzol (2b) (Fig. 2). Calculations at the MP2/6-31G(d,p) and MP2/6-31++G(d,p)//MP2/6-31G(d,p) levels determined that folded conformers (1b and 1c) are minima in the potential energy surface (PES) and that the inclusion of electronic correlation is fundamental to correctly represent this system. In fact, when using HF and B3LYP theoretical methods, unable to include large distance interaction terms, the folded conformers (1b and 1c) turned out to be less stable than the extended ones (such as 1a or 1d). The existence of conformers depends on the level of theory.
The presence of folded structures has been commonly used as argument to describe relevant properties of similar quinones, such as the series of ubiquinones Q1-Q10 [13]. This study addresses perezone and some of its derivatives in order to determine if the observed signals can have analytical relevance or not; and, if relevant, further advance the understanding of their origin.
Results and Discussion
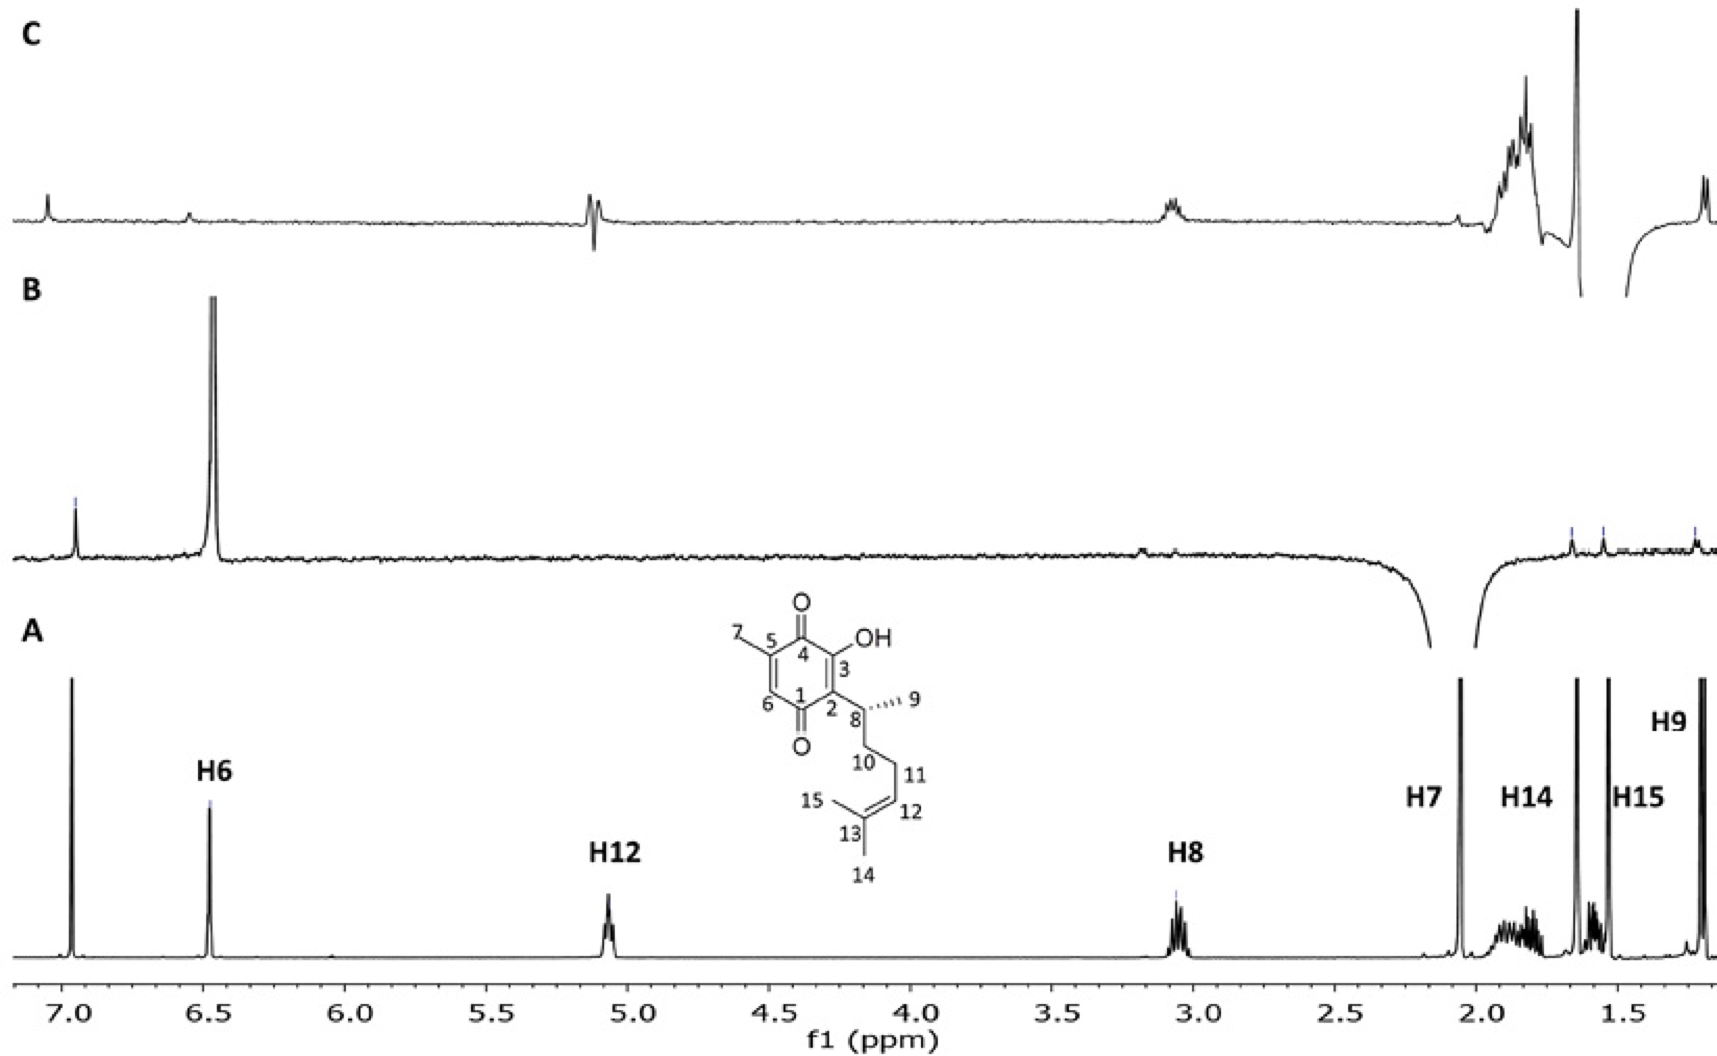
Initially, the double-pulsed field gradient nOe pulse sequence (DPFGSE-NOE) was used since this is the most widely used selective nOe experiment [14]. For this case, samples were analyzed in a 500 MHz spectrometer at 25°C in a chloroform solution, using 800ms as the mixing time value and D1 = 1s (Fig. 3). These are the parameters included in the commercial software and are designed to observe the signals of interest under the conditions normally used for this type of analysis. When the signal for methyl H7 attached to the quinone was irradiated (B, Fig. 3) a normal H6 nOe effect (1.01 %) is observed along with the weak signals of methyls H14 (0.02%) and H15 (0.02%), of the isopropylene group. These signals are easily distinguished (ratio signal:noise = 4). This warrants the presence of the folded conformer. The observation of signals H8 (0.02%) and H9 (0.03%), located at a distance of more than 6 Å is also relevant. However, questions arise since the irradiated area is broad and includes the signals of H10 and H11, thus, the latter can be considered normal nOes. It is pertinent to note that the nOes measured in this work are relative to the signal that is irradiated. The magnitude of this reference signal is enormous. In this context, the signal corresponding to the vicinal nOe is 1%, which is small. However, the signal-to-noise ratio of the smallest signals presented in this work is at least 2 and reaches up to 5.

Fig. 3 (A) 500MHz 1H spectrum of perezone (1) in CDCl3; (B-C) 1D-DPFGSE-NOE spectra using a mixing time of 800ms, nt = 4096, D1 = 1s (B) selective inversion of H7, (C) selective inversion of H15.
Interestingly, the irradiation on the methyl group H15 resonance (C, Fig. 3) allowed the observation of nOes on H6 and H7 (0.02%), as well as a trivial nOe at its neighbor H14 (1.01%) and H12 (0.06%). Additional nOes were observed at H8, H9, and with the OH moiety. These effects may be easily explained by the torsion of the alkyl chain. The intense nOes with diasterotopic protons H10 and H11 are also trivial.
It is important to point out that the coupling constants experienced by each of the protons involved are observed in the nOe difference spectrum. These constants are measurable from the spectra. For example, for hydrogen H9 in the normal spectrum a value of 3JH-H = 7.0 Hz is obtained, and in the nOe spectrum it is of 7.0 Hz.
Due to the flatness and rigidity of the quinone ring, the atoms that produce these small nOes are far in space; outside the generally accepted limits for nOe observation.
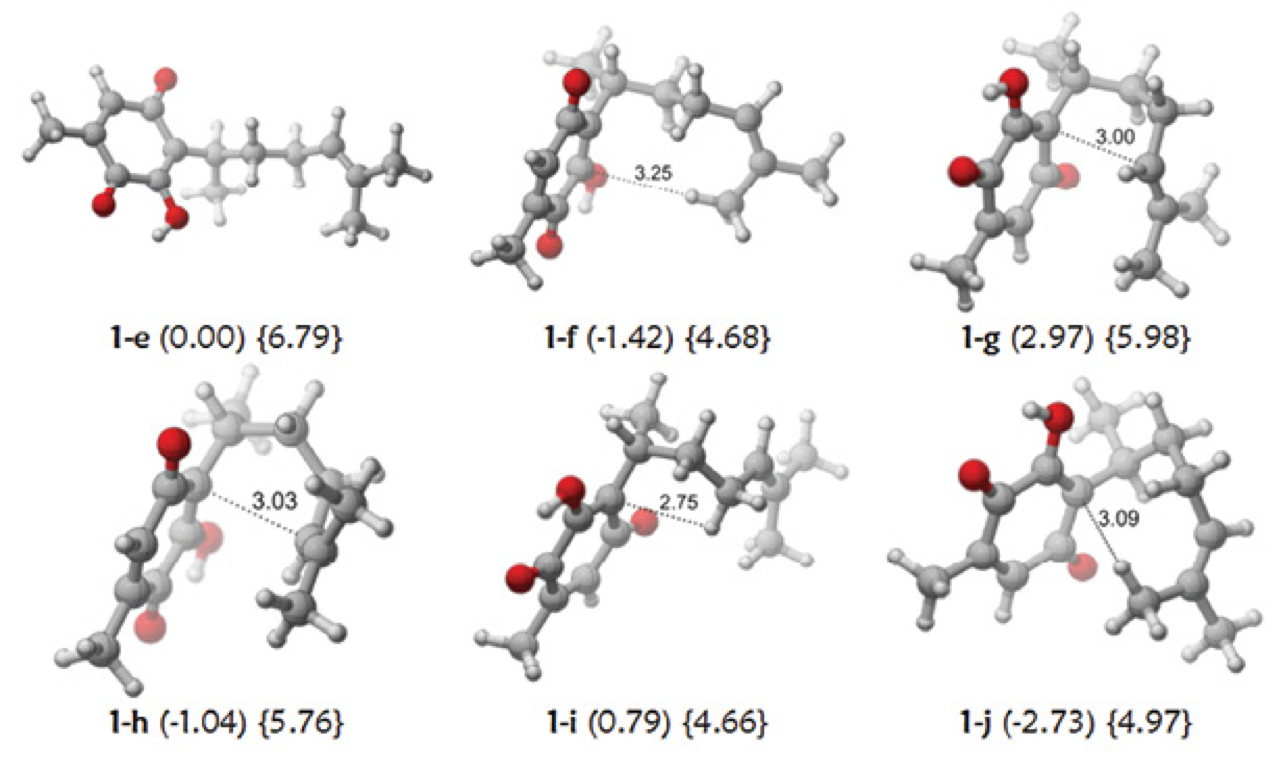
Considering the molecular geometries determined at M06-2X/6-31++G(d,p) level of theory (Fig. 4), the closest interatomic distances vary with the relative orientation of the alkyl chain and oscillate between 6.6 and 6.7 Å for the protons of methyl C7 and the proton of methine C8, and between 5.7 and 6.9 for the protons joined to methyl C7-methyl C9. The relative stability of the folded conformers is remarkable as determined at the MP2/6-31(d,p) level [11].

Fig. 4 Some conformers of Perezone (1) at the M06-2X/6-31++G(d,p) level. The relative stabilities are presented in parentheses (kcal/mol) and the hydrodynamic radii in brackets (Å).
For the OH/H6 and OH/H7 nOes, the distances between the protons involved are between 4.6 and 4.7 Å, when the OH forms a hydrogen bond with the carbonyl group, at the upper limit for nOe observation. The detection of several “non-typical” nOes for proton pairs well beyond these distances requires further investigation.
Fig. 5 shows the obtained nOes using a different pulse sequence (selnogp5.cga) at 20°C in an instrument of 700 MHz [15], the concentration was decreased to 0.02M to preclude the presence (if any) of significant dimer formation. Even at this low concentration, clear nOes between remote protons were observed, similar to those observed at the higher concentration (0.08M). For instance, when the position H7 was irradiated, weak nOe´s with H14 and H15 (0.1 and 0.09%), associated with the presence of folded conformers were measured. Besides trivial contacts, additional nOes were observed at H6 (0.84%) and the OH group (0.14%). Interestingly, these small signals do not change with the shift in concentration and are maintained with different samples. There are no changes with neither the chemical shift nor the multiplicity and there is no change when different instruments with different frequencies are used. Thus, it is considered that these signals do not seem to be artifacts.

Fig. 5 (A) Conventional 700-MHz 1H spectrum of Perezone (1) in CDCl3; (B-C) 1D selnogp5.cga spectra using a nOe mixing time of 800ms, selective inversion of: (B) H7, (C) H14.
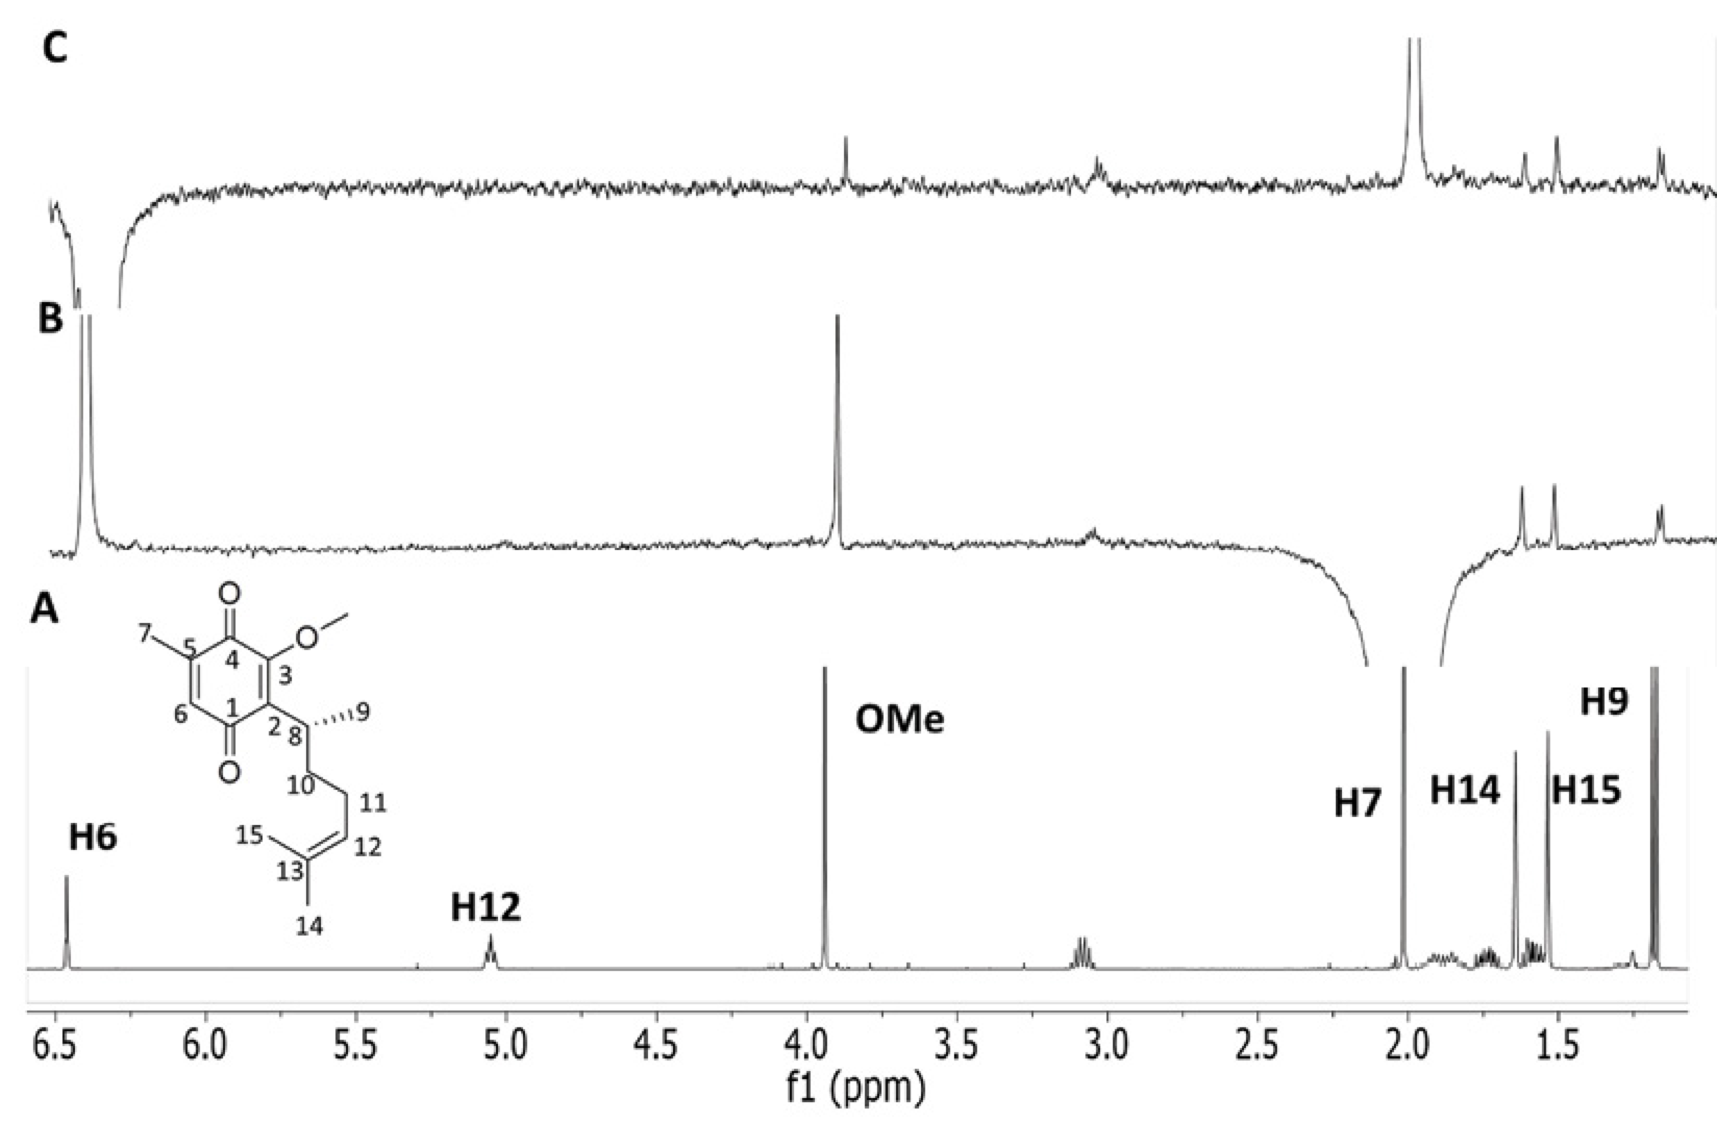
A summary of the results for O-methylperezone (3) is shown on Fig. 6. The presence of folded conformers in the conformational equilibrium was also conclusively revealed from the observed nOes. Interestingly, the absence of the OH group should decrease the polarization of the quinone’s carbonyl group and thus, its ability to accept charge from the olefin in the folded conformers [16].

Fig. 6 (A) Conventional 500-MHz 1H spectrum of O-methylperezone (3) in CDCl3; (B-C) 1D DPFGSE-NOE spectra using a nOe mixing time of 800 ms, selective inversion of (B) H7 and (C) H6.
For instance, when H7 is irradiated (B, Fig. 6) weak nOes with H14 and H15 methyl groups were observed. When H6 was irradiated , (C, Fig. 6), nOes were detected at H14 and H15, further confirming the presence of folded conformers. Even more, nOes at H8, H9 and the methyl group were also evident.
Additional experiments were performed in different solvents of different nature, DMSO-d6 and acetonitrile-d3. Therefore, regardless the solvent’s polarity and viscosity, the folded conformers participate in the conformational equilibrium. Interestingly, nOe’s for distant protons, at distances longer than 6 Å, are clearly observed (Fig. 7).
Intra or inter-molecular nOe.
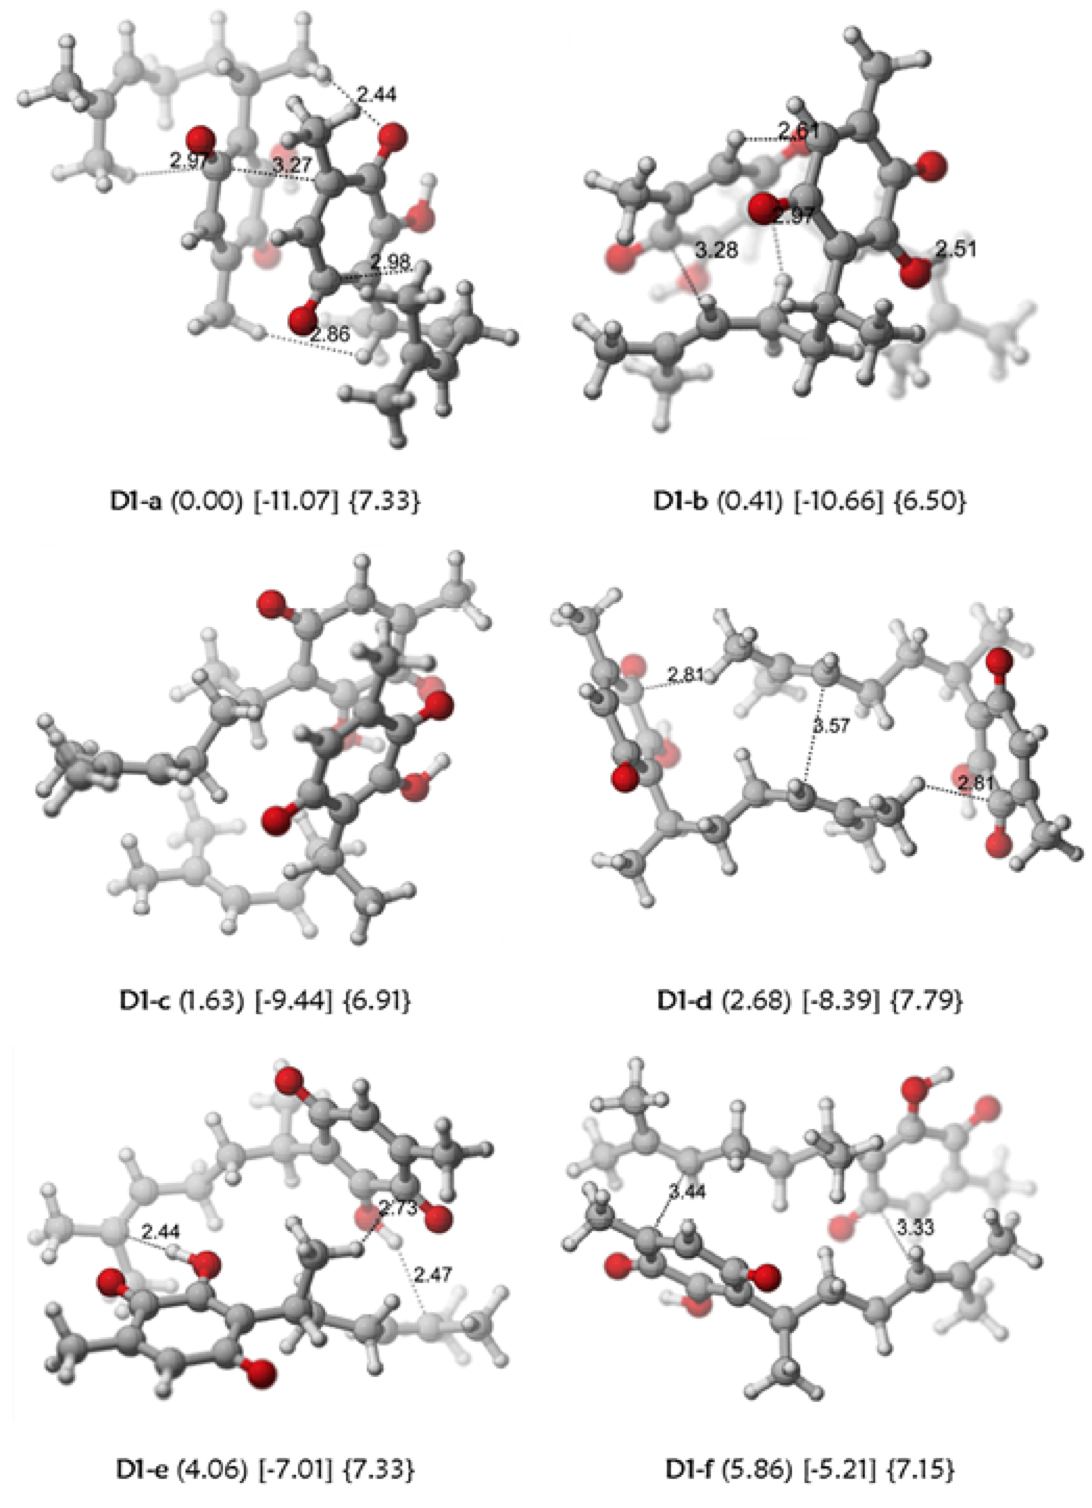
A plausible explanation could be the presence of intermolecular nOes through the formation of dimer structures. Several putative arrangements (Fig. 8) were considered that produce different interaction energies. The most stable arrangement combines double bond-quinone and quinone-quinone interactions; while the least stable exclusively incorporates double bond-quinone interactions. The hydrodynamic radius of the dimers varied between 6.5 and 7.8 Å. The putative existence of a perezone dimer in solution (Table 1) could account for the existence of the observed nOe.

Fig. 8 Some dimeric arrangements of perezone (1). The relative stabilities are presented in parentheses, interaction energies in brackets (kcal/mol) and the hydrodynamic radii in braces (Å), calculated at M06-2X/6-31++G(d,p) level of theory.
Table 1 Relevant inter-atomic distances (Å) for the two dimeric arrangements D1-b and D1-f of interacting Perezone molecules (Figure 8) at M06-2X/6-31++G(d,p) level of theory. The relevant intra and inter molecule and ensemble average <r6> proton-proton distances were estimated from the integration of the observed nOe´s (measured in selective nOe experiments with mixing times of 600, 800 and 1000 ms) using the ISPA approximation.
From inspection of Table 1, there is a reasonable agreement between the predicted intermolecular distances for the putative dimers and the magnitude of the observed nOe.
The possibility of dimer formation was further explored by measuring the diffusion coefficient of the species. DOSY experiments have been extremely useful to verify the formation of ligand-receptor or molecule/molecule complexes, since the diffusion coefficients of the involved species are altered as consequence of the formation of the complex [17]. TMS was employed as internal reference, with a hydrodynamic radii (HR) of 2.48 Å. (Table 2).
Table 2 Diffusion coefficient of perezone (1), O-methylperezone (3), thymoquinone (4), p-cymene (5) and a synthetic intermediate of perezone (6) determined by DOSY. Calculations were done at M06-2X/6-31++G(d,p) level of theory using continuum salvation model (SMD) with acetonitrile as a solvent.
At the M06-2X/6-31++G(d,p) level of theory, TMS displays a hydrodynamic radius of 2.48 Å [18] in full agreement with Berger´s value [17] Then, the effective hydrodynamic radius of the different molecules under study was estimated. The values of the diffusion coefficient in DMSO-d6 were, in all cases, lower than those determined in cyclohexane-d12, indicating a higher level of solvent-solute interactions (hydrogen bonds) in the first solvent. (Table 2).
The experimental HR of p-cymene (5, Fig. 9) in cyclohexane is 2.85 Å, while in DMSO is 3.06 Å (ΔHR = 0.21 Å). The theoretical calculation predicts a larger size in the vapor phase, of 4.25 Å, possibly originated from the effect of the condensed phase. Herein, the space generated by the HR is fully filled by a single solute molecule. This value can be considered as reference for the case of a solvated isolated molecule. In thymoquinone (4, Fig. 9), a similar pattern was observed. In DMSO, the association is larger than in cyclohexane (HR values are 3.45 and 3.23, respectively, with ΔHR = 0.22 Å in the second). The value of HR is similar to that theoretically calculated for compound 5. These numbers suggest that this molecule is not associated, but individually solvated.
Compound 6 (Fig. 9), similar to p-cymene (5), is unable to self-associate with another molecule or to produce folded arrangements because of double bond-aromatic interactions. Therefore, it is expected that the extended conformation should be dominant. In fact, the difference between the HR as a function of solvent (ΔHR = 0.30 Å) is larger than in the previous cases. The calculated HR value only allows including a single molecule in the associated space.
For perezone (1), the difference between the HR value in both solvents is largely increased (ΔHR = 1.33 Å). This is a proof of hydrogen bond formation in DMSO. In this solvent, HR is 5.67 Å, larger than the value for 6, the reference for extended conformers. On the other hand, the value of HR of 1 in cyclohexane is 4.34 Å, smaller than the value of 6. This fact suggests that folded conformers significantly participate in the conformacional equilibrium. The HR calculated for some perezone conformers (1) are shown in Fig. 4, ranging from 6.8 Å to 4.7 Å for the extended and folded conformers. These numbers strongly suggest that only a single molecule occupies the available space associated by the HR.
Finally, for O-Methylperezone (3), the HR in DMSO is lower than that measured for 1, as expected by the lack of solvent association through hydrogen bond. Again, a single molecule fits to the experimental HR.
The DOSY results preclude the presence of a noticeable amount of dimer entities. The experimental HRs are in very good agreement with the existence of a major presence of one single molecule of solute, associated or not to the solvent, depending on its chemical nature. Therefore, the observed nOes mainly arise from intramolecular interactions and take place at proton-proton distances even above 7 Å.
Conclusions
Real small nOe´s or artifacts? In this case the relevant sources for artifacts are, spin diffusion, subtraction artifacts and accidental irradiation of close signals. According to the results here presented, these factor are not relevant for our observations. nOe´s between hydrogen atoms located at distances longer than 6 Å have been observed for a variety of small molecules with a common quinone-like framework. The nOe signals under study do not suffer changes when the concentration is modified and are maintained using different samples. Also, the signals do not change with neither the chemical shift nor the multiplicity and are not affected by the use of different instruments at different frequencies and temperatures. The change of solvents and mixing times do not alter the small nOe observed, although some changes in intensities were observed.
Although there was a distinct possibility that the observed nOes could be originated by the formation of dimers, the presence of association in large extent was discarded by dilution experiments and by using DOSY experiments.
From the structural perspective, our results confirm the existence of folded conformers for perezone in contrast with previous reports using NMR data and vibrational circular dichroism [19,20].
The information presented in this study is relevant for structural analysis, although care should be taken when directly interpreting the observed nOes for certain types of molecules without a quantitative analysis. This is an important finding with impact on the determination of conformation for molecules of this size and warrants further study on other systems.
Although the signals of interest are very small, of the order of 1% of a normal nOe, so a priori are considered artifacts originated by decoupling modulation, they maintain, properties that make them interesting and give them coherence as interpretable signals.
Experimental Section
NOESY 1D experiments were done using a recycle delay of 1s, acquisition time 2s and the number of transients 2048 for concentrated samples and 6144 for diluted samples. Most of the NOESY 1D experiments were performed at 298 K on a VNMRS 500 MHz spectrometer equipped with ID-PFG 5mm probe with z-gradient accessory. Selective 1D NOE spectra were recorded using the DPFGSE technique using the Varian standard pulse sequence NOESY 1D included in the manufacturer’s software. A standard Gaussian shaped pulse was used for the excitation pulse. The operating software automatically calculated the length and power of the pulse based on the peak integration area of the signal that was irradiated. For dilute solutions (5mg of perezone dissolved in 0.75 ml of solvent) the number of transients was about 6144 and for concentrated samples (25mg of perezone dissolved in 0.75 ml of solvent) was about 2048.
The selnogp5.cga experiments were performed at 293 K on a Brucker Avance IIIHD 700MHz spectrometer equipped with a BBI 5mm probe with z-gradient accessory. Selective 1D nOe spectra were recording using the Brucker standart pulse sequence selnogp5.cga provided by manufacturer´s software. Experiments were done using a recycle delay of 2s, acquisition time 4s and the number of transients 3072 for degassed samples 0.02M.
Synthetic procedures
Perezone (1) (2-(1,5-dimethyl-4-hexenyl)-3-hydroxy-5-methyl-1,4-benzoquinone) was isolated as is described [11] obtaining golden-yellow leaflets, mp 104-106 °C.
Synthesis of 2-(1,5-dimethyl-4-hexenyl)-3-methoxy-5-methyl-1, 4-benzoquinone (3).
To a solution of 1.9g (0.023mol) of perezone in 70ml of acetone was added 5.35g (0.115mol) of potassium carbonate and 1.84ml (0.05mol) of dimethyl sulfate. The reaction was stirred for 3 h followed by addition of water and extracted with CH2Cl2. The organic phase was washed with water and brine and evaporated under vacuum. The residue was purified by chromatography (SiO2, 90:10 hex-AcOEt) afforded a yellow oil (yield 96%). 1H NMR (500MHz, CDCl3, 25°C, TMS) δ 1.16 (d, 3J=7.2Hz, 3H, H9), 1.53 (3H, s, H15), 1.57, 1.73 (2H, m, H10), 1.64 (3H, s, H14), 1.8 (2H, m, H11), 2.0 (3H, d, 3J=1.5Hz, H7), 3.09 (1H, m, H8), 3.94 (3H, s, OMe), 5.06 (1H, m, H12), 6.5 (1H, q, H5). 13C NMR (CDCl3, 125MHz) δ 188 (C4), 184.2 (C1), 156.3 (C2), 143.3 (C6), 136.8 (C3), 133.7 (C5), 131.5 (C13), 124.4 (C12), 60.8 (OMe), 34.7 (C10), 29.7 (C8), 26.7 (C11), 25.6 (C14), 18.9 (C9), 17.6 (C15), 15.1 (C7). MS (EI) m/z 262, 247, 219, 181, 166, 69. IR (cm-1) 2963, 2930, 2858, 1654, 1599. HRMS (ESI) calcd for C16H23O3 [M+H]+; 263.16472, found 263.16510.
Synthesis of 2-(3´,7´-dimethyl-6´-octenyl)-5-methyl-3,4-methylenedioxy anisole (6).
n-butyllithium (3.75 ml of 1.6M solution in hexane) was added to a cold (0°C) solution of 5-methyl -3,4-(methylenedioxy) anisole (0.35g, 2.14mmol) in dry THF (10ml) [21]. The reaction mixture was stirred at 0°C for 10min and then at room temperatura for 4 h. the mixture was cooled again to 0°C and 1-bromo-3,7-dimethyl-6-octene (0.5g, 2.3mmol) was added dropwise [22]. The reaction was quenched with NH4Cl and extracted with CH2Cl2 (x3). The organic phase was washed with water and brine and evaporated under vacuum. The residue was purified by chromatography (SiO2, 90:10 hex-AcOEt) afforded a yellow oil (yield 54%). 1H NMR (500MHz, CDCl3, 25°C, TMS) δ 0.93 (3H, d, 3J = 10Hz, H4´), 1.18 (2H, m, H5´), 1.18 (2H, m, H5´), 1.39 (3H, m, H2´,H3´), 1.6 (3H, s, H10´), 1.68 (3H, s, H9´), 1.98 (2H, m, H6´), 2.19 (3H, s, H7), 2.53 (2H, m, H1´), 3.74 (3H, s, OMe), 5.11 (1H, t, 3J = 15Hz, H7´), 5.87 (2H, s, OCH2O), 6.11 (1H, s, H6). 13C NMR (CDCl3, 125MHz) δ14.79 (C7), 17.58 (C10´), 19.49 (C4´), 22.26 (C9´), 25.5 (C1´), 25.7 (C6´), 32.48 (C3´), 36.14 (C2´), 36.82 (C5´), 56.28 (OMe), 100.49 (OCH2O), 104.68 (C6), 112.03 (C2), 114.95 (C5), 125.14 (C7´), 130.85 (C8´), 139.37 (C4), 145.81 (C3), 153.0 (C1). IR (cm-1) 1211, 1427, 1460, 1492, 1656, 2868, 2924, 2956. EM (E.I) m/z 304, 219, 179, 166. HRMS (ESI) Calcd For C19H29O3 [M+H]+ 305.21167, found 305.21075.


 nueva página del texto (beta)


