


 nueva página del texto (beta)
 Inglés (pdf)
 Artículo en XML
 Referencias del artículo
 Enviar artículo por email
 Citado por SciELO
  Similares en
SciELO
Similares en
SciELO 
 Permalink
Introduction
Camera trapping is considered an efficient tool for monitoring species due to its non-invasive nature, which allows the detection of species with elusive behavior or low population density (Kucera & Barrett, 2011; O’Connell et al., 2011). They are also considered helpful monitoring tools for evaluating species diversity and studying population trends since they can collect large amounts of information within a short period of time and require limited use of human resources (O’Brien et al., 2003; Rovero et al., 2013). Another advantage of camera traps is that they record accurate data that is not biased by the presence of the researcher and can be reviewed by other researchers (Burton et al., 2015).
Camera traps are certainly not the panacea for surveying all animal groups in all habitats (Dodino et al., 2018; Driessen et al., 2017; Kim et al., 2022; Puffer et al., 2021). They were initially designed to detect relatively large target species from the northern hemisphere, e.g., ungulates and medium to large-sized predators, that are hunting targets (Meek & Pittet, 2012). However, small mammals are usually under-recorded in grasslands (Pirie et al., 2016), and capture rates vary according to the micro-habitat where they are set (Fiderer et al., 2019). It is common for cameras to misfire because of shadeless and tall grasses surrounding trap sites, and occasionally the lack of trees acting as camera substrates is a limitation in grasslands (Swanson et al., 2015). Although most of the camera trapping studies focus on medium to large mammal species, this technique has also been implemented on non-target species, such as ground-dwelling birds (Burton et al., 2015; Davis et al., 2011; Delisle et al., 2021; McLean et al., 2017; O’Brien et al., 2003; Ortmann & Johnson, 2021; Puffer et al., 2021). In this sense, the use of camera traps for monitoring grassland birds has been poorly reported, especially in Neotropical grasslands where they have mostly been used for detecting nest predators (Browne et al., 2021; Trofino-Falasco et al., 2022).
The Tandilia Mountains harbour the last highland grassland remnants of the Pampas ecoregion, which act as a refuge for biodiversity, including several endemic species (Herrera et al., 2019; Martínez-Aguirre et al., 2021; Vera et al., 2021). The Pampas ecoregion, one of the most extensive grasslands in the world, has been almost entirely replaced by agriculture and forestry (Herrera et al., 2019; Isacch et al., 2016; Nanni et al., 2020). These land use changes, combined with other threats such as the increase in fire regimes, urbanization, and unsustainable grazing in natural grasslands, have resulted in habitat fragmentation and loss and population decline of grassland species, especially birds and large carnivores (Azpiroz et al., 2012; Bilenca & Miñarro, 2004; Medan et al., 2011). Although the Tandilia Mountains are considered a Valuable Grassland Area for South America (D. Bilenca & Miñarro, 2004), less than 1% of these grasslands are under protected areas, and few studies have been conducted to gain ecological information regarding bird and mammal communities (Trofino-Falasco et al., 2022; Velasco et al., 2013). Given the urgent need to identify key conservation sites, camera traps could be an option to conduct rapid surveys in these groups. However, the efficiency of this tool has not been tested for these species in this habitat.
The main goal of this work is to assess the usage of camera traps as a monitoring tool for grassland birds and mammal species in the Tandilia Mountains. The specific objectives are: 1) to assess the naïve occupancy in sampling sites, the relative abundance, and the time required to detect the species, 2) to evaluate the sampling efficiency of camera traps to detect the species richness, and 3) to describe the sampling effort (sampling sites, trap days and records) to detect grassland species in the Tandilia Mountains. This work provides a guideline for future research about monitoring bird and mammal species with camera trapping in temperate Neotropical grassland.
Materials and methods
The Tandilia Mountains are located in the Southern Pampas ecoregion of South America, emerging along 350 km and covering 12.314 km2 (Dalla-Salda et al., 2006). The predominant native vegetation persists within several highland grassland remnants composed of grass steppe, dominated by Stipa genus, shrubs, and ferns (Cabrera, 1971; De la Sota, 1967; Valicenti et al., 2010). Approximately 90% of the study area is cultivated by annual crops and perennial pastures, but due to steep slopes, shallow soils, and exposed bedrock, the surviving highland grassland remnants have not yet been transformed into land used for agriculture or forestry, representing less than 10% of the original ecosystem (Herrera et al., 2017).
We conducted long-term monitoring through the deployment of 192 camera trap stations (sites) for an average trap period of 2 weeks in 27 Tandilia grassland remnants (Fig. 1), encompassing all seasons from August 2016 to September 2021. The minimum distance between camera trap stations within a grassland remnant that remained active during the same period was 250 m (Parsons et al., 2019; Pyšková et al., 2018). Camera traps were attached to iron stakes, shrubs, and cattle fencing posts approximately 0.3-0.5 m above the ground, depending on terrain. To detect nocturnal and diurnal species, we programmed cameras to operate in continuous mode (24 h), taking photos and videos in every detection event. We programmed cameras with a minimum latency time of 1 minute between detections. The detection of more than 1 individual of the same species captured within a 30-minute period in a single camera was assumed to be the same individual and, therefore, was not considered an independent event (Kelly & Holub, 2008; Lombardi et al., 2022). We checked cameras every 7-10 days to download photographs, replace batteries and ensure that cameras were operational. We used low-cost camera models, 5210A LTL-Acorn (LTL-Acorn®) and P8B20 Nano 8 (WildGame Innovations®).
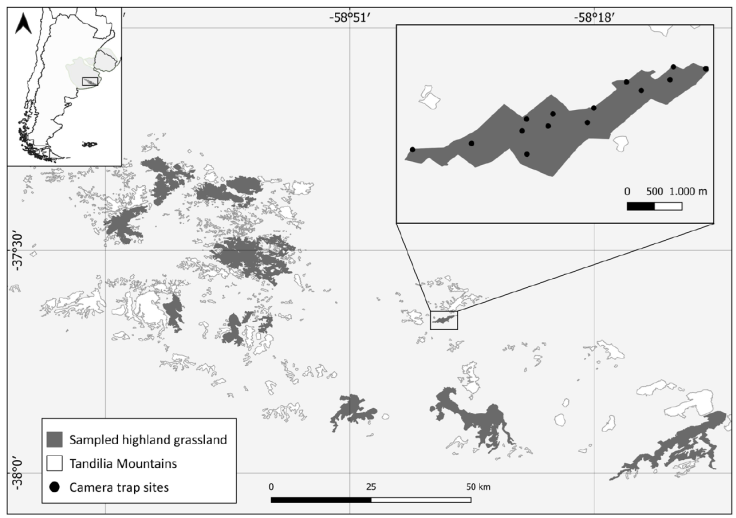
Figure 1 Camera trapping sampled and non-sampled highland grassland remnants in the Tandilia Mountain range, Pampas ecoregion of Neotropics (light grey).
We calculated the naïve occupancy as a ratio of the number of sampling sites (i.e., camera trap stations) where the species was detected to the total number of sampled sites. We used the capture rate as a relative abundance index for each species and calculated it as the number of independent events (i.e., captures) over the sampling effort (i.e., camera trap days) multiplied by 100 (Carbone et al., 2001; Cravino & Brazeiro, 2021). We calculated the time to the first detection by identifying the number of trap days it took to obtain the first record of the focal species at each sampled site where the species was detected (Tourani et al., 2020).
We compared the camera trapping richness with the richness reported in online databases to assess potential bird and mammal richness and their detection frequencies in the Tandilia Mountains. We analyzed data from 2 open-access databases: eBird (http://www.ebird.org) and the Global Biodiversity Information Facility (GBIF, http://www.gbif.org).
Both databases have a robust review process, are focused on ensuring the correct location and species identification that is conducted before data enters the dataset and have the potential to make informed comparisons of species diversity throughout space and time (Callaghan et al., 2022; Johnston et al., 2021; Telenius, 2011). GBIF collects data from different sources such as museums, surveys, and other databases (including eBird) and stores data in an online platform (Beck et al., 2014). The GBIF information covers any chosen systematic level, collector/observer, date of collection or observation, and in many cases, a geospatial reference (Telenius, 2011). In both databases, we applied a geographical polygon filter (i.e., the Tandilia Mountain range), and we compiled a list containing all bird (GBIF, 2022a) and mammal (GBIF, 2022b) species that were reported within the Tandilia Mountain range polygon over the last decade.
In the case of eBird, we only considered complete checklists (i.e., observers report all the species they detect and identify during a single birdwatching event). From the compiled eBird checklists and based on Azpiroz et al. (2012) as well as, our observations, we selected a subset of bird species that use grasslands (Supplementary material: Table S1). We calculated: the percentage of bird species from the compiled eBird list, which are associated with the highland grassland, and the proportion of grassland species that were detected with camera traps. Finally, we compared the detection frequency provided by eBird (i.e., the number of checklists in which a species was detected divided by the total checklists) with camera trap detection frequency (i.e., naïve occupancy). Since both camera trap stations and checklists are suitable sampling units, we assumed that each camera acts as a complete checklist.
In the case of mammal species, we used georeferenced GBIF records with collection date information, excluding fossils reports. We calculated the species reported frequency from the GBIF database as the number of species records divided by the total mammal records. From our observations, we estimated the capture detection frequency as the number of independent records of each species divided by the total mammal captures.
To evaluate the efficiency of camera traps in detecting grassland species, we built 4 species lists ordering them based on their detection frequency (highest to lowest). We developed 2 lists of species from camera trap detections (1 for birds and 1 for mammals) and 2 lists from database detections (eBird and GBIF). Then, we compared the top 10 most detected species within each list.
To estimate the number of sampling sites necessary to detect bird and mammal species richness, we used a subset of camera traps that were active for at least 20 days. We performed species accumulation curves for 3 sampling lengths: 1, 2, and 3 weeks. We also performed species accumulation curves for 2 species groups: nesting grassland birds and carnivores. These species groups are commonly used in many bird and mammal research and provide good information regarding their ecological role in grassland ecosystems (Caruso et al., 2020; Winter & Faaborg, 1999). We analyzed species richness as a function of effort measured as the number of trap days and capture records. Reported values are mean ± standard error (range). We performed species accumulation curves using the R package Vegan (Oksanen, 2017).
Research for this study was conducted with animal ethics approval from the National University of the Centre of the Buenos Aires Province Animals Ethics Committee (Exp. 08/2020; Exp. 09/2020).
Results
The 192 sampling sites represented a total effort of 3,719 camera trap days, obtaining 6,008 recorded events of birds and mammals. The mean effort per camera/site was 19.4 days (range = 1.2-55.8 days). The 27 sampled grassland remnants covered a total area of 41,385 ha. Less than 6% of the deployed cameras failed during the study period (n = 11 cameras), functioning only for an average of 4.9 days (range = 1.2-7.7 days). The leading causes of failure were the knocking down of cameras by cattle (45.5% of the failures), followed by battery exhaustion or a full memory card (36.4%), and chewed electrical circuits by a plains viscacha rodent (Lagostomus maximus, 18.2%).
We detected a total of 50 bird and 15 mammal species in the highland grassland of the Tandilia Mountains. We reported naïve occupancy, capture rate, and time to the first detection of each species (Tables 1, 2). Bird species with the highest values of naïve occupancy and capture rates were the Chalk-browed Mockingbird, the Rufous-collared Sparrow, the Rufous Hornero, the Great Pampa-finch, and the Spotted Tinamou, being detected in 21-25% of the sites (Table 1). In total, these 5 bird species accounted for 48% of all detected individual birds (n = 2,749 individuals) and their mean times for the first detection ranged between 6 and 9 days (Table 1). Mammal species with the highest values of naïve occupancy and capture rates were the Pampas fox, the large hairy armadillo, the European hare, the Molina’s hog-nosed skunk, and the Geoffroy’s cat being detected in 32-77% of the sites (Table 2). These 5 mammal species accounted for 81% of all detected individual mammals (n = 3,643 individuals), and their mean times for the first detection ranged between 4 and 7 days (Table 2).
Table 1 Naïve occupancy, capture rate, time to the first detection (mean ± SE), and eBird frequency of the bird species detected with camera traps in the Tandilia Mountains. Bird families are ordered following the systematic classification proposed by Prum et al. (2015). Asterisks indicate nesting grassland species.
| Family | Common name | Scientific name | Naïve occupancy | Capture rate | Time to the first detection (days) | % Observed relative detection frequency | eBird detection frequency |
|---|---|---|---|---|---|---|---|
| Rheidae | Greater Rhea* | Rhea americana | 0.01 | 0.30 | 7.8 ± 3.0 | 0.4% | 0.01 |
| (4.8-10.8) | |||||||
| Tinamidae | Red-winged | Rhynchotus | 0.09 | 1.26 | 7.1 ± 1.3 | 1.7% | 0.18 |
| Tinamou* | rufescens | (0.2-18.4) | |||||
| Spotted Nothura* | Nothura maculosa | 0.21 | 4.25 | 6.6 ± 0.9 | 5.7% | 0.21 | |
| (0.1-27.0) | |||||||
| Anatidae | Yellow-billed Pintail | Anas georgica | 0.01 | 0.05 | 23.9 | 0.1% | 0.23 |
| Yellow-billed Teal | Anas flavirostris | 0.02 | 1.67 | 5.7 ± 5.0 | 2.3% | 0.26 | |
| (0.3-15.9) | |||||||
| Cuculidae | Guira Cuckoo | Guira guira | 0.01 | 0.08 | 13.7 ± 12.8 | 0.1% | 0.31 |
| (1.1-26.2) | |||||||
| Columbidae | Picazuro Pigeon | Patagioenas | 0.12 | 2.23 | 8.3 ± 1.9 | 3.0% | 0.69 |
| picazuro | (0.1-25.7) | ||||||
| Spot-winged Pigeon | Patagioenas maculosa | 0.01 | 0.13 | 2.9 | 0.2% | 0.38 | |
| Eared Dove | Zenaida auriculata | 0.17 | 11.13 | 9.6 ± 1.6 | 15.1% | 0.71 | |
| (0.0-32.0) | |||||||
| Rallidae | Plumbeous Rail | Pardirallus | 0.03 | 0.54 | 3.9 ± 1.8 | 0.7% | 0.07 |
| sanguinolentus | (0.5-9.8) | ||||||
| Charadriidae | Southern Lapwing | Vanellus chilensis | 0.07 | 0.89 | 7.4 ± 2.0 | 1.2% | 0.74 |
| (0.1-18.9) | |||||||
| Scolopacidae | Paraguayan Snipe | Gallinago gallinago | 0.01 | 0.03 | 1.2 | 0.0% | 0.01 |
| Ardeidae | Whistling Heron | Syrigma sibilatrix | 0.01 | 0.05 | 11.5 ± 6.7 | 0.1% | 0.15 |
| (4.9-18.1) | |||||||
| Accipitridae | Roadside Hawk | Rupornis magnirostris | 0.01 | 0.03 | 1.0 | 0.0% | 0.30 |
| White-tailed Hawk | Geranoaetus albicaudatus | 0.01 | 0.03 | 4.9 | 0.0% | 0.02 | |
| Black-chested Buzzard-Eagle | Geranoaetus melanoleucus | 0.01 | 0.03 | 5.1 | 0.0% | 0.03 | |
| Strigidae | Burrowing Owl | Athene cunicularia | 0.03 | 0.35 | 18.3 ± 9.5 | 0.5% | 0.25 |
| (1.1-54.4) | |||||||
| Picidae | Green-barred Woodpecker | Colaptes melanochloros | 0.01 | 0.03 | 1.1 | 0.0% | 0.30 |
| Campo Flicker | Colaptes campestris | 0.02 | 0.11 | 7.1 ± 2.4 | 0.1% | 0.28 | |
| (3.0-14.1) | |||||||
| Falconidae | Crested Caracara | Caracara plancus | 0.05 | 1.16 | 6.3 ± 1.8 | 1.6% | 0.39 |
| (0.0-15.0) | |||||||
| Chimango Caracara | Milvago chimango | 0.09 | 1.80 | 5.9 ± 1.5 | 2.4% | 0.82 | |
| (0.9-25.0) | |||||||
| American Kestrel | Falco sparverius | 0.02 | 0.08 | 10.2 ± 4.5 | 0.1% | 0.26 | |
| (1.9-17.7) | |||||||
| Psittacidae | Monk Parakeet | Myiopsitta | 0.02 | 0.51 | 0.9 ± 0.4 | 0.7% | 0.65 |
| monachus | (0.2-2.0) | ||||||
| Furnariidae | Rufous Hornero | Furnarius rufus | 0.23 | 8.95 | 5.9 ± 0.8 | 12.1% | 0.72 |
| (0.0-26.3) | |||||||
| Buff-winged | Cinclodes fuscus | 0.02 | 0.16 | 9.3 ± 1.9 | 0.2% | 0.03 | |
| Cinclodes | (7.0-15.0) | ||||||
| Firewood-Gatherer | Anumbius annumbi | 0.01 | 0.03 | 1.8 | 0.0% | 0.16 | |
| Tyrannidae | Sooty Tyrannulet | Serpophaga nigricans | 0.01 | 0.03 | 29.8 | 0.0% | 0.05 |
| Great Kiskadee | Pitangus sulphuratus | 0.04 | 1.10 | 8.9 ± 4.6 | 1.5% | 0.65 | |
| (0.1-38.9) | |||||||
| Tropical Kingbird | Tyrannus melancholicus | 0.02 | 0.19 | 4.3 ± 2.7 | 0.3% | 0.25 | |
| (0.9-12.2) | |||||||
| Fork-tailed | Tyrannus savana | 0.03 | 0.21 | 3.9 ± 1.7 | 0.3% | 0.28 | |
| Flycatcher | (0.9-12.2) | ||||||
| Spectacled Tyrant* | Hymenops perspicillatus | 0.06 | 1.10 | 8.0 ± 2.5 | 1.5% | 0.15 | |
| (0.0-25.9) | |||||||
| Troglodytidae | House Wren | Troglodytes aedon | 0.01 | 0.08 | 9.2 | 0.1% | 0.51 |
| Polioptilidae | Masked Gnatcatcher | Polioptila dumicola | 0.01 | 0.03 | 22.0 | 0.0% | 0.12 |
| Turdidae | Rufous-bellied | Turdus rufiventris | 0.10 | 2.74 | 9.8 ± 2.2 | 3.7% | 0.39 |
| Thrush | (0.1-32.0) | ||||||
| Mimidae | Chalk-browed | Mimus saturninus | 0.26 | 8.42 | 6.4 ± 0.9 | 11.4% | 0.61 |
| Mockingbird | (0.1-26.0) | ||||||
| Sturnidae | European Starling | Sturnus vulgaris | 0.01 | 0.05 | 3.9 | 0.1% | 0.15 |
| Passeridae | House Sparrow | Passer domesticus | 0.02 | 0.73 | 8.2 ± 4.5 | 1.0% | 0.56 |
| (0.3-20.9) | |||||||
| Motacillidae | Pipit* | Anthus sp. | 0.01 | 0.05 | 2.8 | 0.0% | 0.00 |
| Fringillidae | Hooded Siskin | Spinus magellanicus | 0.01 | 0.05 | 3.8 | 0.0% | 0.38 |
| Passerellidae | Grassland Sparrow* | Ammodramus humeralis | 0.01 | 0.03 | 9.2 | 0.0% | 0.08 |
| Rufous-collared | Zonotrichia | 0.23 | 7.80 | 9.2 ± 1.2 | 1.5% | 0.73 | |
| Sparrow* | capensis | (0.1-29.7) | |||||
| Icteridae | White-browed | Leistes | 0.04 | 0.51 | 8.6 ± 2.3 | 0.7% | 0.09 |
| Meadowlark* | supercilliaris | (1.3-16.7) | |||||
| Long-tailed | Leistes loyca | 0.09 | 0.91 | 7.0 ± 1.6 | 1.2% | 0.17 | |
| Meadowlark* | (0,0-22.0) | ||||||
| Family | Common name | Scientific name | Naïve | Capture | Time to | % Observed | eBird |
| Shiny Cowbird | Molothrus | 0.06 | 1.96 | 14.1 ± 3.9 | 2.7% | 0.40 | |
| bonariensis | (2.0-50.0) | ||||||
| Grayish Baywing | Agelaioides badius | 0.04 | 0.73 | 9.3 ± 3.1 | 1.0% | 0.44 | |
| (1.2-23.2) | |||||||
| Brown-and-yellow | Pseudoleistes | 0.09 | 2.93 | 7.1 ± 1.6 | 4.0% | 0.29 | |
| Marshbird* | virescens | (0.1-22.0) | |||||
| Thraupidae | Saffron Finch | Sicalis flaveola | 0.03 | 0.51 | 7.8 ± 4.6 | 0.7% | 0.33 |
| (1.2-26.1) | |||||||
| Grassland | Sicalis luteola | 0.06 | 1.86 | 6.2 ± 2.2 | 2.5% | 0.36 | |
| Yellow-Finch* | (0.0-25.9) | ||||||
| Double-collared Seedeater* | Sporophila caerulescens | 0.01 | 0.05 | 12.1 | 0.1% | 0.19 | |
| Great Pampa-Finch* | Embernagra | 0.23 | 5.97 | 6.4 ± 0.9 | 8.1% | 0.36 | |
| platensis | (0.1-25.8) |
Table 2 Naïve occupancy, capture rate, time to the first detection (mean ± SE), and GBIF frequency of the mammal species detected with camera traps in the Tandilia Mountains. Mammal families are ordered following the systematic classification proposed by Zoonomia Consortium (2020).
| Order - Family | Common name | Scientific name | Naïve occupancy | Capture rate | Time to the first detection (days) | % observed relative detection frequency | % GBIF relative detection frequency (n) |
|---|---|---|---|---|---|---|---|
| Didelphimorphia | |||||||
| Didelphidae | White-eared | Didelphis | 0.05 | 1.32 | 6.2 ± 1.9 | 1.3 % | 2.2 % (2) |
| opossum | albiventris | (0.3-17.6) | |||||
| Carnivora | |||||||
| Felidae | Geoffroy’s | Leopardus | 0.32 | 4.41 | 7.5 ± 0.8 | 4.5 % | 3.4 % (3) |
| cat | geoffroyi | (0.1-26.3) | |||||
| Puma | Puma | 0.07 | 0.40 | 12.6 ± 2.0 | 0.4 % | 0 % | |
| concolor | (2.3-28.9) | (0) | |||||
| Canidae | Pampas fox | Lycalopex | 0.77 | 34.15 | 3.8 ± 0.5 | 34.9 % | 9.0 % (8) |
| gymnocercus | (0.0-35.0) | ||||||
| Mustelidae | Lesser | Galictis cuja | 0.06 | 0.86 | 8.1 ± 2.2 | 0.9 % | 0% |
| grison | (0.1-23.0) | (0) | |||||
| Mephitidae | Molina’s | Conepatus | 0.35 | 6.21 | 6.4 ± 0.8 | 6.3 % | 0 % |
| hog-nosed skunk | chinga | (0.2-27.4) | (0) | ||||
| Cetartiodactyla | |||||||
| Cervidae | Chital | Axis axis | 0.11 | 2.61 | 5.9 ± 0.9 | 2.7 % | 4.5 % (4) |
| (0.1-17.1) | |||||||
| Fallow deer | Dama dama | 0.10 | 3.58 | 6.3 ± 1.4 | 3.7 % | 7.9 % (7) | |
| (0.4-25.4) | |||||||
| Suidae | Wild boar | Sus scrofa | 0.05 | 0.89 | 8.5 ± 2.6 | 0.9 % | 11 % |
| (0.5-24.3) | (1) | ||||||
| Lagomorpha | |||||||
| Leporidae | European | Lepus | 0.44 | 11.75 | 6.3 ± 0.7 | 12 % | 4.5 % (4) |
| hare | europaeus | (0.1-29.2) | |||||
| Rodentia | |||||||
| Hydrochaeridae | Capybara | Hydrochoerus | 0.03 | 0.89 | 4.2 ± 2.4 | 0.9 % | 25.8 % (23) |
| hydrochaeris | (0.4-13.6) | ||||||
| Myocastoridae | Coypu | Myocastor | 0.02 | 0.40 | 6.5 ± 1.9 | 0.4 % | 29.2 % (26) |
| coypus | (2.8-9.1) | ||||||
| Chinchillidae | Plains | Lagostomus | 0.03 | 7.50 | 0.4 ± 0.1 | 7.7 % | 0 % |
| viscacha | maximus | (0.1-0.6) | (0) | ||||
| Cingulata | |||||||
| Chlamypholidae | Large hairy | Chaetophra | 0.48 | 22.53 | 6.0 ± 0.7 | 23 % | 6.7 % (6) |
| armadillo | ctus villosus | (0.1-34.3) | |||||
| Dasypodidae | Southern | Dasypus | 0.06 | 0.46 | 8.3 ± 2.5 | 0.5 % | 5.6 % (5) |
| long-nosed armadillo | hybridus | (0.6-24.9) |
From the eBird query, we obtained 1,200 complete checklists and a list of 224 bird species for the study area, of which 89 (40%) are grassland-associated species. We detected more than half (56%) of these grassland-associated bird species by camera trapping. Six bird species (i.e., the Chalk-browed Mockingbird, the Rufous-collared Sparrow, the Rufous Hornero, the Eared Dove, the Picazuro Pigeon, and the Chimango Caracara) also ranked in the top 10 most detected bird species from our camera trapping study and complete eBird lists. Four of these species ranked in the same order, and 2 of them ranked in the opposite position: the Chalk-browed Mockingbird was at the top of the camera trap list, and the Chimango Caracara was in the ninth position (Fig. 2a). In contrast, on the eBird list, the Chalk-browed Mockingbird was in the ninth position, and the Chimango Caracara was at the top of the list. The species in the trap camera list that did not concurrently rank within the top 10 of the eBird list were the Great Pampa-finch, the Spotted Nothura, the Rufous-bellied Thrush, and the Brown-and-Yellow Marshbird (positions 19, 38, 15, and 27 of the eBird list, respectively).
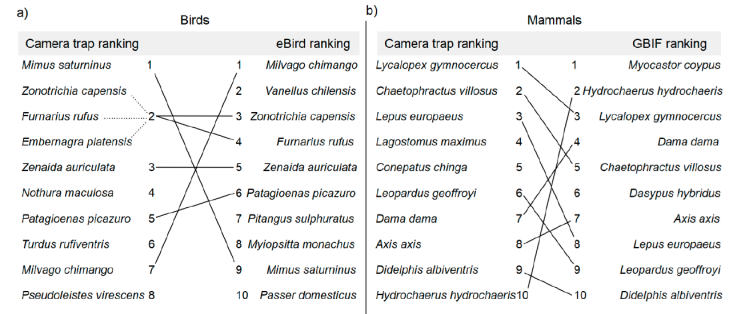
Figure 2 Top-ranked species from camera trapping (this study) and eBird (a) and GBIF (b) queries between 2011 and 2022 in the Tandilia Mountains.
From the GBIF query, we obtained 89 records of 11 medium to large-sized terrestrial mammal species reported for the study area (GBIF, 2022b). We detected 15 medium to large-sized terrestrial mammal species with camera traps, including the 11 mammal species reported by GBIF (100%) and 4 unreported species in GBIF (i.e., puma, lesser grison, Molina’s hog-nosed skunk, and plains viscacha). Nine of the mammal species matched between the top 10 of the lists, while 2 of the species reported by GBIF (i.e., the coypu and the southern long-nosed armadillo) did not rank in the top 10 camera trap list (Fig. 2b). Two species present in the top 10 camera trap list were not reported by GBIF (i.e. the Molina’s hog-nosed skunk and the plains viscacha). The coypu ranked in the last position on the camera trap list but the first on the GBIF list.
We used a subset of 81 cameras (42% of the total cameras) that were active for at least 20 days to describe the sampling effort necessary to detect grassland species. We detected 38 bird species and all the mammal species reported in this study. In both species’ groups, we observed minimal differences between 2 and 3-week sampling periods throughout the species accumulation curves concerning the number of sampled sites (Fig. 3). To obtain 50% of bird richness, at least 28 sites should be sampled for 1 week, or 15 sites for 3 weeks (Fig. 3a). To obtain the 75% of mammal richness at least 20 sites should be sampled for 1 week, or 11 sites for 3 weeks (Fig. 3b). Table 3 summarizes the sampling effort (measured in trap days and number of photos captured) required to reach different richness values for different groups obtained from the bird and mammal species accumulation curves.
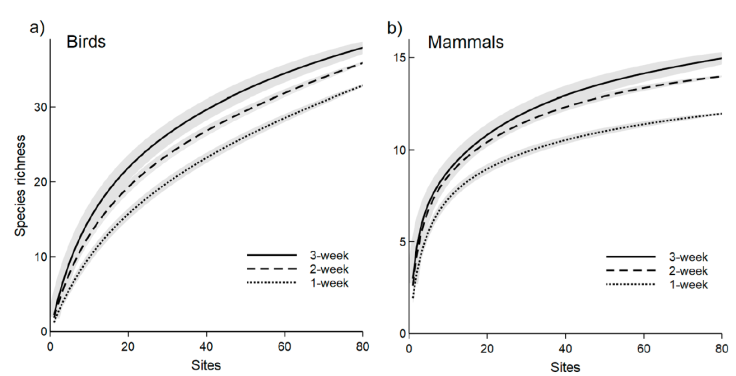
Figure 3 Bird (a) and mammal (b) species accumulation curves based on 81 camera sites that were active for at least 3 weeks in the Tandilia Mountains.
Table 3 Necessary effort in trap-days (d) and photo-captures (ph.) to reach different values of richness for each group of species detected with camera traps in the Tandilia Mountains.
| Group (number of species) | 50% | 75% | 90% | 100% |
|---|---|---|---|---|
| All the birds (50) | 286 d | 1,096 d | 2,282 d | 3,605 d |
| (162 ph.) | (899 ph.) | (2,116 ph.) | (3,604 ph.) | |
| Nesting grassland birds (13) | 110 d | 459 d | 1,778 d | 3,597 d |
| (62 ph.) | (305 ph.) | (1,462 ph.) | (3,590 ph.) | |
| Other birds (37) | 397 d | 1,266 d | 2,393 d | 3,604 d |
| (246 ph.) | (1,086 ph.) | (2,267 ph.) | (3,603 ph.) | |
| All mammals (15) | 44 d | 145 d | 344 d | 2,646 d |
| (25 ph.) | (93 ph.) | (229 ph.) | (1,230 ph.) | |
| Carnivores (5) | 24 d | 97 d | 267 d | 1,085 d |
| (19 ph.) | (79 ph.) | (227 ph.) | (1,070 ph.) | |
| Other mammals (10) | 58 d | 166 d | 392 d | 2,646 d |
| (29 ph.) | (97 ph.) | (228 ph.) | (1,156 ph.) |
Discussion
This work is the first and most complete camera trap study conducted in grassland remnants of the Tandilia Mountains. We showed that both, the capture rate values and naïve occupancy (i.e., the proportion of sampling sites where a species is recorded) were much higher in mammals than in birds associated with the highland grassland. The top-3 most common species were the Pampas fox, the most common species, followed by the large hairy armadillo, and the European hare. These 3 species are relatively common in the agroecosystems of the Pampas ecoregion (Bilenca et al., 2017; Gorosábel et al., 2022). The most common bird species associated with the highland grassland (the Chalk-browed Mockingbird, the Rufous-collared Sparrow, the Rufous Hornero, the Great Pampa-finch, and the Spotted Tinamou) are also relatively widespread species within this ecoregion (Codesido et al., 2011). We found the naïve occupancy very similar to reports from other sites within the Pampas grasslands, but we found differences in some species’ capture rates. For example, the relatively high capture rate of Pampas fox in our study area, especially when compared to those reported by Caruso et al. (2020) and Cravino and Brazeiro (2021), was unexpected.
These above-mentioned authors reported values of capture rate 10 times lower than our study. In the case of Geoffroy’s cat, the capture rate was similar to that reported by Tirelli et al. (2019) for grasslands in southern Brazil, but 2 to 4 times higher compared to other sites (Caruso et al., 2017, 2020; Cravino & Brazeiro, 2021). These differences may relate to good habitat conditions in highland grassland, providing shelter for these species and resulting in higher densities in this habitat (Cravino & Brazeiro, 2021). Another explanation could be related to differences in methodological aspects, such as sampling seasons, camera site spacing, or the interval between independent recordings (30 minutes in this work and 40 to 60 minutes in Caruso et al. [2017], Cravino and Brazeiro [2021], respectively). These factors are important sources of variation and must be taken into account to make comparisons with other habitats (O’Connell et al., 2011; Zanón-Martínez et al., 2016).
Time to the first detection has been poorly reported in Pampas grasslands, even for South American species. This variable is related to the probability of detection and could be valuable in assessing the factors that influence the propensity of visits, movement patterns, and curiosity of the species (Garrard et al., 2008; Tourani et al., 2020). Time to the first detection could not necessarily be associated with the relative abundance of the species. Thus, for example, species with low naïve occupancy values, such as the plains viscacha and chital, had relatively short times to the first detection. On the other hand, common species such as the Chalk-Browed Mockingbird showed a relatively long time to the first detection.
This can be related to the differential avoidance behavior to contamination of the site with human scent, and most important perhaps is the selection of sites (O´Connor et al., 2017); placing cameras at locations in the target species’ range and preferred microhabitat (e.g., near burrows) increases exposure to individuals and thus reduces the time until the initial detection, as is the case for the plains viscacha (Tourani et al., 2020). This information on capture rates and time to the first detection can help monitor target species in the region, especially those with hunting value -spotted nothura, European hare, wild boar- or elusive species -Geoffroy’s cat, puma, lesser grison.
Comparing the species reports from virtual platforms (eBird and GBIF) within the last decade, camera traps were a moderately helpful tool for monitoring species associated with the highland grassland. We could detect all the reported richness of mammals. At the same time, in birds, the efficiency was lower, where the cameras detected just over half of the grassland-associated species reported in the region. When we compare with historical references (records of more than 10 years), in the case of mammals, the camera traps detected 15 of the 17 medium to large-sized species (De Lucca & Chimento, 2020; GBIF, 2022b; Velasco et al., 2013). The 2 species that were not detected by our camera traps but presumed to occur in the Tandilia Mountains were the little water opossum (Lutreolina crassicaudata ) and the jaguarundi (Herpailurus yagouaroundi). Their historical reports in the study region are from the GBIF database and are based on material in the museum collections or are over 40 years old.
The most common captured bird species were also reported in the bird lists (i.e., eBird), where the detection frequency ranking order was similar. For example, the Rufous-collared Sparrow and the Rufous Hornero ranked second and third in the capture ranking and third and fourth in the eBird ranking. However, many grassland birds showed a high position in the capture ranking compared to the eBird ranking. For example, 3 grassland bird species were in the top-10 capture ranking (i.e., the great Pampa-finch, Spotted Nothura, and Brown-and-yellow Marshbird) and beyond the 19th position in the top-10 eBird ranking. This high detection frequency of grassland birds suggests that trap cameras would be a valuable tool to increase grassland bird detection in monitoring programs. Related to mammal species, the detection frequency ranking orders were not similar. Large and medium-sized herbivores were most commonly reported in the GBIF list. For example, 2 relatively tame conspicuous aquatic herbivores, the coypus and the capybara, and the 2 exotic deer were in the top 10 GBIF species. The high ranking of aquatic herbivores could also be a consequence of a lack of survey of our study in water bodies or aquatic habitats specifically. In this study, we present a simple tool that combines variables of the sampling effort to detect species associated with the temperate Neotropical grassland. The results obtained show that investing 2 or 3 weeks is similar for detecting species richness, being 2 weeks the optimal balance between effort and quality of results. This information, combined with capture rates and time to the first detection, will allow us to design the best sampling strategy for monitoring species. Camera trapping resulted in a valuable tool for monitoring the diversity of bird and mammal species in temperate Neotropical grassland. In the case of birds, this tool was more efficient for nesting grassland species. In contrast, camera traps were very efficient to detect mammal species, allowing us to capture the reported richness of medium and large-sized species. Therefore, if the objective is to assess the species richness of a grassland site in the Pampas ecoregion, then camera trapping could be a limited methodology for birds, but a highly reliable option for mammals, particularly for elusive species such as carnivores (Table 3). The similarity is observed with species richness in other Neotropical ecoregions where cameras are valuable tools for showing the diversity of mammals but are limited to ground-dwelling birds (Cook et al., 2020; Ontiveros et al., 2022). Future studies using this methodology should consider certain aspects that can affect species detectability, such as temporal and spatial factors, as well as the reliability of cameras and individual body size, especially in small mammal and bird species monitoring (Albanesi et al., 2016; Ortmann & Johnson, 2021; Rowcliffe et al., 2011).

