Introduction
Fracture toughness is one of the most important material properties for assessing the structural integrity (Webster, 2000) or investigate the causes of component failures (Urriolagoitia, 2012; Delgado, 1998). In the case of components in service, a sample of material must be removed to evaluate fracture toughness which could endanger the integrity of that component; additional concerns arise when the critical testing region is so small that specimens cannot be obtained with the minimum size requirements of the standard test methods. Consequently, test methodologies have been developed focusing on sub-sized specimens that allow significant material data to be derived from a small quantity of sample material.
In the last decades, the Small Punch Test (SPT) has proved to be a promising testing technique in assessing mechanical properties by using reduced size specimens. The SPT was initially used in mechanical property characterization of irradiated material within the nuclear industry (Manahan, 1981; Mao, 1987; Mao 1991) and later was introduced as a quasi-nondestructive method for evaluating local mechanical properties in service structural elements with large dimensions (Fleury, 1998; Viswanathan, 1994; Lacalle, 2008; Madia, 2013; Guan, 2011; Dogan, 2012; Cárdenas 2012). The small punch test basically comprises punching very small square specimens, measuring 10×10 mm2 and 0.5 mm thickness, until fracture using a rigid ball; see Figure 1.
During the test, the force-displacement curves are registered. From these curves, tensile mechanical properties have been successfully estimated (Fleury, 1998; Rodríguez, 2009; Ruan, 2002) along with fracture toughness properties (Mao 1987, Mao 1991). Several researchers (Mao, 1987; Guan, 2011; García, 2014; Mao, 1987; Misawa, 1989; Wang, 2008) have reported that there exists a linear relationship between the fracture toughness parameter JIC and the SPT data, which can be expressed by Eq. 1:
Where k and J0 are material constants, whereas εaf is the equivalent fracture strain given by Eq. (2):
In the last equation, t0 and tf are the initial and final thickness of the fracture specimen, respectively; see Figure 2.
Although good correlations between fracture toughness parameters and SPT data have been found, values of the constants k and J0 constants are distinctive for each material (García, 2015). In the case of structural steels, most of SPT studies have focused on wrought steels, while only a few investigations have concentrated on cast steels, regardless of the brittle nature of these steels. Therefore, more extensive investigation under the SPT technique is needed for cast steels.
The cast steel investigated in this work corresponds to the cable anchorages of a cable-stayed bridge that contains 112 cable anchorages; see Figure 3. One of the cable anchorages failed during normal operation in 2000 after five years of service. Since then, several scientific and engineering studies have been realized for assessment of its structural integrity. López et al. (2009) presented an analysis using ultrasonic and liquid penetrant techniques, and the results revealed the presence of several micro-structural defects, such as pores, cracks, inclusion and large grain size, derived from an improper fabrication condition. Alcaraz et al. (2012) developed research about the fracture toughness size effect on SE(B) specimens using 1Cr-½Ni cast steel, whereas Quintana et al. (2014) performed a damage evaluation study employing a novel method called a global search method for complex structures. Alcaraz (2012) developed a probabilistic analysis for anchorage structural integrity using probabilistic density functions of material properties and applied stress. Terán et al. (2014) carried out a structural integrity assessment of the anchorages using failure assessment diagrams, including the effects of residual stress and three different types of defects.
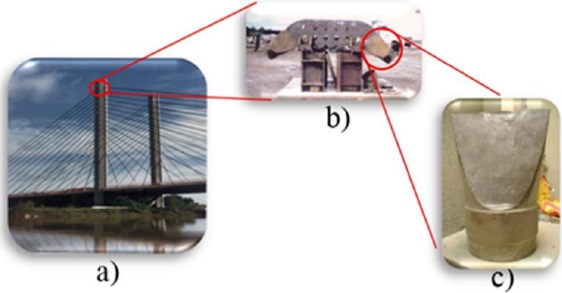
Figure 3 a) Cable-Stayed bridge on Papaloapan River, México; b) Set of anchorages welded with the tapered plate; c) Anchorage put out of service.
Based on an ultrasonic study (López, 2009), 16 anchorages in critical condition (large number of microstructural defects) were removed from the bridge along with four anchorages considered in “good condition” to study several properties. Two of them were used in the present research to evaluate whether the SPT could be a technique to determine the fracture toughness of the remaining in-service cast steel anchorages on the bridge.
Experimental Methods
Previous work: Mechanical characterization by standard methods (Alcaraz, 2012)
The materials under study are cast steels from two different cable anchorages (see Figure 3), where the chemical composition, microstructural details, and tensile and fracture toughness properties were determined according to current standards. The chemical composition was obtained by applying the optical spark emission technique under the ASTM E1019 and ASTM E415 standards. The microstructure characterization was performed by optical microscopy after specimen polishing and chemical attack with Nital-3%. A total of 9 rectangular specimens from anchorage 1 and 34 rectangular specimens from anchorage 2 were prepared for tensile testing according to the ASTM E8 standard. In addition, plane-strain fracture toughness KIC was determined following the guidelines of the ASTM E399 standard; SE(B) three-point bend specimens were fabricated with a maximum thickness allowed by the limited dimensions of the respective anchorages. Thus, from anchorage 1, two 52-mm-thick specimens were obtained, whereas one specimen of 60 mm thickness was fabricated from anchorage 2.
Small punch technique characterization
As mentioned, a widely used correlation for assessing the fracture toughness of metallic materials by means of the small punch technique is given by Eq. (1). This expression, which relates the fracture parameter JIC with the equivalent fracture strain εqf, has proved to give good approximations. In fact, fitting coefficients k and J0 for several materials have been reported by some authors (Mao, 1987; Wang, 2008; Guan, 2011). In the present work, the fitting parameters mentioned above have been used for the fracture toughness estimation of the cast steels under study, and they are shown in Table 1.
Table 1 Empirical models used for fracture toughness estimation.
| Model | Reference |
|
|
General model |
|
|
[Mao, 1987] |
|
|
[Wang, 2008] |
|
|
[Guan, 2011] |
Moreover, additional k and J0 values were also obtained by using (εqf, JIC) values from anchorage 2 and corresponding low-alloy steel values from literature (Guan, 2011), see Table 2, where the main alloying element was Chromium (Cr). It is worth mentioning that (εqf, JIC) values from weld steels were not considered from such reference because the steel under study is a cast steel without welding. The εqf value from anchorage 2 was calculated by using Eq. (2), while JIC was obtained by means of Equation (3), where E is Young’s modulus and
Table 2 Set of (εaf, JIC) points used in correlation Eq. (1) from Guan (2011) and anchorage 2.
| Material | εqf | JIC (kJ/m2) |
|---|---|---|
| 2.25Cr1Mo | 1.1281 | 315.71 |
| 2.25Cr1Mo (embrittlement) | 1.1452 | 332.28 |
| 2.25Cr1Mo weld (as received) | 0.3528 | 110.67 |
| 2.25Cr1Mo weld (de-embrittlement) | 0.9786 | 239.65 |
| 1.25Cr0.5Mo | 0.7174 | 219.21 |
| 40CrNi2Mo | 0.4936 | 117.00 |
| 25Cr2NiMo1V | 0.8675 | 204.50 |
| 23CrNiMoWV | 0.8827 | 282.40 |
| 0.8Cr0.6Ni (Anchorage 2) | 0.2336 | 10.18 |
The small punch test specimens considered were 10×10 mm2 squares of 0.5 mm thickness. Eigth test pieces were prepared from anchorage 1 and eigth samples from anchorage 2. The testing machine used was a Zwick Roell single-column equipment, model BT1-FR2.5TS.140, 2500 N loading capacity. The SPT compression tests were performed at room temperature under displacement control by using TestExpert software (Zwick Roell) at a speed of 0.6 mm/min as recommended (CWA 15627, 2008).
Results and Discussion
Mechanical characterization by standard methods
Chemical analysis results from previous work of the two cable anchorage steels are shown in Table 3. Based on their alloying elements, the materials were classified as low-alloy cast steels, where anchorage 1 is named 1Cr-0.5Ni, and anchorage 2 as 0.8Cr-0.6Ni. Figure 4 presents metallographic examinations from the two anchorages. In both cast steels, a characteristic ferrite-pearlite microstructure is observed; however, some differences can be distinguished concerning the phase distribution, possibly due to a deficient heat treatment (López, 2009). Also, some sulfides and pores are also observed (Figure 5), as well as macroscopic discontinuities (Figure 6).
Table 3 Chemical composition of the two cast steels from cable anchorages (Alcaraz, 2012).
| Achorage | C | Mn | Si | S | P | Cr | Mo | Ni | Cu |
|---|---|---|---|---|---|---|---|---|---|
| 1 | 0.423 | 0.820 | 0.803 | 0.022 | 0.034 | 1.007 | 0.093 | 0.537 | 0.343 |
| 2 | 0.397 | 0.707 | 0.300 | 0.036 | 0.036 | 0.813 | 0.080 | 0.603 | 0.340 |
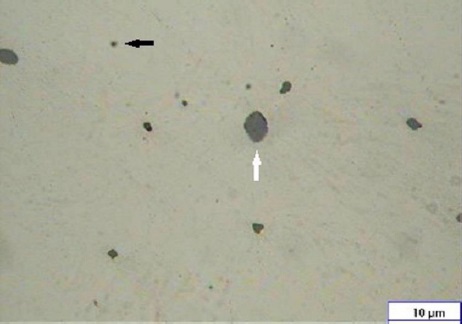
Figure 5 Sulfides (white arrow) and pores (black arrow) observed in both anchorages (Alcaraz, 2012).
The tensile mechanical properties obtained from previous work are shown in Table 4. It is observed that the steel from anchorage 1 has a yield and ultimate strength higher than those of anchorage 2; however, the ductility is higher for the cast steel from anchorage 2, as evidenced by the elongation percent. Figure 7 shows stress-strain curves for the two cast steels for comparison purposes. The stress-strain curve from anchorage 1 is typical of high-resistance steel, whereas the corresponding curve for anchorage 2 is representative of high-ductility steels with extensive plastic strain prior to fracture.
Table 4 Tensile properties of the two cast steels from cable anchorages (Alcaraz, 2012).
| Anchorage |
E (GPa) |
Sy (MPa) |
Su (MPa) |
Elongation (%) |
| 1 | 199 | 323 | 621 | 8.4 |
| 2 | 195 | 280 | 591 | 12.6 |
The fracture toughness testing results according to ASTM E399 standard are shown in Table 5. By comparing fracture toughness KIC values for both anchorages, anchorage 2 presents a higher value than anchorage 1. The difference can be explained by the high ductility exhibited by anchorage 2 with respect to anchorage 1; see Table 4.
Table 5 Fracture toughness KIC for anchorages 1 and 2 (Alcaraz, 2012).
| Anchorage | Thickness mm |
KIC MPa∙m1/2 |
|---|---|---|
| 1 | 52 | 39.4 |
| 2 | 60 | 47.5 |
Small Punch Test Characterization
Load-displacement curves obtained from small punch testing for both anchorages are shown in Figure 8. These curves display a characteristic ductile behavior for both steels (Lacalle, 2012). Some clear differences can be appreciated between both curve sets if the maximum values of load and displacement are considered. The set of curves for anchorage 1 exhibits lower load and displacement values than the corresponding values for anchorage 2. According to this result, the SPT technique yields load-displacement curves with good repeatability and thus can make a capable distinction between the two types of cast steels; nevertheless, the maximum load values slightly fluctuate. This last behavior is linked to local strain concentrations arising before the maximum load is reached, leading to material instabilities (Lacalle, 2012).
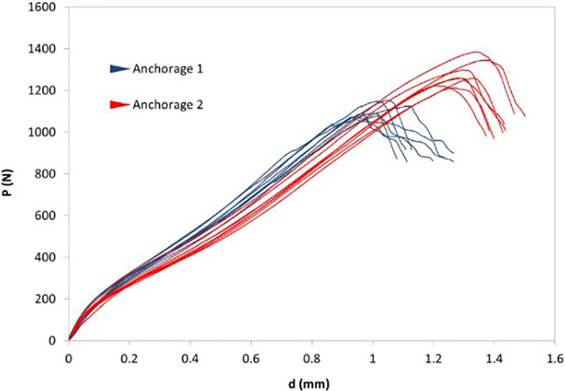
Figure 8 SPT load-displacement curves for steel specimens in anchorage 1 (left) and anchorage 2 (right).
The failure morphology displayed by the small punch specimens for both anchorages showed a hemispherical surface, and fracture occurred along the circumference where the strain is highest; see Figure 9. This failure mode is typical of ductile steels.
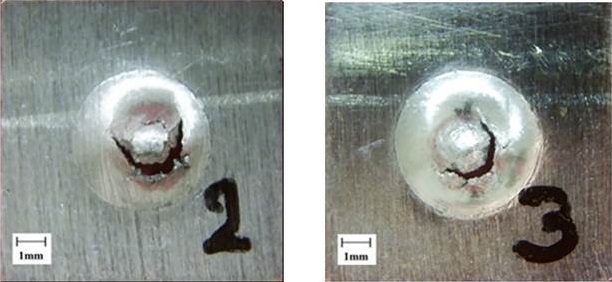
Figure 9 Fracture morphology in small punch specimens in anchorage 1 (left) and anchorage 2 (right).
To analyze the SPT fracture toughness results, the equivalent fracture strain εqf is used. This parameter is calculated from a modified version of Eq. (2) (Mao, 1987), which is given as
Where d* is the displacement at fracture, which is obtained from the load-displacement curves for the fractured specimens. Thus, d* and εqf values for the specimens from anchorages 1 and 2 are shown in Table 6. By observing the displacement values d* from both anchorages, it is then clear that the cast steel from anchorage 2 shows higher ductility, as previously concluded from Figure 8 and Table 4.
Table 6 d* and εaf parameters for anchorage 1 (left) and anchorage 2 (right).
| Specimen | d* | εqf | Specimen | d* | εqf | |
|---|---|---|---|---|---|---|
| mm | mm | |||||
| 1 | 1.05 | 0.19 | 1 | 1.20 | 0.22 | |
| 2 | 1.12 | 0.20 | 2 | 1.30 | 0.23 | |
| 3 | 0.97 | 0.17 | 3 | 1.28 | 0.23 | |
| 4 | 1.02 | 0.18 | 4 | 1.29 | 0.23 | |
| 5 | 1.02 | 0.18 | 5 | 1.34 | 0.24 | |
| 6 | 0.93 | 0.17 | 6 | 1.33 | 0.24 | |
| 7 | 1.00 | 0.18 | 7 | 1.27 | 0.23 | |
| 8 | 0.95 | 0.17 | 8 | 1.37 | 0.25 | |
| Average | 1.01 | 0.18 | Average | 1.30 | 0.23 |
Table 7 shows the results obtained when the equivalent fracture strain, εqf (Table 6), is introduced into the different correlation models given in Table 1. Corresponding KIC values are obtained by using Eq. (3) and compared with the KIC value found from the standard fracture mechanics technique (ASTM E399, 2004). It is observed that the KIC values from empirical relationships (Wang, 2008; Guan, 2011) support once again the higher toughness of anchorage 2. However, by comparing such values with the KIC reference value obtained from the standard ASTM E399 technique, the SPT KIC values are more than 60% higher. On the other hand, when the parameters are substituted into the relationship proposed (Mao, 1987) for the materials under study, negative KIC values are obtained, which have no physical meaning. This difference can be attributed to materials used in correlations since coefficients can be different. In addition, specimen thickness and device dimensions have an important effect on the results. In fact, this is one of the reasons why the European Committee for Standardization (CWA 15627, 2008) recommends unifying these parameters.
Table 7 SPT fracture toughness results for anchorage 1 (left) and anchorage 2 (right).
| Model |
KIC (MPa∙m1/2) Anchorage 1 |
KIC (MPa∙m1/2) Anchorage 2 |
|---|---|---|
| [Wang, 2008] | 76.62 | 99.72 |
| [Guan, 2011] | 105.17 | 118.18 |
| [ASTM E399, 2004] | 39.4 | 47.18 |
To achieve better estimates of the fracture toughness values for the cast steels under study, k and J0 values were obtained by using an additional correlation with (εqf , JIC) values (Guan, 2011), along with corresponding values from anchorage 2; see Table 2. Figure 10 shows a JIC-εqf plot from such data, along with the trend line with fitting parameters k=340.27 and J0 =54.19 and correlation coefficient R2=0.9511. Thus, the new empirical relationship results in Eq. (5).
This new correlation was tested by substituting the εqf value from anchorage 1 to obtain a new KIC value, which is 40.87 MPa∙m1/2. A better approximation was reached, with 4% error compared to previous models. Thus, for the anchorage cast steels under study, the empirical model (5) is proposed for fracture toughness assessment by the small punch technique.
Finally, Figures 11 (obtained from previous work) and 12 show fractographs from standard and small punch tested specimens, respectively. The fracture surface from the standard specimen shows trans-granular cleavage with ductile tearing, which is associated with a triaxial stress state (Alcaraz, 2012). In contrast, the fracture surface from the SPT specimen exhibits ductile tearing with a considerable quantity of micro-voids. This type of fracture can be associated with a biaxial stress state (insignificant third stress component), which yields extensive plastic deformation throughout the reduced thickness of the SPT specimen.
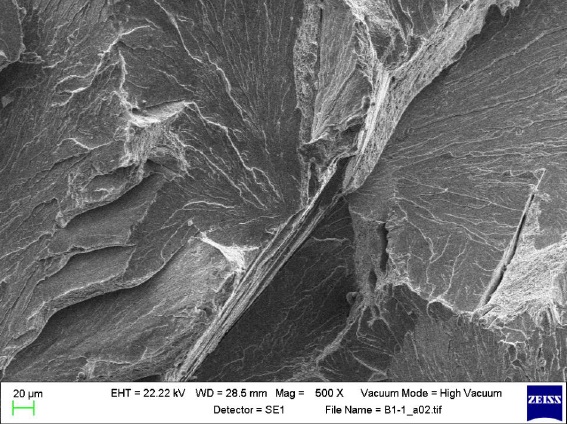
Figure 11 Fractograph for a standard specimen showing cleavage behavior plus dimples and tear ridges (Alcaraz, 2012).
Conclusions
This work involved a comparative analysis of fracture toughness results from standard specimen tests and from small punch rests for low-alloy Cr-Ni cast steels coming from the anchorages of a cable-stayed bridge. Empirical correlations reported in the literature show that fracture toughness values obtained from the SPT technique are not good approximations in comparison with the ASTM E399 standard. This discrepancy can be attributed to materials used in correlations and due to specimen and device dimensions. In this way, for the cast steels under study, new fitting parameters of the used model were proposed for SPT fracture toughness assessment. The results showed a good linear correlation between fracture toughness and equivalent fracture strain, R2=0.9511, where the empirical fitting parameters were k=340.27 and J0=54.19. This correlation demonstrated a good capability for estimating the fracture toughness of cast steel anchorages of the bridge under study, and these findings show considerable promise for its application as a quasi-nondestructive fracture toughness technique for remaining life assessment of in-service anchorages of bridges. Fractographic analysis showed size specimen dependence on the fracture mechanism; small punch specimens showed ductile fracture, whereas standard samples showed quasi-cleavage fracture mode.


 nueva página del texto (beta)


