1. Introduction
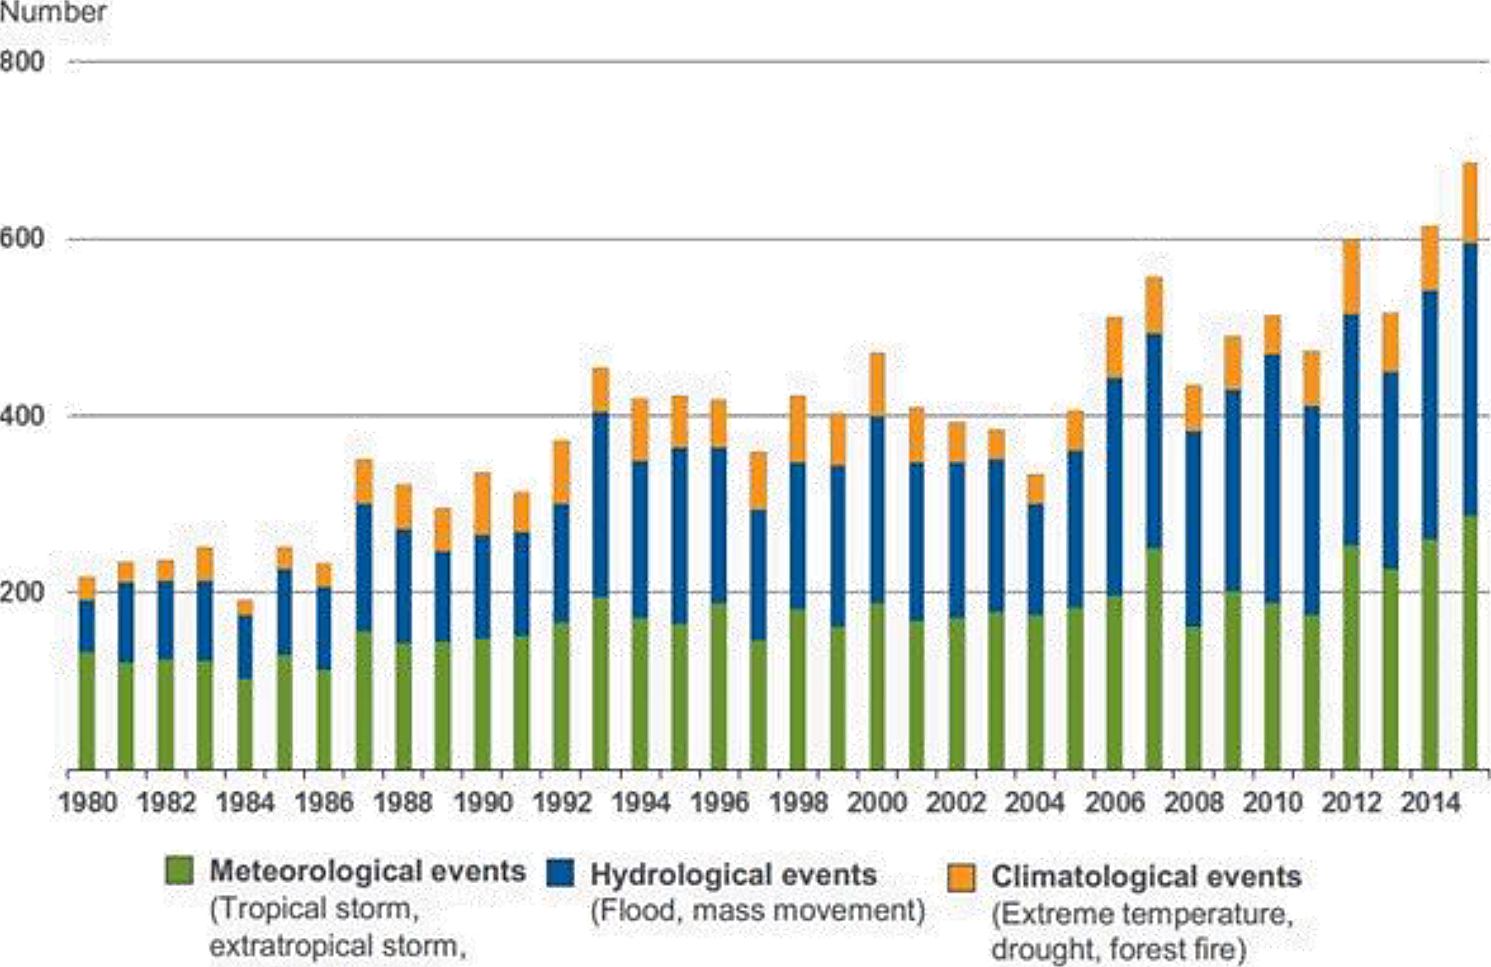
Disasters associated with urban floods generate recurring adverse impacts in various regions of the world, mainly affecting the social and economic sectors. Due to its frequency and magnitude, the development of different methodologies makes it possible to represent the spatial distribution of areas with potential flooding using risk levels, which are generated by combining hazard (H) and vulnerability (V) information (Haer et al., 2017; Ritter et al., 2020; Singh et al., 2020). In a «classical» risk model (R) it is common to use these variables to represent the level of flood risk. Although there are various effort to generate useful information on flood risk, the trend observed in the number of floods versus time shows a significant increase worldwide in the last 35 years (1980-2015) (Figure 1).
Source: Munich RE, NatCatService (2016).
Figure 1 Number of hydro-meteorological hazards versus time.
This fact has become a challenge for different scientific disciplines that evaluate and quantify up to what extent the changes in flood risk and the frequency of floods are the result of the level of hazard and/or vulnerability (Mavhura et al., 2017; Chen et al., 2020). However, different studies demonstrated that the current trend of floods is mostly associated to land use cover change (LUCC) and urban growth in hydrological basins (Solín et al., 2011; Tarigan, 2016; Erena, & Worku, 2019; Rubinato et al., 2019; Chen et al., 2020; Flores et al., 2020; Wu et al., 2020; Hermas et al., 2021). Nevertheless, other authors suggest that floods are the result solely on the hazard that represent heavy rains without considering the context in which disasters occur (Ochoa-Rodríguez et al., 2015; Salack et al., 2018; Bandaru et al., 2020). This assumptions has led to a debate on how to determine flood risk, limiting the usefulness of the results for risk management.
Currently, there are limited studies that evaluate the dynamic process of flood risk considering a multifactorial analysis integrating hazard and vulnerability information (Quirogaa et al., 2016; Mavhura et al., 2017; Aerts, 2020; Duo et al., 2020). In general, these efforts overestimate the level of risk in urban areas where the frequency of flood records is low (Flores et al., 2020; Ke et al., 2020; Poku-Boansi et al., 2020). Due to the quality of information required to assess flood risk in urban areas, most studies are carried out using information generated for larger analysis areas (Kazakis et al., 2015; Shrestha & Lohpaisankrit, 2017; Ignjacevic et al., 2020; Ritter et al., 2020). This fact makes it difficult to develop adequate measures to mitigate and reduce the local risk of flooding. Therefore, it is important to develop methodologies that contribute to a better local analysis of flood risk, using the information available on hazard and vulnerability for the study region.
In Mexico, urban floods are a national problem that impact more than 50 % of the country's municipalities (CENAPRED, 2017; DesInventar, 2019; FONDEN, 2019). According to (Armenta-Monteroet al., 2012; Haer et al., 2017; Vázquez-González et al., 2019), the coastal regions of the Pacific and Gulf of Mexico are the areas of the Mexican territory with the highest record of urban floods (> 60 %) for the period 1970-2018, affecting practically the 265 coastal municipalities of the country, where more than 35 % of the Mexican population is located. Lithgow et al, 2020 and Zúñiga et al, (2018 and 2020) reported that the trend in the number of urban floods in coastal regions of Mexico, is related to the environmental vulnerability of hydrological basin, which generates an increase in runoff and risk of flooding in the lower areas of watershed, due to the loss of natural soil covers. This condition of risk is a result of the LUCC in hydrological basins due to urban development and a high frequency of intense rain events (Aguilar-Barajas et al., 2019; Areu-Rangel et al., 2019). Analyzing the impact of urban floods in Mexico we found that the state of Veracruz concentrates around 40 % of the total flood records that occurred from 1970 to 2015 (CENAPRED, 2017; DesInventar, 2019; FONDEN, 2019). Because of this reason, this state has the highest level of flood risk in Mexico. Due to its geographical location (Gulf of Mexico), this coastal region is affected by intense rains in summer (tropical cyclones) and winter (Zavala-Hidalgo et al., 2014; Meza-Padilla et al., 2015; Pérez-Maqueo et al., 2018; Amador, 2019; Bukvic & Harrald, 2019). This natural condition, combined with the degradation of the local hydrological basins (> 50 %) associated with the LUCC, generates different levels of vulnerability and flood risk (Challenger et al., 2009; Mas et al., 2009; Sarukhán et al., 2015; Lopez-Barrera et al., 2017). Another factor that contributes to the risk of flooding in the region is the level of exposure of the population, which is associated with the increase in urban areas near rivers, where the development of economic activities such as agriculture and livestock represent the main source of economic income for the population.
As a result of this problem, different studies have focused on quantifying the flood risk in Veracruz with the aim of reducing its impact to the local population and economy (Zúñiga et al., 2020; Malekinezhad & Zare-Garizi, 2014; Dyskstra & Dzwonkowsski, 2019). However, the use of environmental or political limits to represent the risk of floods in this region has led to an overestimation of the level of local risk in cities far from rivers and with low frequency of floods and levels of environmental vulnerability. Currently, the use of environmental and political boundaries is a common practice to establish flood risk levels because they can include large regions. However, its usefulness decreases when a local risk analysis is needed, because the risk values are overestimated.
At the moment, several methodologies do not fully explain the multifactorial and dynamical risk process. Various efforts have been made to reduce impacts on the population and regional economy with the highest frequency of disasters associated with urban floods. A large number of studies on flood risk follows the «classic» risk context, considering the combination of hazard variables (P), expressed in terms of probability, and vulnerability (V), as a result of analyzing the elements that show to what extend population and infrastructure are susceptible to be affected, in the form R = (P * V). Other studies integrate exposure (E) to express economic impacts on the elements affected [R = (P * V * E)]. Although the results generated by these methodologies are of great interest and utility to analyze the risk of urban floods, our proposed model (AR) uses two novel variables to analyze the risk. Environmental vulnerability (V) to assess the environmental condition of hydrological basins, which is relevant for the generation of runoff (Pistrika et al., 2007; Tchorzewska-Cieslak et al., 2018; Rana et al., 2018; Al Baky et al., 2020; Mohanty et al., 2020; CENAPRED, 2021), and proximity (p) to bodies of water as a factor that contributes to the frequency of flooding due to overflow. For the proximity variable, no studies were found documenting its application in risk analysis. It is worth mentioning that some studies define exposure (E) as a synonym of proximity. However, exposure is associated with a probabilistic analysis of the impact of a natural phenomenon and proximity uses information from historical flood events to establish the spatial relationship between urban areas with the bodies of water with the highest frequency of overflows.
The main objective of this study is to analyze the efficiency of a new flood-risk model developed here that we call «Adjusted Risk Model (AR)» compared to a «classic» risk model (R). The AR model integrates values of urban proximity to bodies of water and was tested for 210 cities in Veracruz. The results of AR and R are analyzed by estimating the Pearson coefficient. The usefulness of AR is evaluated for the cities of Jamapa and Amatlán de los Reyes also located in the state of Veracruz.
Study area
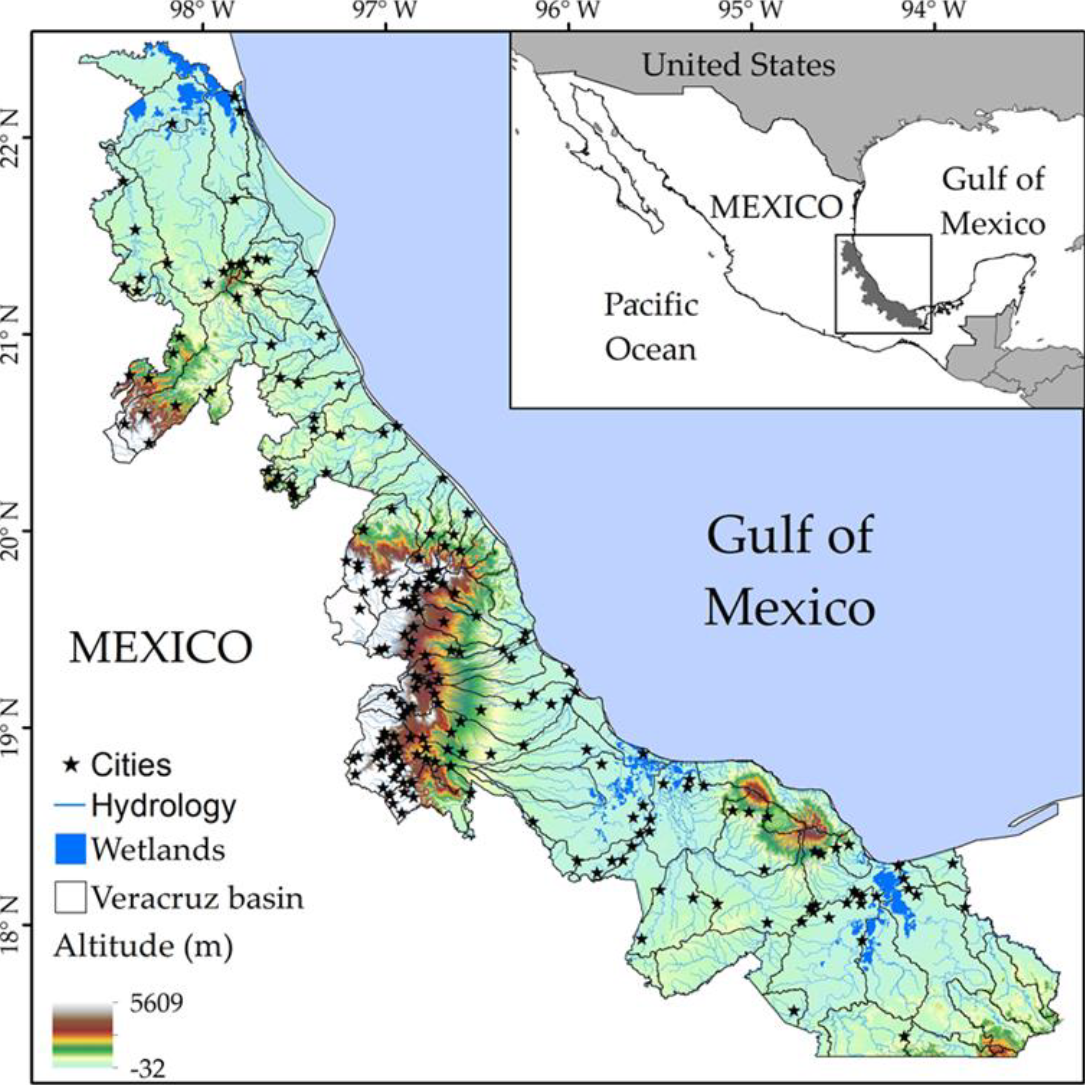
The study area corresponds to the hydrological basins that make up the state of Veracruz (Fig. 2). This coastal region of the Gulf of Mexico has an area of more than 78 000 km2 that represents 3.7 % of the total area of the country's territory. This region has an area of more than 78,000 km2 that represents 3.7 % of the total area of the country’s territory. This coastal state has 81 hydrological basins and an extensive natural drainage network that is mainly concentrated where the terrain’s elevation is very low. In the northern and southern zones, there are wetlands that are hydrologically regulators of runoff and floods (Cazals et al., 2016; Vázquez-González et al., 2019). Geographically, the main cities are concentrated in two areas, on the central region of the state where the land is high and on the plains where there is a high density of rivers.
Source: National Commission for the Knowledge and Use of Biodiversity (CONABIO, 1998) and the National Institute of Geography and Information Statistics (INEGI, 2019; a, b, 2020).
Figure 2 Location of the study area. Spatial distribution of urban cities and main hydrological and orographic characteristics of the State of Veracruz.
2. Methods, techniques, and instruments
In general, when flood risk is assessed and quantified, the context in which these disasters occur is not considered, limiting the usefulness of these studies. In this work we analyze urban floods as a multifactorial and dynamic process by considering the hazard (H) due to intense rains and environmental vulnerability (V) associated with LUCC as elements that contribute to the frequency of floods. We also incorporate information on urban proximity (p) to bodies of water as a component that allows establishing the local risk of flooding. We apply this model to 210 cities of the state of Veracruz.
Historical floods
An important element for the study of urban flood risk is the historical records of flood disasters that occur in the region of interest. We analyzed the frequency of urban floods that occurred in the state of Veracruz during the period 1970 - 2015 based on the historical records of these type of disasters reported by the National Center for Disaster Prevention (CENAPRED, 2017) and the Disaster Inventory of DesInventar (2019). Data were processed to: 1) eliminate errors in the records; 2) standardize the analyzed data; 3) eliminate duplicate information, and 4) generate files compatible with a Geographical Information System (GIS). With the information generated, those cities in the state of Veracruz with the highest number of records of urban floods were identified.
Heavy rain hazard
Establishing a unit of magnitude that considers the frequency of urban floods and intense rainfall describing the dynamics of the hazard in the analyzed region, represents an important element to assess flooding risk. In this work, intense rain thresholds were determined to characterize the hazard (H) by comparing daily rain records from 101 weather stations of the National Meteorological Service (SMN, 2019) located in the state of Veracruz. We obtained rainfall data for 80 registered flood events during the period 1970-2015. The stations were selected considering the following criteria: 1) the shortest distance between the climatological station and the urban area with at least a flood record, and 2) its climatological importance within the hydrological basin where the urban area is located. The quality of the daily precipitation records was determined using the following criteria: 1) stations with records at least of 30 years, 2) detection of values that affect the confidence in records, and 3) systematic errors associated with duplicate records and lack of information. The 95th percentile (P95) is established as a unit of magnitude to represent the hazard (H) because the intensity of rainfall associated with the frequency of floods was located at the 5 % probability of occurrence shown by the P95. To represent the spatial distribution of the hazard (P95), the heavy rainfall data were processed and integrated using geospatial data from the 81 hydrological basins located on the study area. The geospatial information used in vector format that corresponds to the hydrological basins of the state of Veracruz and combined with hazard data, was obtained from the National Commission for the Knowledge and Use of Biodiversity (CONABIO, 1998).
Environmental vulnerability
Due to its hydrological importance in the rain-runoff process, environmental vulnerability (V) is associated with the percentage of LUCC. The percentage of loss of natural soil cover is quantified as an indicator that reduces soil infiltration increasing the environmental vulnerability of basins and the risk of flooding. To establish the adverse effect of the LUCC in the hydrological basins, the percentage of artificial covers was determined for 1970, 1992, 2002, 2010, 2012 and 2016. The urban and agricultural coverage was established as artificial soils due to their limited capacity to infiltrate runoff generated by heavy rains (Xu & Zhao, 2016; Jiang et al., 2018; Salack et al., 2018; Bandaru et al., 2020). The land cover data was obtained from the INEGI data repository (INEGIa, 2020). With the use of spatial geoprocessing tools, the LUCC information was processed considering the environmental vulnerability of the hydrological basins of Veracruz.
Urban proximity
Urban proximity (p) to bodies of water is proposed as an element to improve the analysis of the local risk of floods, adjusting the values generated with R to determine the local risk levels for the cities analyzed. The factor p was obtained by calculating the shortest distance between the urban areas analyzed (210) and the water bodies with a record of flooding. Historical flood records were used to locate flood-affected areas and calculating p. Using geospatial data geoprocessing tools, the p distance was extracted from INEGI (2019; a, b, 2020). With the support of a GIS, the information of the variables is integrated and the spatial analysis of their distribution is carried out. The urban proximity values were classified considering the frequency of floods.
Risk of urban floods
Using the AR and R models by combining P, V and p, we analyzed the multifactorial and dynamic process of flood risk for 210 cities in Veracruz. The results from both models were standardized for a better analysis and interpretation of results (Eq. 1). Flood risk was estimated using Eq. 2 and 3, and the results were compared to historical flood records for the period 1970-2015 using the Pearson's correlation coefficient. To determine up to what extent the previous urban flood risk assessment (using hydrological limits as units of analysis) carried out for the state of Veracruz overestimates the risk for the cities analyzed, we incorporated p into Eq. 2. Here, we use p as an additional factor to Eq. 2 as indicated in Eq. 3, to improve the «low» risk values obtained with R when p is used in the form (P*V*p).
Where:
X'=Scalin equation
X = Standardized value for AR and R
AR;R min ; AR;R max = extreme values for AR and R models
The standardized risk values (Eq. 1) are classified as: «Very low» (0-0.2), «Low» (0.2-0.4), «Moderate» (0.4-0.6), «High» (0.6-0.8) and «Very high» (0.8-1.0).
Where:
R = Classic risk model
AR = Adjusted risk model
H = Hazard
V = Vulnerability
p = Proximity
3. Results and discussion
3.1 Heavy rains hazard
As a result of the analysis of daily intense rain events associated to records of urban floods in 81 hydrological basins of Veracruz, we established the P95 as a unit of magnitude to represent the spatial distribution of hazard (H) (Figure 3a). P95 represents 5 % of the maximum values of intense rain obtained from the analysis of data from climatological stations. The spatial distribution of the hazard in Veracruz is represented by P95 values < 20mm and > 35mm with the highest values concentrated in the central and southern regions of the state with > 25mm and > 30mm, respectively. This hazardous condition can be understood as the frequency of atmospheric phenomena of summer (tropical cyclones) and winter (nortes) that impact this coastal region. According to the distribution of P95, three hazard regions can be established due to intense rains in Veracruz: I) northern region (low hazard); II) central region (moderate hazard), and III) southern region (high hazard) (Figure 3a). Although it is possible to associate intense rain events with the frequency and magnitude of urban floods, it is necessary to consider other elements that contribute to the occurrence of disasters, such as watershed degradation and population exposure (Zahiri et al., 2016; Miller & Hutchins, 2017; Salack et al., 2018).
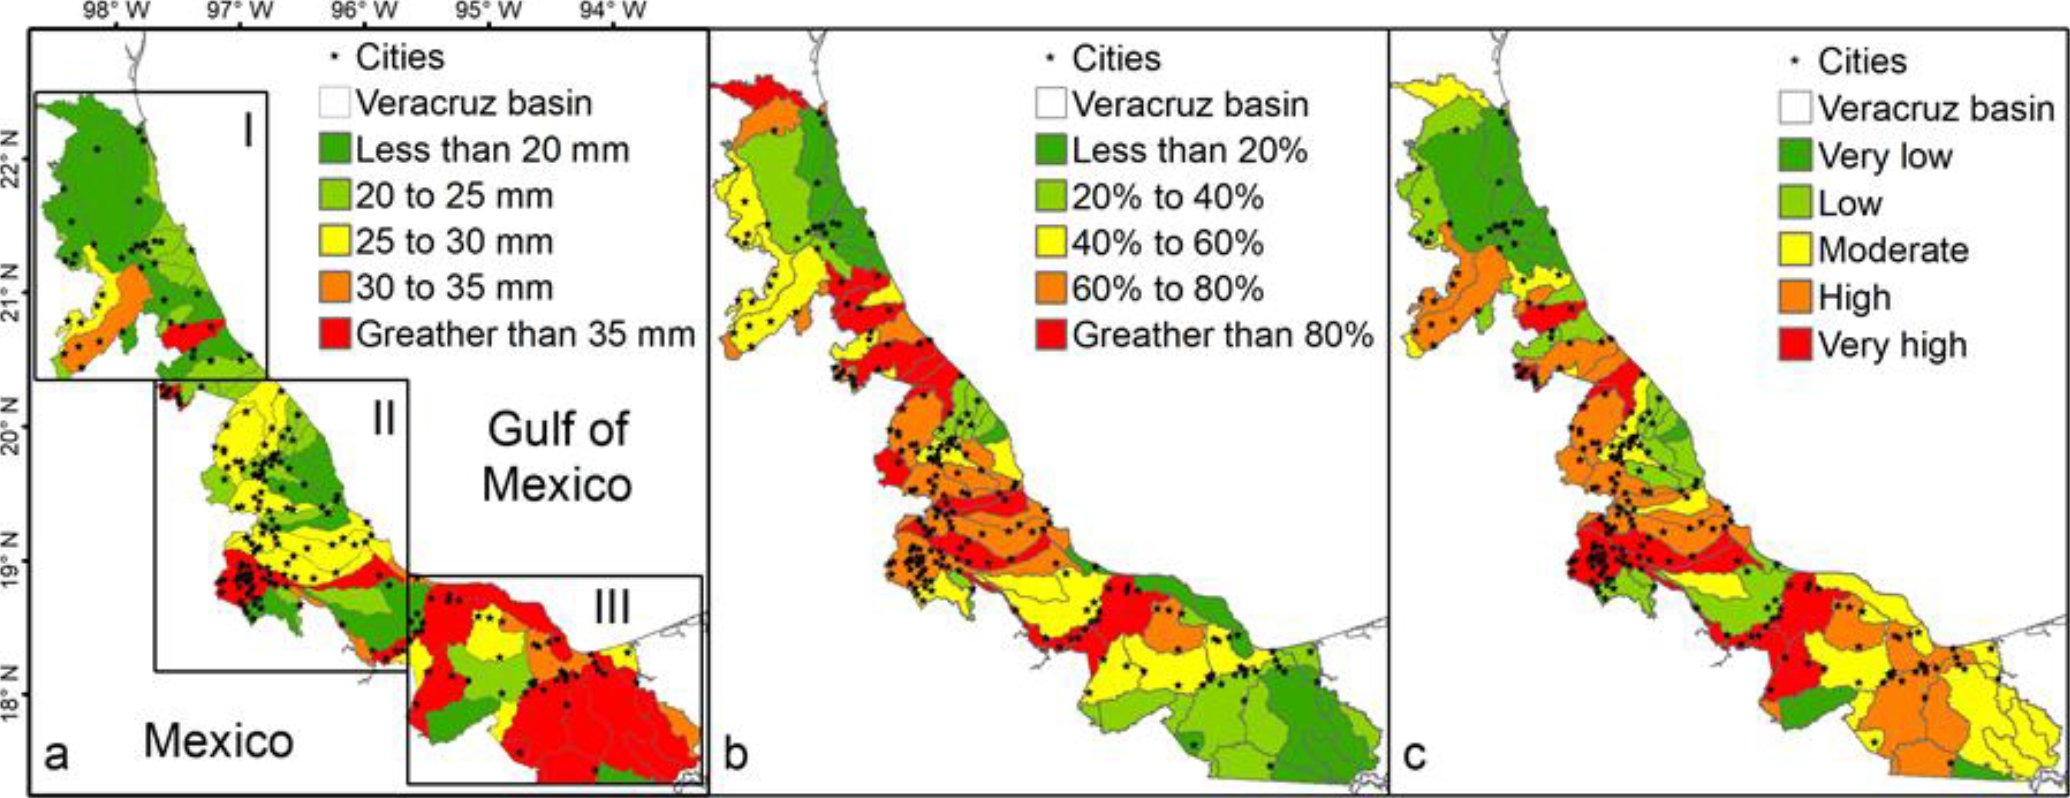
Note: (a) Spatial distribution of hazard due to heavy rain (P95) for the north (I), central (II) and south (III) regions; (b) Environmental vulnerability associated to the percentage of LUCC in hydrological basins; (c) Flood risk level for the state of Veracruz.
Source: Own elaboration.
Figure 3 Spatial distribution, environmental vulnerability and flood risk.
3.2 Environmental vulnerability
Evaluating the adverse effect of the LUCC in the hydrological basins of Veracruz allows quantifying not only their percentage of degradation but also locating the areas where the highest levels of environmental vulnerability are concentrated. Also, the regions where the current trend of the LUCC may favor a runoff increase due to the future increase of less permeable covers are identified. We found that more than 50 % of the hydrological basins have «moderate» to «very high» levels of environmental vulnerability with degradation percentages higher than 40 % (Figure 3b). In different investigations this condition of environmental vulnerability has been shown to be a factor that increases the frequency and magnitude of floods in urban areas (Rubinato et al., 2019; Nkwunonwo et al., 2020; Zúñiga et al., 2020). Based on our results, it can be established that the central region of Veracruz has the highest environmental vulnerability while towards north and south of the state the environmental vulnerability varies from «moderate» to «very low» (Figure 3b). Also, it was identified that a high percentage (> 50 %) of the cities are located where the negative effect of the LUCC in the hydrological basins is high (central region). This physical condition increases the level of flood risk due to the limited infiltration of soils in this area.
3.3 Urban floods risk
From the analysis and integration of the information on hazard due to intense rains and environmental vulnerability, it was established that a large portion of the state of Veracruz (66 %) presents risk levels from «moderate» to «very high» distributed in 51 hydrological basins (Figure 3c). In general, environmental vulnerability showed a favorable effect in hydrological basins, where the hazard values (P95) are high (southern region) due to the fact that the natural soil cover act as a runoff regulator. An important factor to highlight is that 166 cities are concentrated in hydrological basins with high level of flood risk (central region) where the hazard and environmental vulnerability are also high. In the north of the state, the hazard and LUCC are less than 20mm and 20 %, respectively, indicating low level of risk for cities located in this region.
3.4 Proximity to urban areas
From flood records for the period 1970-2015 we determined the annual frequency of disasters related to floods that occurred in each studied city. We also estimated the distance between the bodies of water with an overflow record and the affected cities. With these data, we established five levels of p: ≤ 100, 100 to 300, 300 to 500, 500 to 1000 and ≥ 1000 meters. According to our results, about 68 % of the cities with high flood records are located less than 1000 meters from a body of water, while for the 32 % that have low frequency of floods p >1000 meters. Although a spatial pattern of proximity values cannot be established, it is important to note that the economic development of the state has been an important factor in the increase of urban areas in the hydrological basins where flood records due to river overflow have increased during the last 45 years, mainly due to the proximity of the population to bodies of water.
3.5 Evaluation of the R and RA models
With the objective of evaluating p as an element to assess risk due to urban floods in the State of Veracruz, we compared the results from the AR and the R models using data from urban flood events recorded in 210 selected cities. The AR’s results demonstrate great efficiency to reproduce the frequency of disasters associated with urban floods during the 1970-2015 period (Figure 4a). This model efficiently relates the high risk values (0.6 to 1.0) with the high frequency of disasters, while the results from the R model (Figure 4b) generated great dispersion of data. The Pearson correlation r = -0.05, demonstrates that R overestimates the flood risks for more than 50 % of the cities of Veracruz. On the contrary, the AR model, properly relates the low frequency of flood events (< 10) with very low risk levels (0.2).
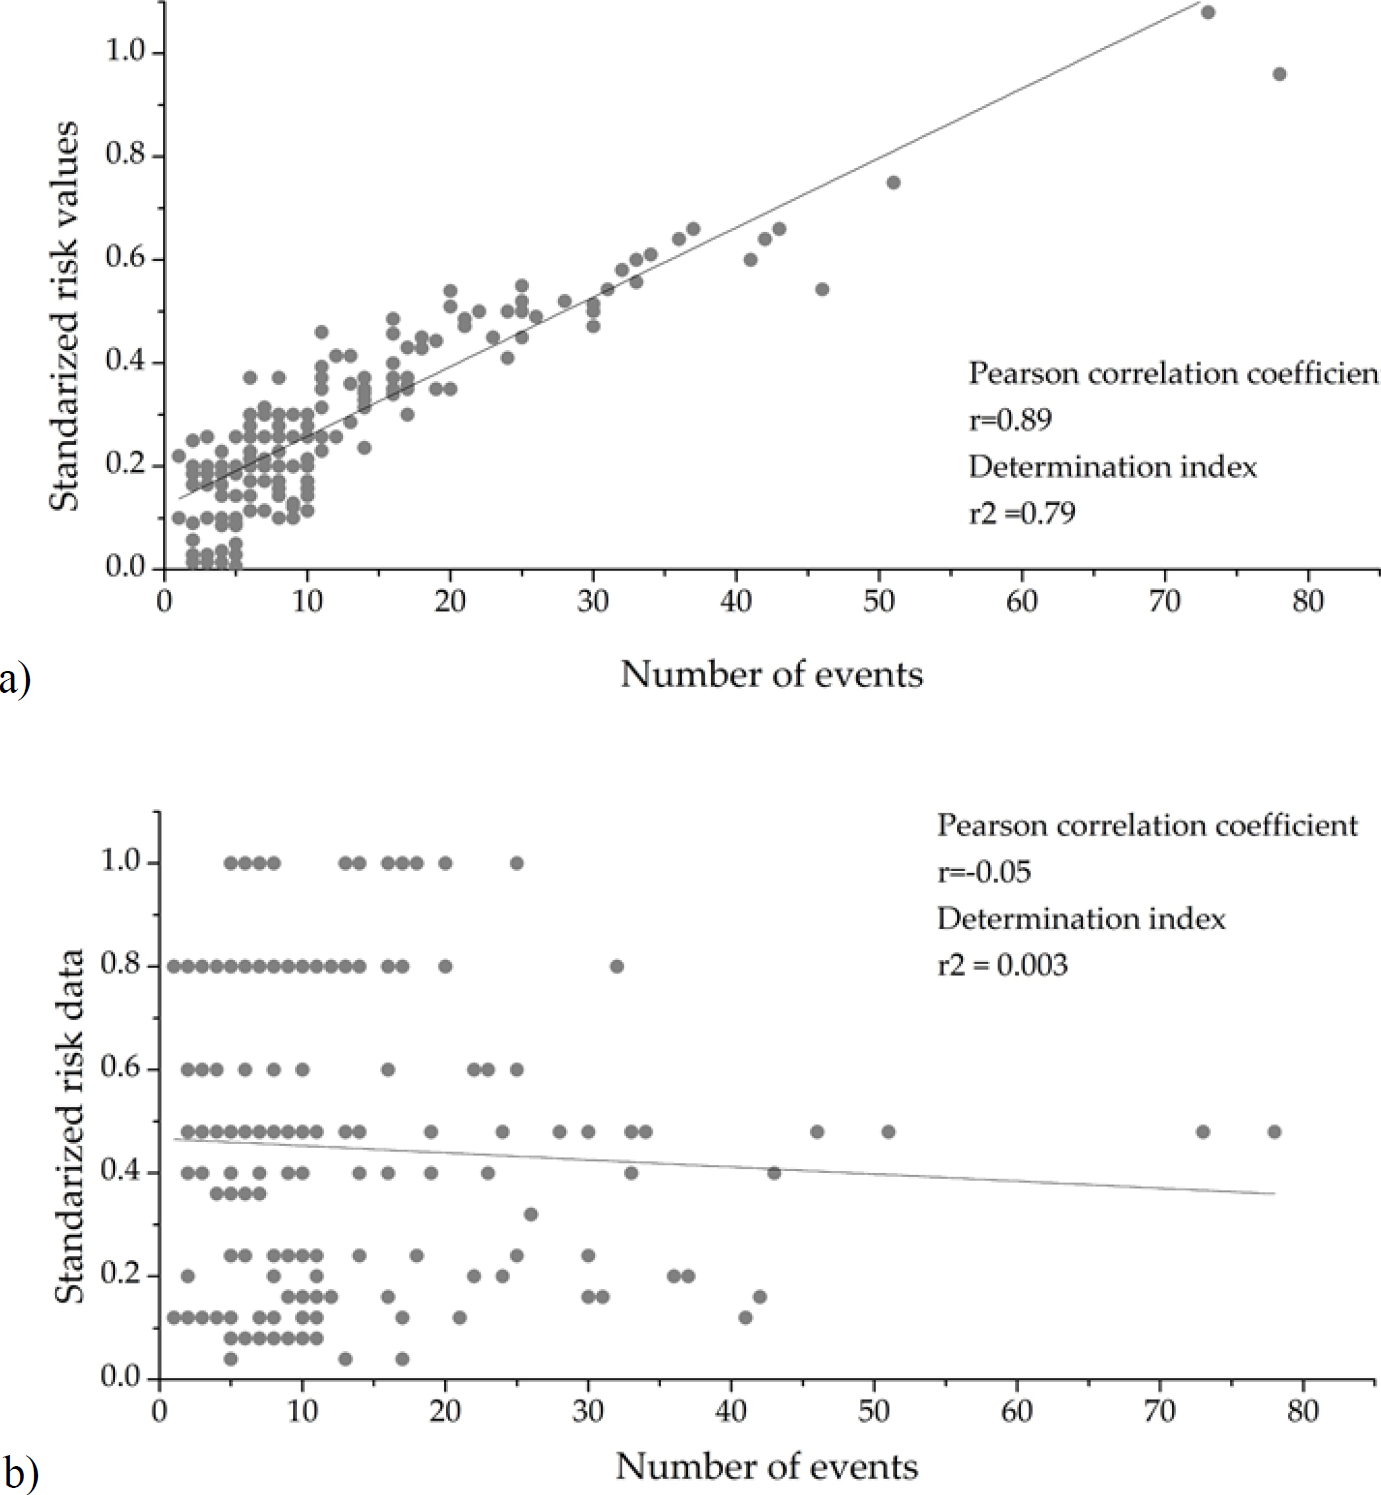
Note: Analysis using the AR (a) and the R (b) model for the Period 1970-2015.
Source: Own elaboration.
Figure 4 Pearson's correlation analysis carried out for 210 cities in the state of Veracruz.
Although the AR model shows adequate results, it is necessary to point out that flood frequency low than 20 and AR < 0.5 (moderate risk) are for non-coastal cities where the overflowing of rivers is the main cause of flooding. In coastal cities with more than 20 events and AR > 0.5 is associated to floods generated by: 1) storm surges, and 2) the effect of the LUCC due to the loss of wetlands. The Pearson correlation coefficient for the AR model is r = 0.89 (very high correlation) (Figure 4a). In general, we believe that AR is more efficient than R to describe the local dynamics of urban floods because AR considers the urban proximity to bodies of water.
As a result of correlating the risk values with the frequency of flood events (Figure 4a and b), the efficiency of the AR model was demonstrated to adjust the risk levels when proximity information (p) is used. Based on these results, we compared the spatial distribution of flood risk from the AR model used for the 210 cities of Veracruz (Figure 5) with the information from the R model used for the 81 hydrological basins (Figure 3c). Our results indicated that 20 % of cities (43) present a risk level from «Moderate» to «Very high», while the remaining 80 % (167) present a lower risk level, due to their low frequency of floods (< 20 events) in 45 years (1970-2015). Around 95 % of the cities with moderate-very high risk were located in regions II (center) and III (south) of the state, where the hydrological basins present the same risk condition (Figure 3c). The other 5 % showed different information, as observed in the southwest of region I (north), where the «High» risk of the R model (Figure 3c) is the result of combining hazard (Figure 3a) and environmental vulnerability (Figure 3b) of the hydrological basins, while the «Very low» and «Low» risk of the cities with the AR model (Figure 5) is associated with the distance to the water body and the low frequency of overflows (< 15 events) during the period analysis. This condition was present for regions II (center) and III (south), where 67 % of cities with «Very low» and «Low» risk are located in hydrological basins with a risk level ranging from «Moderate» to «Very high». This situation not only overestimates the level of flood risk in the cities of Veracruz, but also contributes to an incorrect spatial interpretation of risk. We consider that this situation may be mainly associated with the scale of analysis used (hydrological basin) with the Model R. Therefore, the AR model that we propose can improve risk assessment at a local scale, due to the inclusion of proximity values (p), generating independent levels of flood risk for each city of Veracruz, as shown with the spatial risk analysis (Figures 5 and 3c) and the correlation analysis between AR vs R (Figure 4a and b).
3.6 Application of the AR and R model: Case studies
When environmental or territorial boundaries are used to integrate hazard and vulnerability variables, it is possible to identify changes in flood risk when there are individual or combined variations of these variables. However, when the local flood risk is analyzed without considering urban proximity to water-bodies, the flood risk can be over-estimated.
The AR model was tested for the cities of Jamapa and Amatlán de los Reyes considering their similarity in intense rains (30mm and 37.6mm) and their level of environmental vulnerability (53.36 % and 49.13 %), however, they have different flood records (49 and 4). The Río Jamapa and Río Blanco basins, where the studied cities are located, were classified in this study with «moderate» to «very high» flood risk levels.
To facilitate our analysis and interpretation, the vulnerability, hazard, and risk estimates were standardized. For the city of Jamapa, the AR and R models correctly reproduce the frequency of floods (Figure 6a). We associate the result of the AR model with the proximity (< 200 meters) of the urban area to the Jamapa river. We believe that the result of the R model is due to the high values of hazard and environmental vulnerability used to represent the risk in the basin where this city is located. That is, the R model assigns these high values of the basin to the analyzed cities. In general, AR and R adequately modeled the hazard and the trend of environmental vulnerability with the frequency of urban floods for the period analyzed.
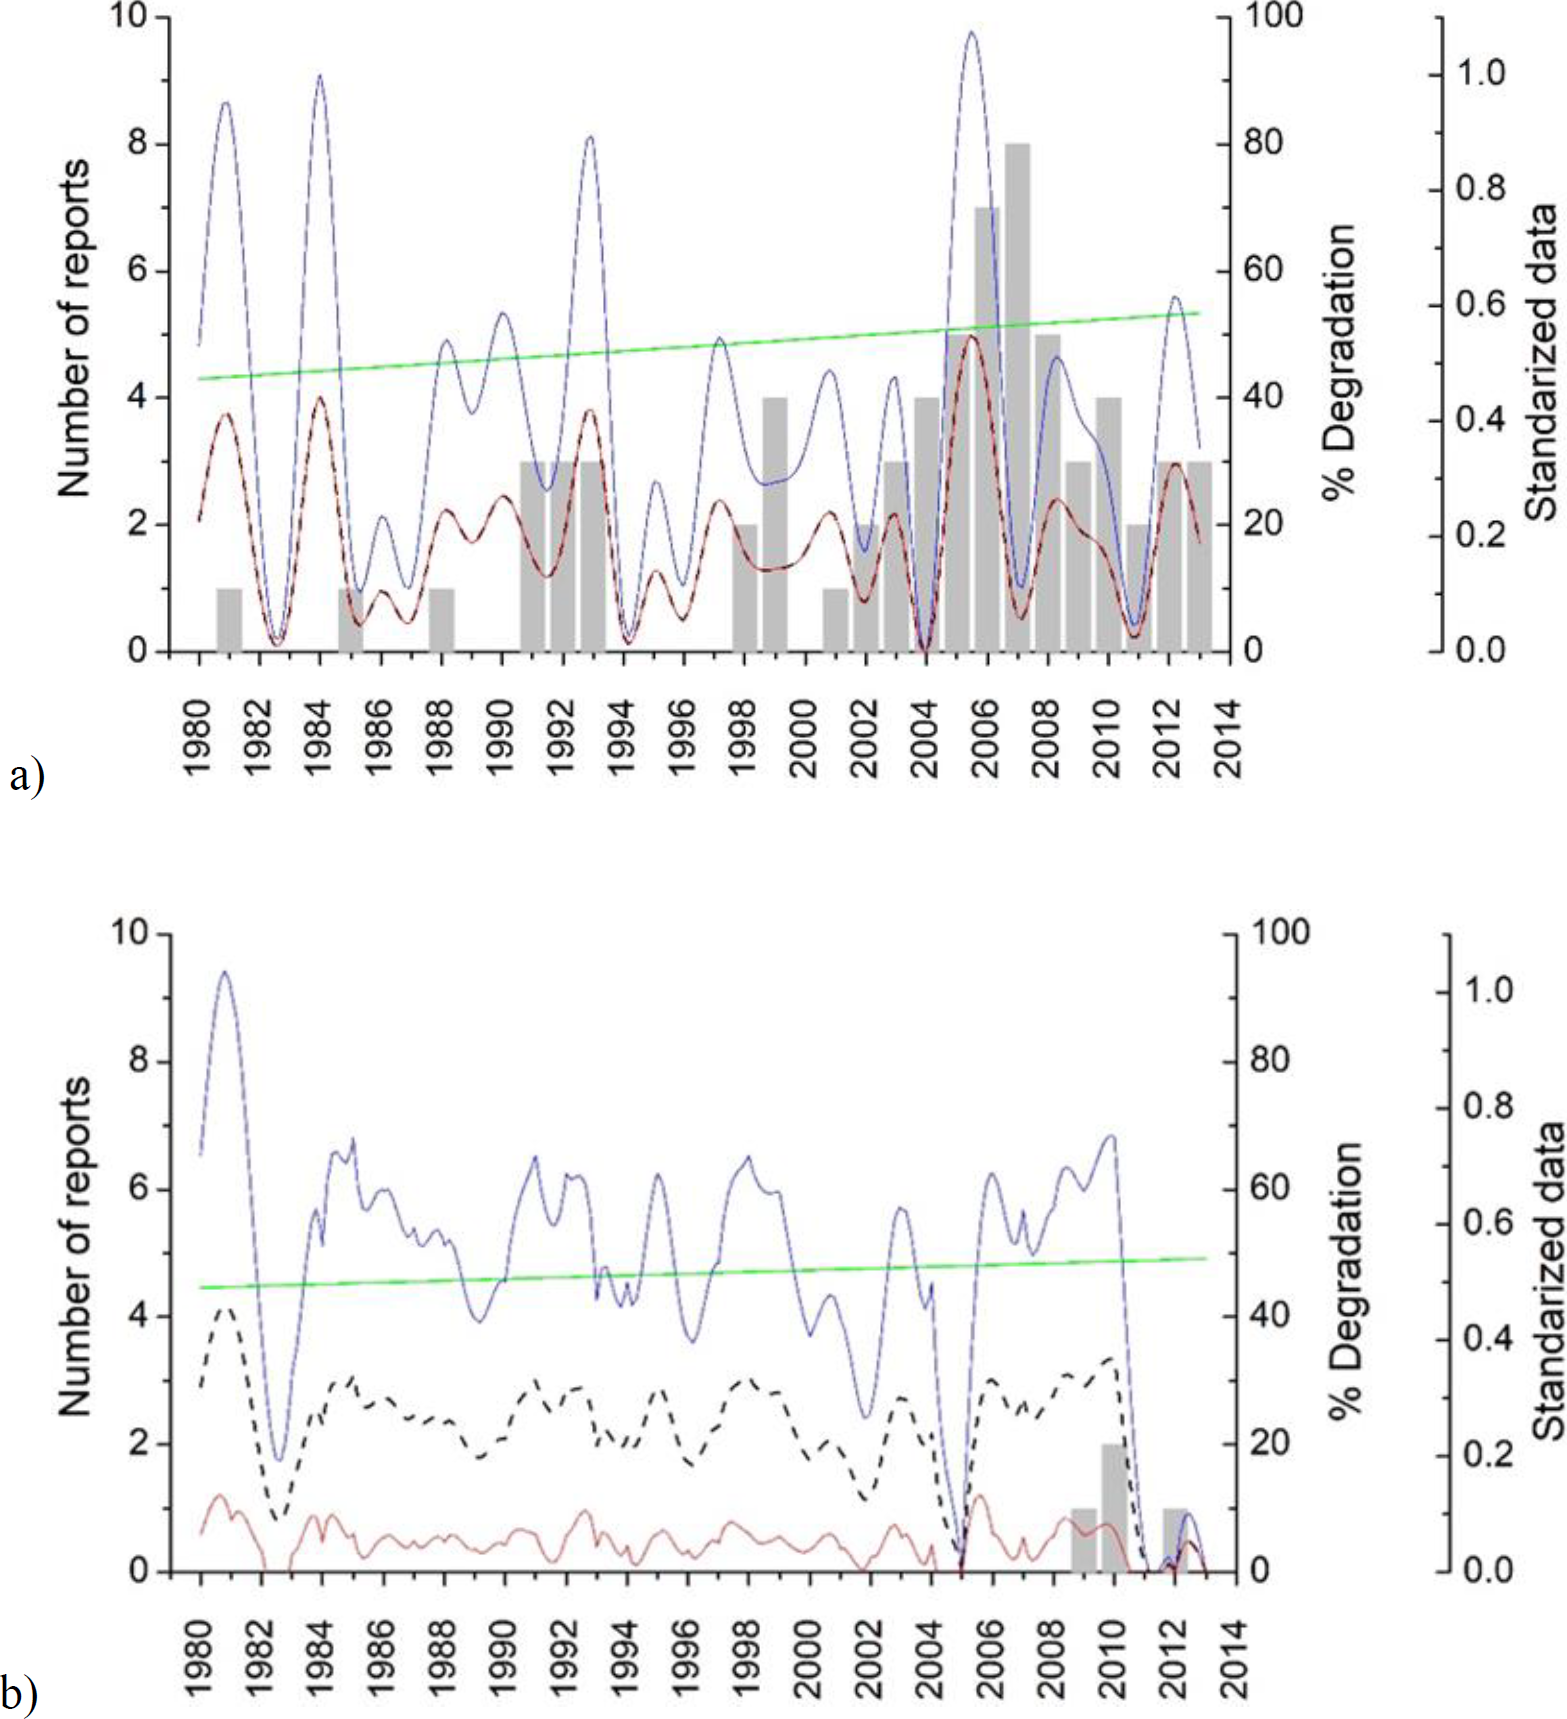
Note: Number of floods recorded for the period 1980-2014 (gray bar). Percentage of degradation in hydrological basins (solid green line). Standardized data: P95 heavy rain events (solid blue line) from the AR (solid red line) and the R (black broken line) models for a) Jamapa Basin, and b) Amatlán de los Reyes Basin.
Source: Own elaboration.
Figure 6 Comparison of AR and R models to reproduce the frequency of flood events for two cities in Veracruz, México.
When determining the risk for a city with low frequency of flood disasters, such as Amatlán de los Reyes, the AR model estimated low risk that could be the result of its long distance (> 2500 meters) to the Río Blanco river. This result is coincident with the low record of disasters for the city. On the other hand, the R model overestimates the frequency of floods in the city of Amatlán (Figure 6b). This may be because of the high levels of hazard that are frequent in the region (Dominguez & Magaña, 2018) and the environmental vulnerability used to determine the flood risk in the basin where the Amatlán city is located.
The AR model demonstrates the importance of using urban proximity to bodies of water for the analysis of local flood risk. We believe that AR can be used as a tool for local management of risk for current and future floods in Veracruz. However, it is necessary to integrate a large number of historical flood records to improve this type of analysis. It is also important to incorporate hydrological data to analyze the importance of surface runoff in the overflowing process of rivers (El Bastawesy et al., 2015; Shrestha & Kawasaki, 2020).
Due to the frequency and magnitude of floods associated with the environmental vulnerability (V) of the hydrological basins in Veracruz (Magaña et al., 2011; Haer et al., 2017), it is important to integrate detailed and updated information on urban areas and population settlements regarding the level of degradation of the basins by LUCC because it is an important element for proper assessment of flood risk. Additionally, it is necessary to determine the present condition of the wetlands and the effect of storm surges on urban floods.
We believe that the AR model can be applied in different regions of Mexico due to its high resolution to adjust regional flood risk values (hydrological basins) to a local scale (cities). This model also makes it possible to take advantage of previously generated information on risk floods avoiding overestimating the level of urban floods risk, where the frequency is generally low.
4. Conclusions
The analysis of the hazard associated to intense rains (P) and the environmental vulnerability (V) carried out for 81 hydrological basins of Veracruz, allowed us to establish that the central and southern regions of the state concentrate the highest levels of flood risk. It was also possible to recognize that individual or combined changes in P and V contribute to the spatial distribution of flood risk levels. However, these types of regional studies show disadvantage when analyzing the local risk of flooding.
As a result of comparing the AR and R models with the frequency of disasters for 210 cities in Veracruz, we conclude that the urban proximity to bodies of water allows adjusting the level of local flood risk in communities where the frequency of disasters is low. This was observed in the analysis carried out for the city of Amatlán de los Reyes, where the R model generated higher risk values than those indicated by the flood records, while AR provided better results. For the city of Jamapa AR and R efficiently reproduce the frequency of flood events mainly because of the high values of hazard, environmental vulnerability as well as the reduced distance between the city and the Jamapa River (<200 m).
Our findings demonstrates that urban proximity to bodies of water is an element that contributes to the evaluation of flood risk at the local level, due to the adjustment shown in the risk values with an R-type model. Therefore, it can be concluded that the AR model proposed is an important tool for flood risk management.


 nueva página del texto (beta)


