


 texto en
  Inglés (pdf)
 Artículo en XML
 Referencias del artículo
 Enviar artículo por email
 Citado por SciELO
  Similares en
SciELO
Similares en
SciELO 
 Permalink
Introduction
Forest management planning is based on growth and yield systems for estimating and projecting forest species development, which considers assumptions and restrictions to estimate the wood supply through forest management systems (Sharma & Reid, 2018). In Mexico, forest management is immersed in several contexts as ecological, socio-cultural, political, economic, technological and silvicultural. These aspects have taken the use of the forest with different purposes and schemes of management. The diversity of these aspects in which forest areas are immersed has given rise to strategies and methods for the forest resources management (Torres-Rojo, Moreno-Sánchez, & Mendoza-Briseño, 2016).
The forest management is based on two main methods or systems: (1) rotational forest management (RFM) characterized by practicing standard silvicultural treatments (three or four thinning) and repetitive short cycles of regeneration followed by natural regeneration or planting; and (2) continuous cover forestry (CFC) including selection cutting and natural regeneration (Pukkala & Gadow, 2011). In Mexico, RFM and CFC methods are called the Method for Silvicultural Development (MSD) and the Mexican Method of Irregular Forest Regulation (MMIFR), respectively (Torres-Rojo et al., 2016).
Growth and yield of mixed-species stands has become an important issue in forestry research because they provide functions and services to society. An important component in the modeling of growth and yield is the assessment of site quality potential of forests and stands (Allen & Burkhart, 2015; del Río et al., 2016). Quantification and prediction of stand productivity is a key question of forest research, with obvious implications for management and planning. Site productivity describes a highly complex genetic trait with several interconnected physiological and biochemical processes that are modified by natural aspects and silvicultural treatments (Sharma, Subedi, Ter-Mikaelian, & Parton, 2015; Yue, Kahle, von Wilpert, & Kohnle, 2016). These aspects reflect the inherent characteristics for specific site such as soil and climate that are directly related to forest productivity (Antón-Fernández, Mola-Yudego, Dalsgaard, & Astrup, 2016).
The estimation of forest productivity is relevant for forest management and ecological studies in terms of accurate assessments of site conditions (Seki & Sakici, 2017), such estimation is the baseline for planning silvicultural treatments (Sharma & Parton, 2018). With the development of technology, numerical calculation techniques, and increased information on height growth processes, site index (SI) modeling has become a topic of interest in forestry research (Seki & Sakici, 2017). This is an important feature for forest management and growth modelling, especially with respect to ongoing environmental changes (Yue, Mäkinen, Klädtke, & Kohnle, 2014). SI is the value of dominant height at a reference age (Clutter, Fortson, Pienaar, Brister, & Bailey, 1983), it can include the average height of dominant or co-dominant trees at a base age and it is used extensively to estimate the productivity of commercial species (Sharma & Reid, 2018). SI is the most common measure of forest productivity and the most used in forestry research; it is also used as baseline for forest planning levels and the formulation of silvicultural strategies (David et al., 2015; Watt, Dash, Bhandari, & Watt, 2015). This method has been the most popular for assessing productivity in mixed-species stands in Mexico (Quiñonez-Barraza et al., 2015; Vargas-Larreta et al., 2017). SI is generally determined by field measurements and is typically estimated from height measurements within the plot or at stand level (Watt et al., 2015). SI curves are generally developed from one of the following three data sources: (1) stem-mapped plots, (2) stem-mapped measurement plots and (3) stem analysis data. Allen and Burkhart (2015) consider that stem-mapped sampling plots are the best source of data for modeling the height-age relationship; however, due to time and cost constraints, data from stem-mapped temporary sampling plots and stem analyses are suitable for fitting dominant height growth equations.
Forestry treatments influence growth and development of stands and forests after harvest, and height growth models are necessary to reflect a range of potential outcomes for specific seasonal qualities (Costa, Calegario, Araújo, Pereira, & Garcia, 2018; Sharma & Parton, 2018). Common methods for modeling dominant height growth and SI are based on the algebraic difference approach (ADA) and the generalized algebraic difference approach (GADA). In the first case, a growth model can be fitted to estimate parameters and then one of these is assumed to be dependent on SI to generate anamorphic and polymorphic growth curves. These equations have the capacity to represent invariant base age models and invariant path simulation (Bailey & Clutter, 1974). GADA equations can be used to derive truly invariant base age equations. These equations have the ability to describe concurrent polymorphism and variable asymptotes, which is an important property in SI equations that should be considered in the modeling of individual trees trends growth (Cieszewski & Bailey, 2000).
Most of the forests in Durango, Mexico, are dominated by uneven-aged and mixed-species stands with species of the Pinus, Quercus, Juniperus and Arbutus genus, but forest management focuses mainly on Pinus and Quercus (Quiñonez-Barraza, Zhao, De los Santos Posadas, & Corral-Rivas, 2018). Main productivity studies in mixed-species stands have focused on the genus Pinus, because its species are the most important in terms of timber production (Quiñonez-Barraza et al., 2015). Quercus species play an important role in natural, ecological and timber production dynamics of mixed-species forests, so the study of this genus is also desirable. The objectives of the study were to develop mean annual increment and current annual increment models for Quercus sideroxyla Bonpl.; to build height growth trajectories from a taper data with the estimated age at upper heights in each tree; and to fit three ADA and one GADA equation to the height growth trajectories and generate site index curves.
Materials and methods
Study area
Data was generated in mixed-species stands of the polygon called “Ejido San Diego de Tezains” (24° 48′ 16.98′′ - 25° 13′ 47.25′′ N and 105° 53′ 9.81′′ - 106° 12′ 52.58′′ W) in Durango, Mexico (Figure 1). Predominant climates are temperate, warm humid and temperate sub-humid climate, with an average annual rainfall of 840 mm. The average annual temperature ranges from 8 to 24 °C (García, 2004; Quiñonez-Barraza et al., 2019). The total area of the polygon is 62 802 ha, of which 26 038 ha are using for timber production. Mixed-species stands are represented by species of the genus Pinus, Quercus, Juniperus, Cupressus, Pseudotsuga, Arbutus and Alnus (Quiñonez-Barraza et al., 2018). This study was conducted in mixed-species stands where Q. sideroxyla is dominant over species of the genus Pinus.
Description of the data
The database to fit the approximate model of dominant height and SI considered two sources of information. The first was based on 29 stem-mapped measurement sampling plots established in 2008 with a symmetrical grid of 3 km × 3 km that were remeasured in 2013 (Figure 1). Each 50 m × 50 m rectangular plot was divided into four 25 m × 25 m quadrants. The heights of all Q. sideroxyla trees were considered in thestem-mapped measurement and remeasurement plots. The second source of information included the taper analysis of 37 trees (Figure 1). In the taper analysis, each tree was cut, and four measurements were taken before the section of the diameter at breast height at 1.3 m. Subsequently, heights and diameters were measured every 2 m, and the last measurement was taken before the total height of each tree (Quiñonez-Barraza et al., 2019) to estimate the age of the commercial height-diameter relationship. The variables for the two sources of information are summarized in Table 1.
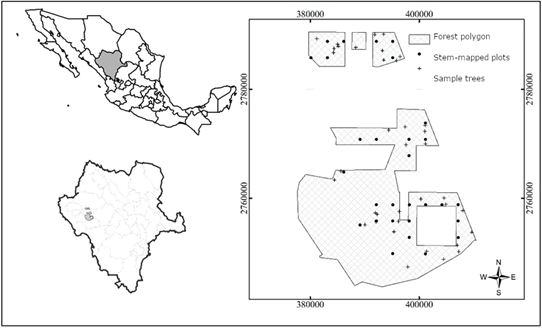
Figure 1 Study and location area of stem-mapped remeasured plots and sampled trees for taper analysis in Durango, Mexico.
Table 1 Descriptive statistics of databases used in the adjustment of equations of increment and height growth of Quercus sideroxyla.
| Base | Variable | n | Statistics | |||
|---|---|---|---|---|---|---|
| Minimum | Maximum | Average | SD | |||
| 1 | dbh1 (cm) | 425 | 5.41 | 71.50 | 18.12 | 12.92 |
| dbh2 (cm) | 425 | 7.40 | 73.30 | 19.64 | 13.17 | |
| H1 (m) | 425 | 1.35 | 21.80 | 7.94 | 3.87 | |
| H2 (m) | 425 | 2.40 | 25.70 | 9.81 | 4.03 | |
| dbhInc5 (cm) | 425 | 0.40 | 5.50 | 1.52 | 0.81 | |
| HInc5 (m) | 425 | 1.00 | 4.00 | 1.87 | 0.72 | |
| 2 | H (m) | 37 | 6.60 | 23.00 | 12.39 | 4.30 |
| dbh (cm) | 37 | 12.00 | 52.00 | 28.05 | 11.07 | |
| d (cm) | 485 | 0.00 | 67.00 | 21.39 | 12.66 | |
| h (m) | 485 | 0.07 | 23.00 | 5.87 | 4.93 | |
| EA (years) | 485 | 1.00 | 88.00 | 25.49 | 18.18 | |
dbh1 = diameter at breast height measured in 2008; dbh2 = diameter at breast height measured in 2013; H1 = total height measurement in 2008; H2 = total height remeasured in 2013; dbhInc5 = in diameter at breast height increment in five years; HInc5 = height increment in in five years; H = total height; d = diameter at upper height h; h = upper diameter at height d; EA = estimated age for a specific upper height in the taper analysis data; n = number of observations; SD = standard deviation.
Model derivation
Tree age is a critical factor in ecology and forestry studies (Fraver, Bradford, & Palik, 2011). Accurate age estimation is a methodological constraint on plant population dynamics and is difficult to measure in the absence of growth sections or growth cores (Rozas, 2003). Due to this condition, in the taper analysis of Q. sideroxyla, the database did not consider the number of growth rings in each cutting section, because they are difficult to differentiate in this species. Therefore, the number of rings or age in the cross section of the diameter at breast height (1.3 m) was estimated for upper heights in the taper analysis data. An average increment model based on the measurement (2008) and remeasurement (2013) of the 29 stem-mapped plots was developed to evaluate the annual increment in height. The model considered the five-year mean annual increment (MAI) and the mathematical formula was proposed to fit the current annual increment (CAI) in height (equation 1).
where,
CAI hij o MAI/5 |
current annual increment in height (m·year−1) of the j th tree of the i th plot |
h ij(t+a) |
remeasurement height (m) of the j th tree in the i th plot at the time (t + a); in this case a = 5 years |
h ij(t) |
measurement height (m) in the j th tree of the i th plot at the time t |
ε ij |
error of the j th tree in the i th plot |
ß 0 and ß 1 |
parameters to be estimated. |
The number of years between two pairs of upper heights at upper diameters based on taper analysis was estimated with the following equation:
where,
NA jk |
number of rings or year of the k th height measured in the j th tree |
h jk(t) |
measurement of the k th upper height in the j th tree, at the time t (t is unknown) |
h jk(t-1) |
measurement of the k th upper height in the j th tree at the previous time t ( |
The growth trajectories in the taper data were constructed with the estimated age for each upper height of each tree. Partial or total age was estimated by NA accumulation and was determined by equation 3, where EE jk is the estimated age for k th upper height in the j th tree.
With reconstructed measurements of age in taper data, approximate equations of dominant height growth and SI were developed. Three ADA equations (Bailey & Clutter, 1974) based on the Chapman-Richards growth function (Richards, 1959) and the GADA equation (Cieszewski & Bailey, 2000) reported by Quiñonez-Barraza et al. (2015) were used to fit the dominant height growth and SI. The first ADA equation assumes variable maximum potentiality with constant growth rates (anamorphic form) and the other two ADA equations assume variable growth rates and common asymptote (polymorphic form), while the GADA equation assumes complex polymorphism. All equations were based on equation 4; ADA and GADA equations are represented by equations 5 to 8.
where,
H jk |
k th height in the j th tree |
t jk |
k th estimated age in the j th tree |
α 1 |
parameter of the upper asymptote |
α2 |
growth rate parameter |
α3 |
exchange rate parameter. |
where,
|
dominant height of the k th measurement in the j th tree in stage 2 |
|
dominant height of the k th measurement in the j th tree in stage 1 |
EE jk2 and EE jk1 |
estimated age of the k th measurement of the upper height in the j th trees in stage 1 and 2 in an overlapping database |
ß i (i = 1, 2, 3) |
parameters to be estimated, which were reformulated from the base model for each equation |
The approximate SI models for each ADA (equations 5 to 7) and
GADA equation (equation 8)
represent the change of
Fitting and evaluation of equations
The nonlinear least squares (NLS) and generalized nonlinear least squares (GNLS) technique of the NLME package (Pinheiro, Bates, DebRoy, & Sarkar, 2015) of the R software (R Development Core Team, 2017) were used to fit the CAI equation for height and ADA and GADA equations, respectively. The CAI equation for height was adjusted for all Q. sideroxyla trees and for each crown class condition. In this case, the crown position procedure proposed by Bechtold (2003) with the superposition, overlapping, and subposition categories was made compatible with the crown size procedure proposed by Meadows, Burkhardt, Johnson, and Hodges (2001) with dominant, intermediate, and deleted categories. ADA and GADA equations were fitted using an overlapping database of commercial height and estimated age for each tree. In addition, the variance was modeled with an exponential function of estimated age covariates (VarExp) to correct heteroscedasticity, while a moving average autoregressive correlation structure (corARMA 1, 1) was used to model the error dependence within each tree (Pinheiro & Bates, 2000). The residual values were used to estimate six statistics that allowed us to evaluate the accuracy of the fitted equations: root mean square error (RMSE), adjusted coefficient of determination (R2), log-likelihood (LogLik), Durbin-Watson test (DW), Akaike’s information criterion (AIC) and mean bias (E).
Results and discussion
Table 2 shows the estimated parameters and height fit statistics of the CAI model for all Q. sideroxyla trees (equation 1) and for each crown position class (dominant, intermediate and suppressed). Fitting statistics showed the models’ ability to predict height CAI. Height CAI equations, the number of years between two commercial height measurements (equation 2) and the estimated age equation (equation 3) allowed to construct the growth trajectories in the taper data. The equations developed from height CAI, with data from stem-mapped remeasured plots, showed suitable goodness of fit by class of tree crown position proposed by Bechtold (2003) and for all tree crown positions. This is because crown classes based on tree position in canopy are difficult to classify in mixed stands and hardwood species such as Q. sideroxyla. The highest value of R2 was observed for the suppressed tree crown class and the lowest for the intermediate crown class, with values of 0.9705 and 0.9620, respectively. Moreover, the lowest RMSE value was obtained for the suppressed class and the highest value for the dominant class. When height CAI equation was fitted for the set of the three crown classes, the statistics showed suitable statistical precision with all degrees of freedom from the entire data of stem-mapped remeasured plots. Therefore, the latter procedure was used to estimate the age of the height-diameter relationship of the taper data.
Table 2 Estimated parameters and fitting statistics for the equations of current annual increment (CAI) in height of Quercus sideroxyla.
| Equation | Parameter | Estimator | EE | n | RMSE (m·year⁻1) | R2 | AIC | LogLik | E (m·year⁻1) |
|---|---|---|---|---|---|---|---|---|---|
| 1-D | ß0 | 0.1927 | 0.0054 | 80 | 0.0297 | 0.9661 | −331 | 168 | 3.2 x 10⁻¹¹ |
| ß1 | 0.0445 | 0.0009 | |||||||
| 1-I | ß0 | 0.1934 | 0.0045 | 95 | 0.0272 | 0.9620 | −411 | 208 | −5.8 x 10⁻¹¹ |
| ß1 | 0.0451 | 0.0009 | |||||||
| 1-S | ß0 | 0.2017 | 0.0024 | 250 | 0.0242 | 0.9705 | −1147 | 576 | −5.5 x 10⁻¹¹ |
| ß1 | 0.0429 | 0.0005 | |||||||
| 1 | ß0 | 0.1984 | 0.0020 | 425 | 0.0261 | 0.9676 | −1890 | 984 | −5.0 x 10⁻⁷ |
| ß1 | 0.0437 | 0.0004 |
1-D, 1-I and 1-S = height CAI models for the dominant, intermediate and suppressed crown classes, respectively; EE = standard error; n = number of observations; RMSE = root mean square error; R2 = coefficient of determination; AIC = Akaike’s information criterion; LogLik = log- likelihood; E = average bias.
The estimated parameters for ADA and GADA equations and the fitting statistics are shown in Table 3. All parameters were significantly different from zero at a significance level of 1%. The polymorphic equation I (equation 6) generated a higher value of the asymptote parameter (53.09 m) than the polymorphic equation II (44.23 m). The three ADA equations showed consistent results, but the polymorphic equation II (equation 7) had the best results according to the fit statistics (lower values of RMSE, E and AIC and higher values of R2 and LogLik). However, the GADA equation was better than the polymorphic equation II because it provided more desirable fit statistics for RMSE, AIC, LogLik and E. In parallel, the estimated parameters of the variance function (varExp) and the autocorrelation structure (corARMA 1, 1) are shown in Table 3. This structure allowed correcting the assumptions of heteroscedasticity and autocorrelation with time series data used in the fitting of the equations, through generalized nonlinear least squares (Pinheiro & Bates, 2000; Pinheiro et al., 2015). Similar functions to correct these regression assumptions were used by Quiñonez-Barraza, García-Espinoza, and Aguirre-Calderón (2018), Sharma and Parton (2018), Quiñonez-Barraza et al. (2015) and Rodríguez-Carrillo, Cruz-Cobos, Vargas-Larreta, and Hernández (2015) in ADA and GADA dynamic equations for Pinus teocote Schiede ex Schltdl. & Cham., Pinus and Picea species, Pinus species and Juniperus species, respectively.
Table 3 Estimated parameters and fitting statistics of the growth equations of Quercus sideroxyla.
| Equation | Parameter | Estimator | EE | RMSE (m) | R2 | DW | AIC | LogLik | E (m) |
|---|---|---|---|---|---|---|---|---|---|
| ADA1 |
|
0.0062 | 0.0022 | 0.4372 | 0.9918 | 1.75 | 409.21 | −198 | −0.0210 |
|
|
1.2762 | 0.0286 | |||||||
|
|
0.1797 | 0.1355 | |||||||
|
|
0.7204 | 0.8568 | |||||||
|
|
0.0778 | 0.0078 | |||||||
| ADA2 |
|
53.0939 | 12.3286 | 0.4295 | 0.9921 | 1.82 | 400.85 | −194 | −0.0076 |
|
|
1.3106 | 0.0299 | |||||||
|
|
0.2049 | 0.1379 | |||||||
|
|
0.5221 | 0.5175 | |||||||
|
|
0.0756 | 0.0077 | |||||||
| ADA3 |
|
44.2324 | 8.2474 | 0.4256 | 0.9923 | 1.64 | 370.82 | −179 | −0.0015 |
|
|
0.0111 | 0.0022 | |||||||
|
|
0.2176 | 0.1020 | |||||||
|
|
0.9998 | 1.0176 | |||||||
|
|
0.0857 | 0.0082 | |||||||
| GADA |
|
4.8076 | 0.5614 | 0.4255 | 0.9923 | 1.74 | 369.55 | −178 | −0.0008 |
|
|
−0.7348 | 0.1941 | |||||||
|
|
0.0121 | 0.0022 | |||||||
|
|
0.1753 | 0.0451 | |||||||
|
|
0.8196 | 0.0460 | |||||||
|
|
0.0196 | 0.0033 |
EE = standard error of the parameter; RMSE = root mean square error;
Figure 2 shows that the growth curves for each SI class at a base age of 60, which followed the growth trajectories of Q. sideroxyla. The polymorphic equation II modeled the dominant height and SI better than the other two ADA equations, but the GADA equation had better SI curves on the growth trajectories at height. In the case of the polymorphic ADA equations, the growth curves showed different rates between each SI curve and common asymptotes, while the anamorphic ADA equation had similar growth rates between the SI curves with variable asymptotes. On the other hand, the GADA equation showed SI curves with complex polymorphism.
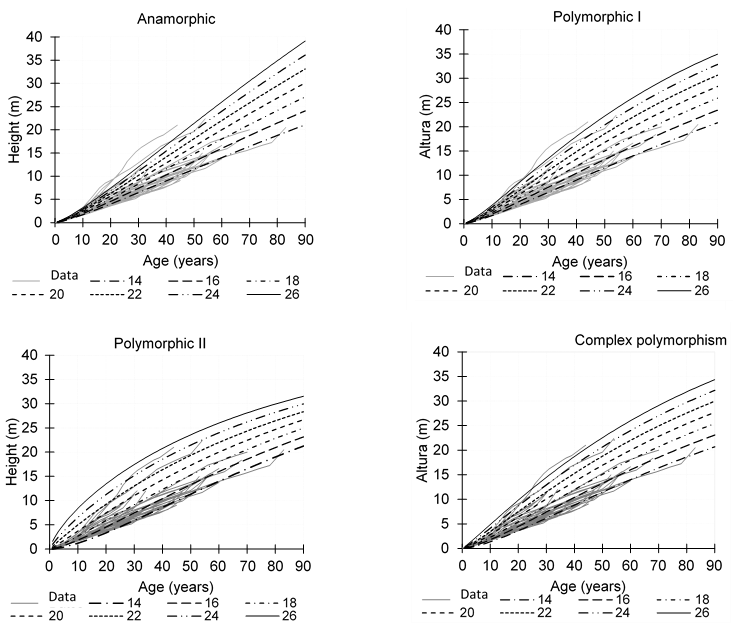
Figure 2 Site index curves with the ADA equations (anamorphic and polymorphic I and II) and GADA equation (complex polymorphism) for Quercus sideroxyla at the base age of 60 years.
Although height growth was assumed to be constant between every two measurements in the taper data, the ADA equations represented the anamorphic and polymorphic SI curves for upper stem heights measured at in the taper analysis. The SI curves are invariant to the reference age; if the base age is modified, curves are equivalent and the polymorphic shapes (non-proportional SI curves with different relative growth rates) show different growth rates at the base age of 60 years (Bailey & Clutter, 1974). The ADA equations are easy to apply, can predict growth at height and generate SI curves with the same formulation, and their estimated parameters are dynamic (Sharma & Parton, 2018). According to fit statistics, the polymorphic equation II (equation 7) was greater to the other two ADA equations (Table 3). This ADA equation showed the highest value in the R2 and LogLik statistics and the lowest value in RMSE, AIC and E statistics; but in the SI curves, the classes of 22 m to 26 m overestimated the growth trajectories in height (Figures 2 and 4). In the ADA equations, the polymorphic equation I (equation 6) was more realistic for modeling the dominant height growth trajectories. Alternatively, the GADA equation outperformed the ADA equations by showing larger values in the LogLik statistic and smaller values in the AIC (Table 3). The GADA equation (equation 8) represents the concurrent ability to express asymptotic variables and polymorphism in SI curves (Cieszewski & Bailey, 2000); this equation considered the parameters of the upper asymptote and the rate of change as site-specific (Quiñonez-Barraza et al., 2015). In this study, the SI classes were similar to the dominant height growth curves proposed by Quiñonez-Barraza et al. (2015) for Pinus arizonica Engelmn, Pinus durangensis Martínez, Pinus teocote Schltdl. & Cham., Pinus leiophylla Schiede ex Schltdl. & Cham. and Pinus ayacahuite Ehrenb. ex Schltdl. in the same mixed-species stands and at the same reference age (60 years). The developed dynamic equations and IS curves are biologically realistic because Pinus and Quercus species share growth space and there is intensive competition between species (Quiñonez-Barraza et al., 2018). Although the interpretation of SI equations under multispecies and uneven age stand conditions may be complex under traditional definitions, the estimated SI for the height-age relationship remains the most common implementation (Westfall, Hatfield, Sowers, & O'Connell, 2017).
The CAI and MAI curves for each SI classes are shown in Figure 3. With ADA anamorphic equations, CAI and MAI curves showed increases in constant height and the optimal growth in height was represented at 76 years for all SI classes at a reference age of 60 years. In the polymorphic equation II, the SI classes of 22 to 26 m did not show a good fit to the data and they were collapsed, which was assumed due to the overestimation of the growth trajectories for these SI classes. CAI and MAI curves were better with the polymorphic equation I than with the polymorphic equation II; however, the GADA equation showed the increment curves better than ADA equations, and the optimal growth in height for each SI class was more realistic.
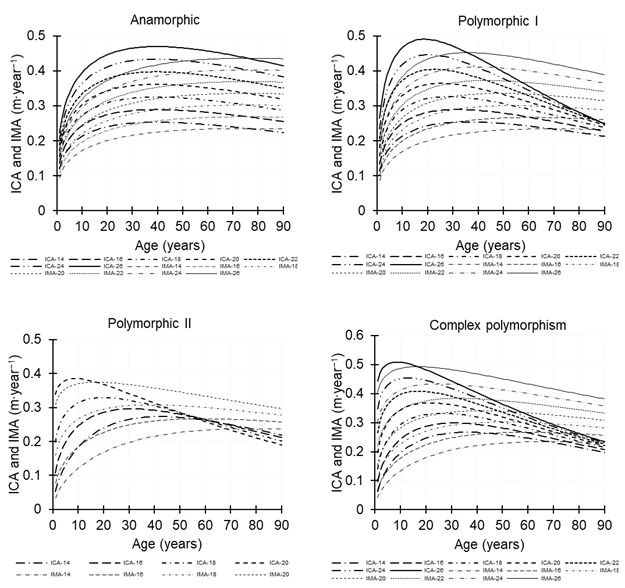
Figure 3 CAI (current annual increment) and MAI (mean annual increment) curves for the site index classes with ADA (anamorphic and polymorphic I and II) and GADA (complex polymorphism) equations for Quercus sideroxyla at the base age of 60 years.
Residual values versus predicted values showed the trends of the deviations for each ADA and GADA equation (Figure 4). A small overestimate was observed in the residual plots for most cases of the mean height classes.
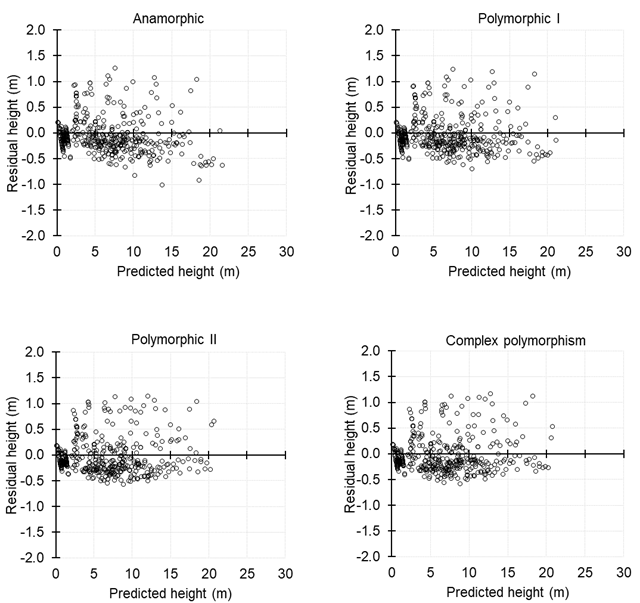
Figure 4 Residual values against height predictions with anamorphic and (polymorphic ADA equations I and II) and GADA (complex polymorphism) for Quercus sideroxyla.
The developed height growth equations can predict and project growth at ages greater than the base age used, because the maximum estimated age was 88 years and is compatible with the forest rotation. This feature is important in forest rotation management systems (Pukkala & Gadow, 2011; Quiñonez-Barraza et al., 2018) of the selected trees dominant and co-dominant to carry out this study, which coincides with the point made by Allen and Burkhart (2015). In addition, the equations consider more realistic estimates of local productive capacity and, therefore, reliable SI estimates for mixed-species stands. Dominant height growth equations and SI developed with the GADA methodology are desirable in forest management and planning situations (Kahriman, Sönmez, & Gadow, 2018).
The computational advantages and flexibility of ADA and GADA equations allow their use and application in forest management (García, 2011). Forest managers can use the ADA and GADA equations fitted in this study to define the most appropriate regimes of Q. sideroxyla with different forest management objectives; furthermore, they should consider productive capacity as the SI in forest growth and production diagnostic models as an input variable (Costa et al., 2018; Westfall et al., 2017). To estimate the age and then the SI at a base age, it is recommended to take at least five measurements of stem height; the application of the best ADA and GADA equations (equations 6 and 8, respectively) will depend on the estimated age for each subject tree.
Conclusions
The site index for qualifying the productivity of mixed-species stands with dominance of Quercus sideroxyla can be estimated with the equations developed in this study; the application depends on the use of a model of current annual increment in height. To do this, it is necessary to estimate at least five measurements of height between the ground and the total height and then estimate the total age with the mean increment equations in height. The GADA equation represented best the growth trajectories in the site index classes and increment curves; for this reason, it is recommended to estimate the height growth and site index of Q. sideroxyla in mixed-species stands. The developed equations of height growth and site index can be used in the informed decision making of forest management in mixed-species stand, in order to allow the balance of tree diversity, resistance and resilience of these ecosystems to climate change.

