Introduction
The genus Stevia has 116 species in Mexico, of which 107 are endemic (Villagómez-Flores, Hinojosa-Espinosa, & Villaseñor, 2018). Of these, Stevia rebaudiana (Bertoni) Bertoni is the most studied for its sweetening properties (Goyal, Samsher, & Goyal, 2010), while Stevia pilosa Lag. is used as an ornament and in herbalism for its pharmaceutical potential (Villavicencio & Pérez, 2006). Some species of Stevia have been collected and analyzed to identify their compounds (Álvarez et al., 2005; García & Pereda, 2002; Hernández, Catalan, & Joseph-Nathan, 1998) and some properties of the soil and climate where they grow.
Edaphoclimatic information on the places where S. pilosa grows is scarce. Some reports indicate that this plant is found at elevations between 2 300 and 4 000 m, with rainfall between 700 and 1 200 mm per year (Calderón & Rzedowski, 2005), or between 1 800 and 3 200 m with flowering from June to October (Villagómez-Flores et al., 2018). Soejima et al. (2017) indicate that the species grows in Pinus and Quercus forests and at sites with an accumulation of organic matter on the surface horizon and with varying degrees of decomposition. Unlike S. pilosa, there are many studies on S. rebaudiana that show that the geographic area of growth influences the nutrient concentration and quality of steviosides (Khiraoui et al., 2017). The characteristic physiology of the genus Stevia allows the plant to adapt easily to changes in climate and habitat. Jarma, Rengifo, and Araméndiz-Tatis (2006) evaluated the response of Stevia to radiation levels according to the site and found differences in plant size and flower development.
The species S. pilosa grows wild in Hidalgo, Mexico (Calderón & Rzedowski, 2005). This state is characterized by tropical, temperate and dry climates, and elevations of 100 to 3 000 m, due to the presence of three physiographic provinces (Instituto Nacional de Estadística y Geografía [INEGI], 2015). This means that S. pilosa has adapted to different soil-environmental conditions (Molina, Galván, Patiño, & Fernández, 2012), due to which growth, metabolite concentration, and nutrient content are believed to be different.
The efficiency of a plant for tissue production as a function of time can be measured through growth indices (Azarpour, Moraditochaee, & Bozorgi, 2014). This information enables quantifying the demand of any organ, in situ photosynthetic activity and its relationship to dry matter production (Hunt, 2017). Jarma, Combatt, and Cleves (2010) indicated that the concentration of macro and micro elements determines the quality of Stevia; therefore, it is also important to evaluate the nutrient content under different environmental conditions.
The objective of the present research was to quantify the growth and phytochemical and nutrient content of S. pilosa plants in situ under three soil-environmental conditions in the state of Hidalgo, Mexico.
Materials and methods
Based on the publication “Flora fanerogámica del Valle de México” (Calderón & Rzedowski, 2005), field visits and interviews with producers about S. pilosa, three locations in the state of Hidalgo with different soil types and environmental conditions were selected: Huasca de Ocampo (HO), Mineral del Chico (MCh) and Mineral del Monte (MM) (Table 1).
Table 1 Characteristics of Stevia pilosa collection sites in the state of Hidalgo, Mexico.
| Element | Huasca de Ocampo | Mineral del Chico | Mineral del Monte |
|---|---|---|---|
| Elevation (m) | 2 204 | 2 509 | 2 822 |
| Latitude | 20° 10' 29'' N | 20° 14' 40.7" N | 20° 08' 44" N |
| Longitude | 98° 33' 31" W | 98° 46' 08.6" W | 98° 41' 06" W |
| Temperature (°C, max-min) | 22.6 - 4.0 | 20.9 - 8.7 | 18.5 - 7.5 |
| Rainfall (mm) | 856.2 | 1 427.8 | 870.7 |
| Evaporation (mm) | 1 253.4 | 131.5 | 1 137.9 |
| Fog (days) | 0.7 | 69.40 | 62.2 |
| Vegetation | Pinus patula, P. teocote, P. michoacana, Quercus crassifolia and Q. rugosa | P. teocote, Abies religiosa, Juniperus monosperma and Q. rugosa | Pinus montezumae, Q. rugosa, A. religiosa and Juniperus monticola |
At each site, three samples composed of soil from the surface horizon were collected for analysis of the following soil properties: texture (pipette), pH (1:1 water:soil), cation exchange capacity (ammonium acetate), organic matter (Walkley and Black), nitrogen (Kjeldahl), soluble phosphates (Olsen), bulk density (clod and paraffin), base saturation (%) and organic carbon (Van Reeuwijk, 2002).
At each site, eight S. pilosa plants were collected at 20, 52, 82 and 110 days after soil sampling and plant height, stem diameter and leaf number were determined. The plant material was dried in an oven (Blue Island, model BLUE M, Illinois, USA) with air circulation at 47 °C for 96 h. Subsequently, an analytical balance (ADAM EQUIPMENT®, model PW254) was used to obtain the dry weight of leaves and stem. Leaf area was measured with a camera (Samsung, semi-professional model WB1100F) with the methodology proposed by Rincón, Olarte, and Pérez (2012). With the values obtained, the following indices were calculated: Relative Growth Rate (RGR = lnDW2-lnDW/T2-T1), Net Assimilation Rate [NAR = (DW2-DW1/LA2-LA1) (lnLA2-lnLA1/T2-T1)], Specific Leaf Area (SLA = LA/LDW) and Leaf Area Ratio (LAR = LA/LSW); where ln = natural logarithm, T1 = time 1, T2 = time 2, DW = dry weight, LA = leaf area, LDW = leaf dry weight and LSW = leaf and stem weight (Hunt, 2017; Nassi, Roncucci, Triana, Tozzini, & Bonari, 2011).
In the last sampling, in addition to the aforementioned determinations, nutrient analysis of the plants was made and the concentration of macroelements (P, K, Ca, Mg and S) and microelements (Fe, Zn, Mn, Co, Cu, Ni, Na and B) was quantified by inductively coupled plasma atomic emission spectroscopy (ICP-OES, Varian®, model 725-ES). Total N content was determined by the semi-micro Kjeldahl method (Bremner & Mulvaney, 1982). With the concentration and dry weight values, the extraction of each element per plant was calculated.
With the dry plant material, phenols were identified with the Folin-Ciocalteu reagent, flavonoids by the Shinoda reaction, and terpenes by the Liebermann-Burchard reaction (Cannon et al., 2001; Tholl, Chen, Petri, Gershenzon, & Pichersky, 2015); quantification was performed with the methods described by Waterman and Mole (1994), Chang, Yang, Wen, and Chern (2002), and Harborne (1998), respectively. Results were subjected to an analysis of variance (ANOVA) and Tukey's multiple comparison test (α = 0.05).
Results and discussion
Edaphoclimatic conditions
The three sites where S. pilosa grows in Hidalgo show differences in elevation, rainfall, temperature, vegetation and soil type, although they share some environmental conditions (Tables 1 and 2). MCh and MM have the same number of days with fog and poorly drained soil, while HO and MM have similar values for evaporation and rainfall. These climatic variables define the distribution areas of species, as well as their survival limits (Cabrera, 2002).
The soils where S. pilosa grows vary from very acid to acid, poor to moderate in organic matter, with fine and medium textures (Ortiz-Solorio, 2019), and the bulk density is low (MCh = 1.21 g·cm-3 and HO = 1.25 g·cm-3), edaphic conditions that differ from where S. rebaudiana grows (Goyal et al., 2010).
Land use and vegetation disturbance varied among sites; in MM there is logging, in MCh subsistence crops are planted and in HO there is grazing, activities that have an effect on the density and growth of S. pilosa plants.
Table 2 indicates that soil nutrient concentrations varied; for example, the highest values in nitrogen, cation exchange capacity and base saturation (BSP) correspond to MM, while the lowest values in phosphorus and BSP occur in HO. Soil organic matter content correlates with leaf number and dry weight of plants (Mishra & Kumar, 2016) as in MCh. Zaman, Chowdhury, and Chowdhury (2015) reported that S. rebaudiana grows in soils with high organic matter content, suggesting that S. pilosa requires less nutritional quality for growth.
Table 2 Physical and chemical characteristics of soils where Stevia pilosa grows in the state of Hidalgo, Mexico.
| Site | Texture | Bd (g·cm-3) | pH | OC (%) | OM (%) | N (%) | P(mg·kg-1) | CEC (cmol(+)·kg-1) | PSB (%) |
|---|---|---|---|---|---|---|---|---|---|
| HO | loam | 1.25 | 4.6 | 0.92 | 1.59 | 0.061 | 7.94 | 18.77 | 11.56 |
| MCh | clayey | 1.21 | 5.1 | 1.29 | 2.23 | 0.096 | 10.48 | 25.79 | 23.72 |
| MM | clayey | 1.61 | 5.8 | 1.82 | 3.22 | 0.225 | 8.37 | 31.63 | 63.47 |
HO = Huasca de Ocampo, MCh = Mineral del Chico, MM = Mineral del monte. Bd = bulk density, OC = organic carbon, OM = organic matter, N = nitrogen, P = phosphorus, CEC = cation exchange capacity, BSP = base saturation percentage.
The number of plants present on the sites was different and depended on the edaphoclimatic conditions. In MCh, populations of up to 12 plants per m2 were found around the trees or where sunlight was filtered; in contrast, in HO, where soils had a lower nutrient content and a higher temperature and amount of light, an average of two plants per 9 m2 was quantified.
According to Table 3, there are significant statistical differences (P ≤ 0.05) in the development of S. pilosa depending on the sampling site, hence the importance of the ecosystem where it develops and the agronomic management of the plant (Wahid, Farooq, Hussain, Rasheed, & Galani, 2012). MCh and MM plants increased significantly in height in the first 52 days, but growth was slower between 82 and 110 days. In contrast, HO plants increased in height steadily from the first to the last day of sampling. This is reflected in the growth of 0.383 and 0.328 cm per day in MCh and MM plants, respectively, and 0.625 cm in HO plants. At that site, most days of the year are sunny and with higher temperatures than in MCh and MM, where foggy days represent up to a little more than 2.5 months (Table 1). According to Hatfield and Prueger (2015), research is needed to quantify the interactions between temperature, soil moisture and species, and thus understand the possible strategies of crops for their development under different climatic conditions.
Table 3 Growth variables of Stevia pilosa developed in three sites in the state of Hidalgo, Mexico.
| Site | Sampling Days | PH (cm) | SD (mm) | LN | LA (cm2) | LDW (mg) | SDW (mg) |
|---|---|---|---|---|---|---|---|
| Huasca de Ocampo | 20 | 13.68 | 1.37 | 37 | 27.58 | 233.8 | 183.3 |
| 52 | 25.59 | 1.77 | 78.13 | 44.62 | 312.2 | 302.8 | |
| 82 | 43.64 | 2.26 | 196.50 | 92.95 | 626.2 | 504.1 | |
| 110 | 72.36 | 2.68 | 366.75 | 182.49 | 914.7 | 1 738.1 | |
| Mineral del Chico | 20 | 14.18 | 1.49 | 45.25 | 99.06 | 330.2 | 411.4 |
| 52 | 34.50 | 2.37 | 224.75 | 197.99 | 740.6 | 840.6 | |
| 82 | 43.83 | 2.64 | 274.75 | 237.93 | 1 127.3 | 1 227.9 | |
| 110 | 48.71 | 2.90 | 417.25 | 311.50 | 1 347.5 | 1 977.1 | |
| Mineral del Monte | 20 | 15.86 | 1.32 | 36.00 | 21.78 | 152.1 | 135.8 |
| 52 | 27.13 | 1.73 | 81.25 | 40.45 | 244.9 | 210.9 | |
| 82 | 43.21 | 2.23 | 245.75 | 144.62 | 540.2 | 609.1 | |
| 110 | 42.45 | 2.53 | 261.75 | 200.88 | 704.3 | 935.8 | |
| Overall mean | 29.07 | 1.91 | 135.49 | 100.78 | 478.5 | 491.8 | |
| LSD | 3.04 | 0.22 | 34.05 | 16.07 | 125.7 | 111.4 | |
| Tukey (α = 0.05) | ** | ** | ** | ** | ** | ** |
LSD: least significant difference. PH = plant height, SD = stem diameter, LN = leaf number, LA = leaf area, LDW = leaf dry weight, SDW = stem dry weight.
On the other hand, the stem diameter of the plants increased linearly in HO and MM, while in MCh, the highest growth (up to 40 %) was recorded between 52 and 82 days. MCh plants had 15 to 47 % more leaves (small, lanceolate and thinner) and more leaf area than those of MM and HO, respectively. If the last record is analyzed, it is possible to verify that the HO leaves were much thicker (5.01 mg·cm-2) than those of MCh (4.32 mg·cm-2) and MM (3.50 mg·cm-2); however, the highest LDW and SDW values were obtained in MCh plants. These data show that the amount of solar radiation that the plant intercepts and uses during its development, together with moisture and nutrients, are determining factors in growth to obtain high yields (Pereira, Storck, Lopes, Martin, & Bisognin, 2016).
Physiological efficiency indices
The RGR indicates the efficiency of the plant to produce biomass in a given period. Figure 1 shows that the RGR of S. pilosa was different at the three sites studied. In MCh, the highest values were recorded in the early sampling dates, indicating efficiency in biomass production because there were large leaves; however, at later dates, the leaves were smaller and some were senescent.
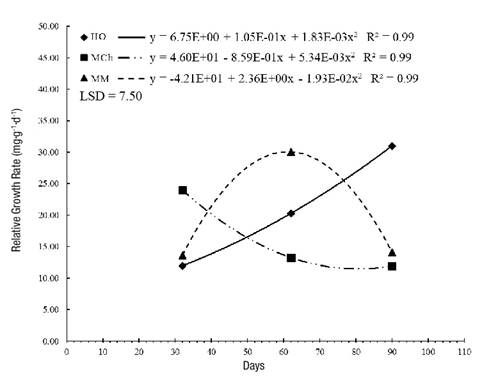
Figure 1 Relative growth rate in Stevia pilosa plants in Huasca de Ocampo (HO), Mineral del Chico (MCh) and Mineral del Monte (MM) in the state of Hidalgo, Mexico. LSD: Least significant difference.
In HO and MM, S. pilosa grew and continued the meristematic activity in such a way that they doubled and tripled the RGR, respectively, between 32 and 62 days; stem and vegetative bud growth increased and there were new ramifications. MM plants were very efficient in producing biomass up to 60 days; afterwards, leaf size decreased. HO plants slowly produced their biomass only in the first days, then it increased notably as time passed, which was related to the presence of rainfall.
The net assimilation rate (NAR) records the speed of net photosynthesis over a period of time. Figure 2 indicates that, in the first 30 days, the highest values (5.01 mg·cm-2·d-1) were recorded in MCh, while the value was three times lower in MM and HO. This shows, indirectly, that plants are less efficient autotrophically, so their survival depends largely on root reserves. A particular case was that of HO plants, where the NAR increased in each sampling, which is directly related to leaf weight per area (cm2) and the efficiency of the foliage in the production of photoassimilates (Morales et al., 2015). In addition, there was greater exposure to direct sunlight at this site, a situation that modifies the intensity and quality of light captured by the organs that perform photosynthesis (Casierra-Posada & Peña-Olmos, 2015), which allowed for the replacement of the biomass losses, respiration and movement of photosynthates to the reproductive organs.
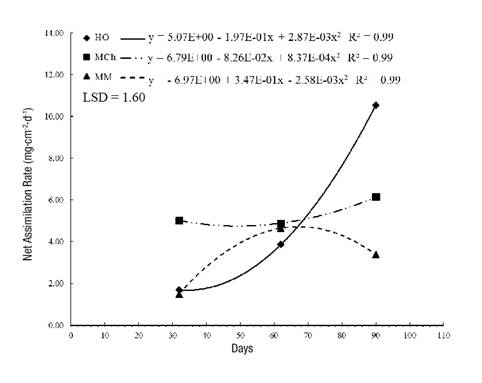
Figure 2 Net assimilation rate in Stevia pilosa plants during their growth in Huasca de Ocampo (HO), Mineral del Chico (MCh) and Mineral del Monte (MM) in the state of Hidalgo, Mexico. LSD: least significant difference.
Plant growth and development are influenced by, among other factors, the intensity and quality of the light captured by the organs that perform photosynthesis. SLA steadily increased in the HO and MM plants. This result is related to leaf thickness and light availability, as noted by Quero et al. (2008). According to Figure 3, at 32 days, the highest values corresponded to MCh plants with 291.68 cm2·g-1. In HO and MM plants, SLA increased as a function of time; the second site generated the highest value (324.25 cm2·g-1) in the last sampling (110 days). As SLA is the most sensitive index to environmental changes and the most prone to ontogenetics, excessive shading causes it to increase and has a negative impact on NAR (Morales et al., 2015), as observed in the present study.
Wright, Reich, and Westoby (2001) determined positive correlations between SLA, photosynthetic capacity and nutrient content, and showed that when there are high SLA rates there is less hardness in the leaves and higher nutritional quality in the plant. Information about S. pilosa is very scarce; however, based on the work done, it is possible to affirm that significantly lower values reflect greater leaf hardness, which can be interpreted as an adaptation to the environment (Romero-Figueroa et al., 2017).
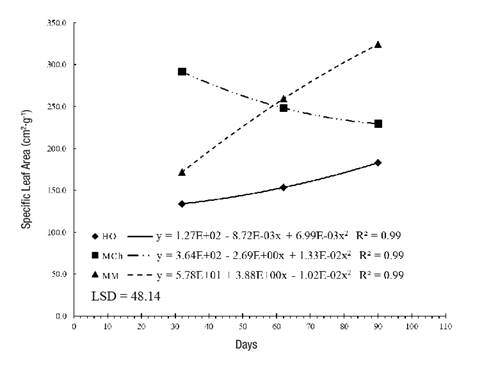
Figure 3 Specific leaf area in Stevia pilosa plants during growth in Huasca de Ocampo (HO), Mineral del Chico (MCh) and Mineral del Monte (MM) in the state of Hidalgo, Mexico. LSD: least significant difference.
The LAR, which represents the assimilative surface per unit dry weight, exhibited the same trend as the SLA. Plants that grew in MCh had the densest leaves at 30 days, but the leaves became thinner as time went by; in contrast, in MM, the LAR was 20 % higher at 110 days (Figure 4). These differences are mainly due to the shading conditions and low temperatures that modify the metabolic and respiratory activities of the plant. In addition, the increase or decrease in the LAR value means that changes in LA are much more critical in flowering and seed formation than in the initial phase of growth (Pommerening & Muszta, 2016).
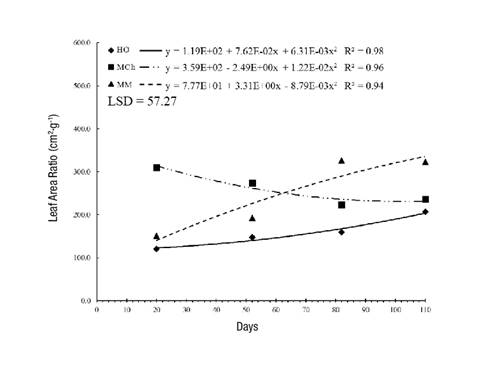
Figure 4 Leaf area ratio in Stevia pilosa plants during their growth in Huasca de Ocampo (HO), Mineral del Chico (MCh) and Mineral del Monte (MM) in the state of Hidalgo, Mexico. LSD: least significant difference.
The discrepancy in the behavior of the indices over time is largely due to climatic conditions, the number of samples taken and the limited information on the precise phenological stages of the species.
Metabolite concentration
Figure 5 shows the metabolite concentrations in S. pilosa. Plants from the three sites showed no significant statistical differences (P > 0.05) in phenol concentrations; mean values ranged from 1.79 to 2.6 mg·g-1 dry matter. These concentrations are lower than those found by Gawel-Beben et al. (2015) in S. rebaudiana leaves (6 to 16 mg·g-1 dry matter). Flavonoid concentration was also similar among sites (P > 0.05) and ranged from 1.3 to 1.8 mg·g-1 dry matter; in this regard, Gawel-Beben et al. (2015) reported values from 2.2 to 3.5 mg·g-1. On the other hand, the analysis showed significant statistical differences (P ≤ 0.05) in total terpenes (TT) and, on the basis of what was reported by Cerda-García-Rojas and Pereda-Miranda (2001), it follows that this type of metabolite in S. pilosa is of the diterpenic type. In addition, TT was found to have an inverse correlation with the percentage of exchangeable bases; that is, the greater the amount of TT, the lower the presence of cations in the exchange system. In general, the presence or absence of secondary metabolites in the plants has to do with the climatic conditions and elevation of the site (Cui, Nakamura, Tian, Kayahara, & Tian, 2006), as well as with the stress generated by the presence of pests and diseases (Magangana & Makunga, 2016), soil nutrient content (Zhao et al., 2016) and the interaction with other species.
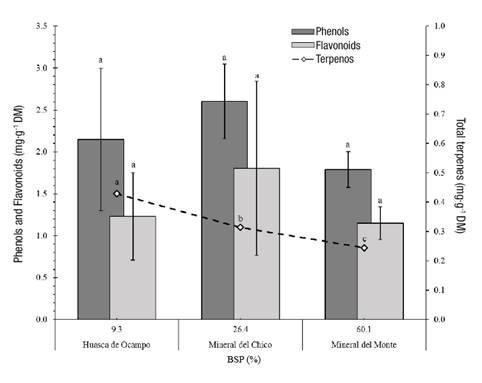
Figure 5 Concentrations of phenols, flavonoids and total terpenes in Stevia pilosa plants and their relationship with the base saturation percentage (BSP) of the soils at three sites in the state of Hidalgo, Mexico. Different letters indicate significant differences in metabolite concentrations among sites, according to Tukey's test (P ≤ 0.05).
In studies of the genus Stevia, triterpenic metabolites and sesquiterpenic lactones (García & Pereda, 2002) have been reported to have anti-inflammatory (Hohmann et al., 2016) and cancer prevention properties (Sampaio, Edrada-Ebel, & Da Costa, 2016), which is why it is important to identify the metabolites and study their properties.
Although there is little information about the management or the edapho-environmental relationship in the production of secondary metabolites of Mexican Stevias, it is possible to infer that factors such as water availability, microorganisms in the rhizosphere (Borda, Pardo, Montaña, & Martínez, 2011), temperature (Kumar et al., 2015) and light quality (Ahmad, Rab, & Ahmad, 2016) can increase the concentration of phenols, flavonoids and diterpenes.
Nutrient analysis
According to Table 4, the concentration and extraction of minerals in S. pilosa varied significantly (P ≤ 0.05) depending on the sampling site. The plants with the highest extraction yields were those of MCh and the lowest yields were those of MM. The elements most extracted by the plant were N, K, Ca and Mg, and the least extracted were Fe, Zn, Mn and Mo. A similar trend was found by Khiraoui et al. (2017) in an analysis of S. rebaudiana from six sites in Indiana, where K, Ca and Mg were the minerals with the highest amount in plant tissue, and Mn, Fe and Zn the lowest. These results are related to the resilience capacity of the wild plant, the contrasting edaphoclimatic conditions among the sites and the development of the species. On the other hand, Rather, Singh, Suhail, and Patel (2019) report that Ca and K are the minerals with the highest concentration in the plant and Fe, P and Na the lowest. Apparently, the genus Stevia has the same tendency in mineral concentration and extraction.
Table 4 Nutrient extraction from Stevia pilosa plants developed in three locations in the state of Hidalgo, Mexico.
| Site | N | P | K | Ca | Mg | S | Fe | Zn | Mn | Mo |
|---|---|---|---|---|---|---|---|---|---|---|
| (mg·g-1 dry matter) | ||||||||||
| Huasca de Ocampo | 8.25 a | 1.61 a | 3.68 a | 3.11 b | 2.42 a | 1.62 a | 0.58 a | 0.33 a | 0.78 a | 0.08 a |
| Mineral del Chico | 8.80 a | 2.07 a | 3.81 a | 4.41 a | 2.32 a | 1.84 a | 0.98 a | 0.32 a | 0.68 ab | 0.12 a |
| Mineral del Monte | 6.15 b | 1.83 a | 2.42 b | 2.67 b | 1.71 b | 0.63 b | 0.36 b | 0.36 b | 0.40 b | 0.10 a |
Conclusions
The edaphoclimatic conditions at the three sites in the state of Hidalgo modify the presence, form of growth and development of Stevia pilosa. The plants with the highest growth, biomass production and nutrient extraction were found in Mineral del Chico, where there is a humid climate and soil with greater chemical fertility, while the highest production of total terpenes was found in plants from Huasca de Ocampo, where the climate is dry and soils are poor in nutrients. This study represents the first research documenting the development, nutrient content and secondary metabolites of S. pilosa in situ.


 texto en


