Survival limits, distribution areas, and distribution of species and communities are defined along the altitudinal gradient by several environmental variables (Prentice et al., 1992). Environmental variables in turn are influenced by altitude. Plant physiological responses at different altitudinal steps can be seen as an analogy for climate adaptation at different elevations (Hovenden and Brodribb, 2000). Elevation influences environmental variables such as photosynthetically active radiation, air temperature, vapor pressure deficit, and rainfall. Different micro- and macro-environmental conditions at different elevations can cause local plant acclimation and adaptation (Körner et al., 1986; Friend et al., 1989). Microenvironment factors such as photosynthetically active radiation, air humidity, air temperature, soil water availability, among other factors, affect stomatal movement and conductance (Jarvis, 1976; Fanjul and Barradas, 1985; Jones, 1992; Buckley, 2005; Buckley and Mott, 2013). Stomatal conductance (gS) is an important physiological trait because stomatal function plays a key role in plant physiology (Jones, 1992; Meinzer et al., 1997; Barradas et al., 1994, 2004; Buckley, 2005; Esperón-Rodríguez and Barradas, 2014a). Also, stomatal behavior is considered a plant response to climate, as it controls transpiration (water status) and CO2 assimilation, playing an important role in photosynthesis and plant productivity (Jones, 1992). Studying the physiological role of stomata helps to understand plant performance, gS can help to explain ecophysiological responses along an altitudinal gradient. Previous studies focused on the effect of micro-environmental and physiological variables on gS showed a broad diversity of gS responses to different microclimatic and physiological factors (Fanjul and Barradas, 1985; Roberts et al., 1990; Meinzer et al., 1997; Beer et al., 2007); and also it was discussed how altitudinal variations can affect the gS response (Körner et al., 1986; Carter et al., 1988; Hovenden and Brodribb, 2000). The central mountain region of Veracruz, Mexico, holds the region of the Great Mountains, which posses a very pronounced topography along the altitudinal gradient, going from the sea level up to 5,500 m asl, in a distance of 100 km (Barradas et al., 2010). As a result, climate in this region is conformed as follows: (1) the complex interactions between the prevailing synoptic systems, such as the tropical systems at summer and mid-latitude at winter, (2) the mountainous topography, (3) the plant-atmosphere interaction, and (4) the proximity to the Gulf of Mexico (Barradas et al., 2010). The physiographic and climatic characteristics of the region make it an interesting study area to assess the gS response at different elevations.
We analyzed the gS response and its relationship with three climate variables: air temperature, vapor pressure deficit and photosynthetically active radiation, and two physiological traits: leaf water potential and transpiration, and we compared these responses among four tree species from different elevation ranges from the central mountain region of Veracruz, Mexico.
Materials and methods
In order to compare ecophysiological responses among species measurements of physiological traits and climate variables must be taken as simultaneously as possible (Jones, 1992; Barradas et al., 2004; Esperón-Rodríguez and Barradas, 2014a, b, 2015), hence, measurements of physiological traits and climate variables were conducted under greenhouse conditions.
Study Area. All plant specimens came from the central mountain region of Veracruz, Mexico (19º 54’ 08’’ N, 96º 57’ 19’’ W; Figure 1) which is part of TransMexican Volcanic Belt and the Sierra Madre Oriental. The region possess several vegetation types that go from tropical montane cloud forest to semi-arid and arid communities (Gómez-Pompa, 1978; Barradas, 1983). Mean annual temperatures range between 10 and 29 ºC, and annual precipitation ranges from 600 to 1,200 mm, with a maximum of 3,000 mm in wetter regions.
Plant material. We selected four tree species from different elevation ranges within the central mountain region of Veracruz, ranging from 400 to 3500 m asl: Alnus acuminata Kunth, Liquidambar styraciflua L., Pinus ayacahuite C. Ehrenb ex. Schltdl, and Quercus xalapensis Bonpl. (Table 1). Fifteen individuals of each species from 45 to 90 cm height were kept in the greenhouse. Individuals were transplanted in a mixture of peat moss after having been sterilized by autoclaving for 90 minutes. Individuals were kept at the humid greenhouse of the Institute of Ecology, Universidad Nacional Autónoma de México, under well-watered conditions.
Table 1 Elevational distribution, precipitation range, optimal temperature (TO), and optimal thermal range (TR) for stomatal function for Alnus acuminata, Quercus xalapensis, Liquidambar styraciflua and Pinus ayacahuite.

Stomatal conductance and Leaf water potential. Stomatal conductance (gS) and transpiration (E) were measured in all individuals of each species on at least four fully expanded leaves per plant, with a steady-state diffusion porometer (LI-1600, LI-COR, Lincoln, Nebraska, USA). Leaf water potential (ΨL) was measured in all individuals of each species on four fully expanded leaves per plant, with a pressure chamber (PMS, Corvallis, Oregon, USA) (Scholander et al., 1964). Physiological measures were made daily from October 22 to December 7, 2012, at 0700 and from 1000 to 1800 hours (h, local time) at 2 h intervals.
Climatological measurements. Air temperature (T A), photosynthetically active radiation (PAR), and relative humidity (RH) were determined next to each measured leaf with a quantum sensor (LI-190SB, LI-COR Ltd., Lincoln, Nebraska, USA), a fine wire thermocouple, and a humicap sensor (Vaisala, Helsinki, Finland). Leaf temperature (T L) was also measured. Thermocouples were mounted in the porometer. The air vapor pressure difference (VPD) was calculated from T A and RH measurements. VPD was calculated using the equation:
where e S and e (kPa) are the saturation vapor pressure and actual. The saturation vapor pressure is derived as follows:
where T (ºC) is the current air temperature, e is calculated with the following expression:
where RH (%) is the relative humidity (Barradas, 1994). Climate measurements were made daily from October 22 to December 7, 2012, at 0700 and from 1000 to 1800 hours (h, local time) at 2 h intervals.
The envelope function method. The effect that each climate variable has on gS is determined from the envelope function method. This method consists of selecting data from the probable upper limit of the function, this function is represented by a cloud of points in each diagram produced by plotting gS as a function of any variable (climatic and edaphic). This method has three theoretical assumptions: (1) the envelope function represents the optimal stomatal response to the selected parameter (i.e. PAR), (2) the points below the selected function are the result of changes in the other variables (e.g. VPD and T A), and (3) there are not synergistic interactions among variables (Fanjul and Barradas, 1985; Ramos-Vázquez and Barradas, 1998; Barradas et al., 2004).
The relationship of gS in terms of air temperature (T A) is given by the envelope values that fit a quadratic equation:
where A, B and C are parameters of the parabola, being possible to determine the optimum temperature (T O) at which gSMAX occurs, and the cardinal temperatures (minimum and maximum).
Envelope values of gS as a function of photosynthetically active radiation (PAR) are consistent with a hyperbolic function:
where a is the asymptotic value of gS or gSMAX and b is gS sensitivity to changes in PAR.
While the gS function in relation to vapor pressure deficit (VPD) generates a simple linear equation.
where b is gS sensitivity to the VPD, and a is the zero drift.
Similarly, the stomatal response to water potential is also a simple linear equation:
where b is gS sensitivity to ΨL, and a is the zero drift.
We also analyzed the relation between the gS and the transpiration (E) by a simple linear equation.
where b is gS sensitivity to E, and a is the zero drift.
Statistical analysis. We used the non-parametrical test Kruskal-Wallis to evaluate our data whether there were significant differences of gS, T A, PAR, VPD, E and ΨL among species. Influence of each variable (T A, PAR, VPD, ΨL, gS) for each species was evaluated through a Principal Components Analysis (PCA). The PCA was based on the correlation matrix of variables (Jongman et al., 1987) and was used to identify the principal sources of variability. We calculated the relative importance (RI) of each component by measuring the length of each vector (Legendre and Legendre, 1998). A linear regression analysis (Zar, 1984) was used to determine the effect of the micro-environmental variables on gS. An analysis of variance (ANOVA) was used to evaluate the performance of the regression. Statistical significance was considered at 95 % for all cases. All statistical analyzes were performed using the R (R Core Team, 2014) software.
Results
Greenhouse mean temperature was 24.09 ± 5.08 ºC, maximum temperature was registered at 1400 hours (h, local time, 28.26 ± 1.78 ºC) and minimum at 0800 h (17.33 ± 0.50 ºC). Mean relative humidity (RH) was 36.56 ± 1.77 %, being maximum at 0800 h (38.37 ± 4.24 %), and minimum at 1600 h (33.38 ± 0.64 %). Photosynthetically active radiation averaged 133.57 ± 96.0 μmol m-2 s-1, with maximum values at 1200 h (289.06 ± 65.90 μmol m-2 s-1) and minimum at 1800 h (26.58 ± 14 μmol m-2 s-1).
We found significant differences among all species when comparing gS (Kruskal-Wallis H = 209.174, P < 0.001), Ψ (Kruskal-Wallis H = 240.85, P < 0.001), PAR (Kruskal-Wallis H = 25.0318, P < 0.001) and VPD (Kruskal-Wallis H = 8.7461, P = 0.0329). Alnus acuminata had the highest gS and E. Concerning ΨL, the highest corresponded to Pinus ayacahuite. The highest temperature was registered for A. acuminata, VPD corresponded to Quercus xalapensis and PAR was associated to P. ayacahuite (Table 2). The most sensitive species to changes in PAR, E and ΨL was Liquidambar styraciflua, and for VPD was A. acuminata (Table 3). The comparison of the curves generated by the envelope function method among the four species performing the method for all the variables (T A, PAR, VPD, E and ΨL) for each species is presented in Figure 2. From the gS vs. T A curve we obtained the optimal thermic range (T R), and the optimal temperature (T O) when the maximum stomatal conductance (gSMAX) occurred. For A. acuminata T O = 29 ºC, for Q. xalapensis T O = 28 ºC, for L. styraciflua T O = 27 ºC, and for P. ayacahuite was T O = 26 ºC (Table 1).
Table 2 Stomatal conductance (gS), water leaf potential (ΨL), air temperature (TA), vapor pressure difference (VPD), photosynthetically active radiation (PAR), transpiration (E) for Alnus acuminata, Quercus xalapensis, Liquidambar styraciflua and Pinus ayacahuite. Total averages are shown and ± standard deviation (n=870).

Table 3 Parameters of the calculated envelope functions for stomatal conductance (gS) versus, air temperature (TA), photosynthetically active radiation (PAR), vapor pressure difference (VPD), transpiration (E) and leaf water potential (ΨL) for Alnus acuminata, Quercus xalapensis, Liquidambar styraciflua and Pinus ayacahuite (r2 is the coefficient of determination).
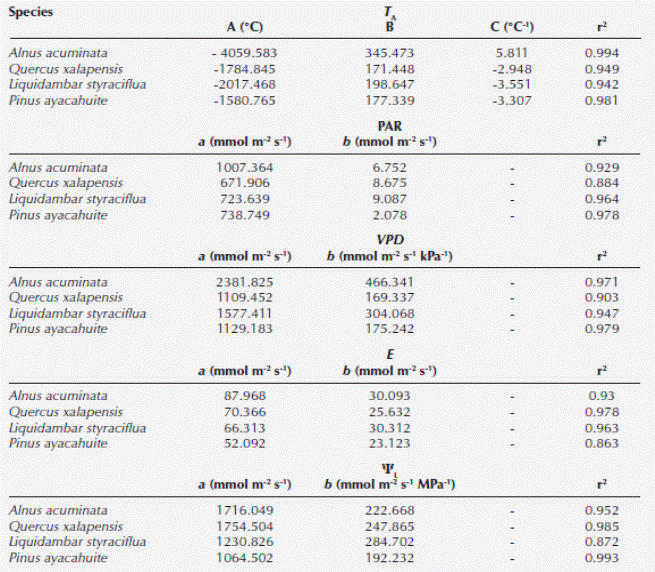
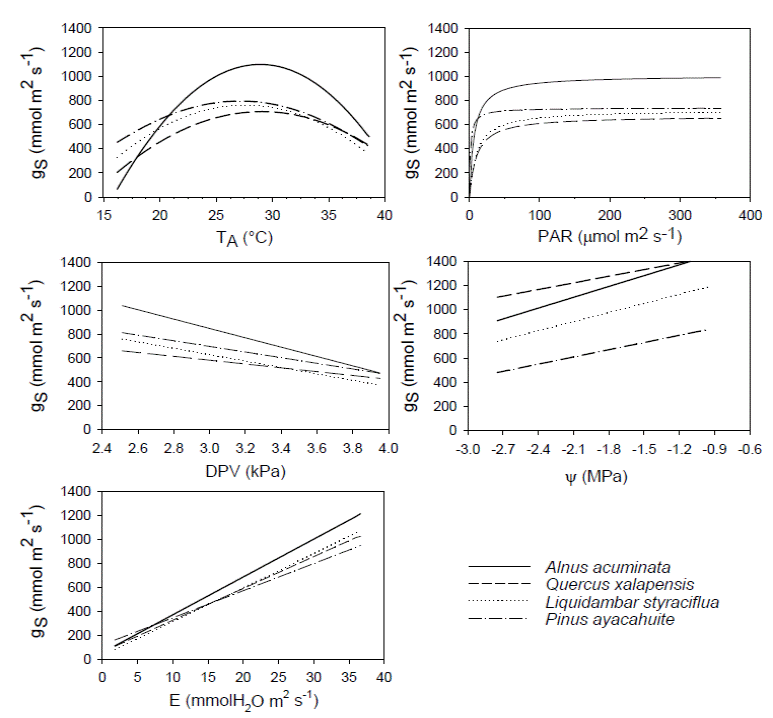
Figure 2 Diagram of the envelope function method for the parameters temperature (TA), photosynthetically active radiation (PAR), vapor pressure difference (VPD), transpiration (E), and leaf water potential (ΨL) plotted against stomatal conductance (gS) for Alnus acuminata, Quercus xalapensis, Liquidambar styraciflua and Pinus ayacahuite.
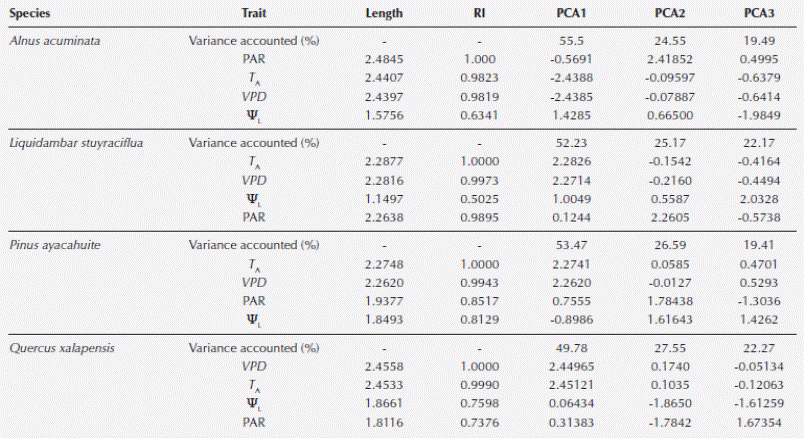
After analyzing the PCA, we found differential influence and vector lengths for each variable (Table 4). We found that species response was differential; however, VPD and T A had the highest RI for all species, except for Alnus acuminata where PAR had the highest RI (Table 4). As for the linear regression model, we found that all variables had an effect on gS: 1) T A: linear regression t = 21.96, P < 0.001; ANOVA F = 1.72, P = 0.1903; 2) PAR: linear regression t = 4.48, P < 0.001; ANOVA F = 60.6078, P < 0.001; 3) VPD: linear regression t = -23.14, P < 0.001; ANOVA F = 526.71, P < 0.001, and 4) ΨL: linear regression t = -6.22, P < 0.001; ANOVA F = 38.66, P < 0.001. For the model we found an adjusted R2 of 0.5296 (F statistic: 156.9, P < 0.001).
Table 4 Length of the vectors of the principal component analysis (PCA), their relative importance (RI), variance accounted for by each axis (%) and Eigenvector scores of the plant traits of air temperature (TA), vapor pressure deficit (VPD), photosynthetically active radiation (PAR) and leaf water potential (ΨL) in the first three principal components analysis axes for Alnus acuminata, Liquidambar styraciflua, Pinus ayacahuite and Quercus xalapensis. Values are ranked in order of absolute magnitude along PCA axes for each species.
When we analyzed Figure 2, we observed for T A that Quercus xalapensis, Liquidambar styraciflua, and Alnus acuminata have analogous physiological behavior in temperatures between 27.1 and 31 °C, which is consistent with the T O ranges of the three species (Table 1). When temperature is higher (31-34.2 °C) Pinus ayacahuite and L. styraciflua behaved similarly. And with highest temperatures reached (more than 34 and up to 40 ºC), A. acuminata and L. styraciflua had the equal gS behavior. We noticed that all the species had higher T O and T R (Table 1) than the mean temperatures of the region (Figure 3).
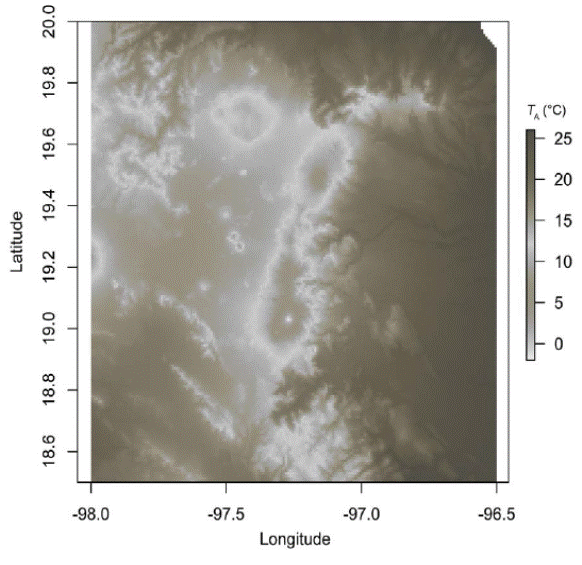
Figure 3 Mean temperature distribution in the region of the Great Mountains in the state of Veracruz, Mexico. Data from WorldClim-Global Climate Data (http://www.worldclim.org/ Accessed No vember 2014).
Stomatal behavior for PAR was similar for all four species (Figure 2), with a slight distinction of Pinus ayacahuite. We observed a greater affinity between Quercus xalapensis and Liquidambar styraciflua. These data can be corroborated with the equation values from the envelope function method (Table 3), where sensitivity values (b) were similar for Alnus acuminata, Q. xalapensis, and L. styraciflua (6.752, 8.675 and 9.087 respectively), against P. ayacahuite (2.078). As for VPD, we noted that at low VPD (2.51 - 2.85 kPa) all species behaved similarly. While increasing VPD (3.15 - 3.72 kPa) A. acuminata and L. styraciflua behaved similarly and with higher VPD (3.7 - 4.0 kPa) A. acuminata and P. ayacahuite behaved similarly (Figure 2).
There was similar behavior among the species for E (Figure 2). We observed that Quercus xalapensis, Alnus acuminata, and Pinus ayacahuite behaved similarly in E < 10 mmol H20 m-2 s-1. Above 20 mmol H20 m-2 s-1, Liquidambar styraciflua, Q. xalapensis and A. acuminata had a similar behavior. Concerning ΨL, we observed that L. styraciflua and P. ayacahuite reached the lowest asymptotic gS values (Table 3), with L. styraciflua being the most sensitive species to changes in ΨL.
Discussion
Stomatal conductance is an important physiological trait (see Introduction) that can help us to analyze ecophysiological responses related to changes in climate variables and other physiological traits. However, the gS response also can help to understand the species’ distribution along an elevation gradient, because gS may be related to the altitude where plants grow, thus the physiological response in plants may be a heritable trait (Hovenden and Brodribb, 2000). In this work, we tried to make a first attempt to use gS data taken in the greenhouse to explain the natural distribution of the species.
Studying the gS response along an elevation gradient has the difficulty that gS measurements must be taken simultaneously (see Materials and Methods), thus comparing species, in particular species that do not share the same distribution, in the field can be methodologically difficult. We found a possible solution to this problem by measuring species responses in the greenhouse, observing changes related to temperature. Studying tropical systems has the advantage that air temperature decreases when increasing elevation.
The adaptation of plants to different elevations is seen as an analogy for climate adaptation (Hovenden and Brodribb, 2000), where elevation influences the environmental variables T A, PAR, VPD and rainfall by decreasing temperature with increasing altitude (Harper, 1977; Hikosaka et al., 2002), and elevation influences the possibility of plants acclimation and adaptation to particular environmental conditions (Körner et al., 1986, Friend et al., 1989). In this work, we considered that high temperatures in the greenhouse could be related to low elevations in the elevation gradient and low temperatures to high elevations.
Our species selection was not arbitrary. Species are distributed along the elevational gradient of the central mountain region of Veracruz (Figure 1). Their distributions range from 400 to 3,500 m asl. This means that the species are subject to different temperature and precipitation regimes (Table 1). Therefore, we found different gS responses among species (Table 2). If we did not find differences, that would imply that the gS response is similar for all species (Hubbell, 2001), but having a differential gS response supports evidence of differences in the evolutionary history of each species and of particular adaptations to their respective niches along the elevation gradient.
Stomatal conductance helped us to understand species’ ecophysiological responses along an elevation gradient. Stomatal responses to T A for Quercus xalapensis, Liquidambar styraciflua, and Alnus acuminata in lower temperatures (Figure 2) were consistent with the T O ranges and with their natural distribution (Table 1). We can find them from 1,300 to 1,800 m asl at lower altitudes where T A increases. At higher temperature, Pinus ayacahuite and L. styraciflua behaved similarly although these species do not share the altitudinal distribution. This might indicate the pine plasticity to adapt to high temperatures, because it has the highest distribution (2,000-3,500 m asl) and the lower T O (26.2 °C), and when temperatures were the highest (Figure 2), A. acuminata and L. styraciflua had the same gS behavior, indicating that these two species have a greater heat tolerance. This tolerance is evident for A. acuminata, consistent with its T O (29.7 °C), the envelope curve (Figure 2) and its altitudinal distribution (1,300 -2,800 m asl). For L. styraciflua, this result was also consistent with its distribution (the lowest of all species, 400-1,800 m asl).
The gS response to E also showed evidence to support the altitudinal distribution. Quercus xalapensis, Alnus acuminata, and Pinus ayacahuite behaved similarly with low E (Figure 2), where all these species distribute at higher altitudes (above 2,000 m asl) where temperature is lower, and thus gS and E are lower preventing water loss through stomata. But with higher E, Liquidambar styraciflua, Q. xalapensis and A. acuminata had a similar behavior, where high E can be related to lower elevational distribution (below 2,000 m asl, and outside the P. ayacahuite distribution) with high temperatures.
Stomatal conductance was influenced by all climate and physiological variables (Table 4). Finding T A and VPD as the main sources of data variability indicates the importance of RH for all species (Table 4). We acknowledge the fact that conditions between the greenhouse and the field are different, where T A, VPD, RH, water availability and other factors might influence the gS response in the field. However, using the envelope function method allowed us to extrapolate the results beyond individuals. Using this method can help us to predict plant performance outside a species’ native range (Sands et al., 2000; Rodríguez et al., 2002; Dye et al., 2004) by increasing temperature or reducing water or VPD, trying to simulate climate change scenarios, environmental changes or climate conditions at different elevations.
In the field, the maximum gS (gSMAX) will be found in the elevation gradient where optimal precipitation, temperature (T O), VPD (VPD O) and PAR (PARO) occurs (Jones, 1992), depending on the characteristics of each plant (Mansfield, 1971). This gSMAX can be translated to maximum photosynthesis and productivity rate; therefore, at this elevation we hypothesized that the maximum species’ abundance might be found (AspMAX, Figure 4). This relationship can be used as a tool for restoration and re-colonization plans of vulnerable species (Castellanos-Acuña et al., 2015). It can also be a useful tool when studying the impacts of climate change. Species might migrate to higher altitudes where temperature is lower, reaching areas with more proper climates (Theurillat and Guisan, 2001), but always considering that factors such as spatial, nutrient and water availability, competition, and germination are determinant of the species’ establishment and survival.
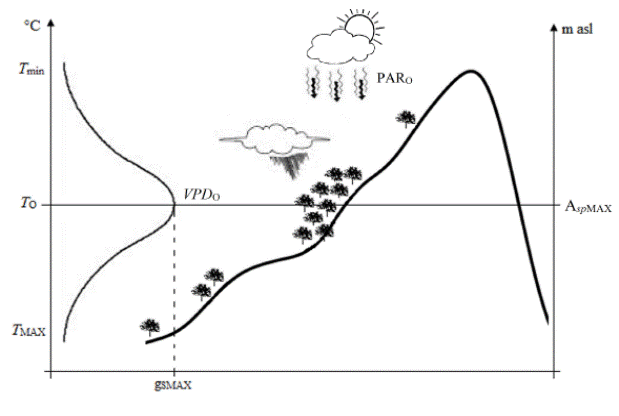
Figure 4 Theoretical relationship among stomatal conductance (gS), climate variables and species’ abundance along an altitudinal gradient. Maximum stomatal conductance (gSMAX) and maximum species’ abundance (AspMAX) is found where the elevation presents optimal temperature (TO), vapor pressure deficit (VPDO), photosynthetically active radiation (PARO) and precipitation; gS decreases when temperature is minimal (Tmin) and maximum (TMAX).
Finally, we must acknowledge that individuals might have acclimatized to the greenhouse conditions, affecting and differing their natural gS response expected in the field. We also recognized that differences among species might also be caused by genetic differences. Nevertheless, as we mention before, this is a first attempt trying to correlate data obtained in the greenhouse to the natural distribution. And despite the consideration mentioned, we encourage future studies that can help to corroborate our results by measuring the gS response in the field along the elevation gradient.


 nueva página del texto (beta)


