


 nueva página del texto (beta)
 Inglés (pdf)
 Artículo en XML
 Referencias del artículo
 Enviar artículo por email
 Citado por SciELO
  Similares en
SciELO
Similares en
SciELO 
 Permalink
Several lines of research indicate that leaf functional traits, i.e., the phenotypic quantitative characteristics measured at the individual level that influence biological fitness, also indicate resource use in plants, allowing botanists to categorize species and plant communities across and within habitats (Reich 2014). The vast amount of plant traits that have been measured worldwide enhance our expectations to produce Earth vegetation dynamic models with the predictive capacity to model the behavior of biota in the face of climatic change (Kattge et al. 2020). Understanding how functional traits co-vary may be useful to predict the effects of abiotic variables on vegetation productivity and cover, including the effect of water stress or nutrient and light acquisition, on growth and survival rates (Westoby et al. 2002, Wright et al. 2004).
One possible way to integrate data from functional traits measured at the individual level into plant community surveys involves the calculation of variance partitioning of functional traits (De Bello et al. 2010). Using this procedure, it is possible to explore how a plant trait varies within and among species, which enables understanding if the spatial and temporal variability in resource acquisition impacts the performance of individuals or has passed through evolutionary filters, modifying the function and structure at the species and community levels (Albert et al. 2011, Violle et al. 2012). For example, in leaf functional traits like leaf area, length, thickness, leaf mass per area (LMA), leaf lifespan, and leaf dry matter content (LDMC), most of the variability is due to the species and higher taxonomic levels (Anderegg et al. 2018, Treurnich et al. 2019), showing that these functional traits are relevant in the adaptation of species to specific environmental conditions, via niche conservatism. However, other studies indicate that relevant proportions of variation within species can be found (Albert et al. 2010, Siefert et al. 2015, Westerband et al. 2021), suggesting that within species acclimation is also occurring in niche occupation.
Critical to testing the validity of global dynamic vegetation models is the use of remote sensing of biodiversity, which can be accomplished by measuring the spectral reflection of biological entities at different scales, from that of a single leaf to a canopy or a whole ecosystem (Cavender-Bares et al. 2020, Serbin & Townsend 2020). Leaf spectral traits are a reflection of chemical changes in the foliar tissue of plants due to resource availability, including sunlight, nutrients, and water acquisition, resource use, seasonal changes, and even due to evolutionary history (Carter & Knapp 2001, Cavender-Bares et al. 2017, Meireles et al. 2020). Given the relevance of spectral traits to reflect the physiology and functioning of plant biota, it can be expected that these should be linked to other traits that determine plant function, such as nutrients, foliar mass per unit area, and leaf elemental stoichiometry (Carter & Knapp 2001, Ustin et al. 2004, Asner et al. 2014, DuBois et al. 2018).
A special case of the use of the spectral responses of foliar tissue as functional traits is the calculation of vegetation indices (VI). VI are equations derived from measurements of discrete wavelength bands within the absorption spectrum of a material, which can provide information on the status of vegetation and surrounding soils (Myneni et al. 1995). Given that VI are a principal asset in exploring natural resources using remote sensing, it is relevant to determine the patterns of variation at the scale of individual plants and their association with leaf development, as plants should aim to optimize water and light use during the moments of abundant resource supply, particularly in seasonal environments (Pettorelli et al. 2005). By combining physiological data with vegetation indices and climatic data, it is possible to calculate estimates of carbon exchange (Garbulsky et al. 2008, Cueva et al. 2021), water use (Pettorelli et al. 2005), and nutrient stoichiometry (Asner et al. 2014). Within semi-arid ecosystems, where water availability varies strongly throughout the year (Elmore et al. 2000, Schmidt & Karnieli 2000), leaf spectroscopy via remote sensing has allowed the identification of the most vulnerable regions for tree mortality due to prolonged drought (Asner et al. 2016).
Because most semi-arid ecosystems face seasonal drought, there are competing selective pressures on individuals, with the result that some species rely on costly leaves, with a high proportion of dry mass, able to avoid excessive evapotranspiration ([semi]-evergreen species), while other species have low-cost leaves with high transpiration rates, that are shed early during the beginning of the dry season (deciduous species) to reduce the risk of hydraulic dysfunction (Méndez‐Alonzo et al. 2019, González-Rebeles et al. 2021). Given that evolutionary pressures, mainly related to withstanding drought, have shaped the functional strategies of plant species from Mediterranean-climate ecosystems (Ackerly 2004), plant functional traits vary in accordance to different strategies to overcome the negative effects of aridity, either by increasing resistance, or avoiding being negatively affected by drought (Valencia et al. 2015, Díaz de León et al. 2021). Modulation of phenology is one of the main responses to climatic variation (Piao et al. 2019), and thus its regulation is critical to determine the performance of individuals and consequently, during drought, species may vary in their rates of foliar senescence, when leaves lose their chlorophyll, accessory pigments, and water content (Ustin & Jacquemoud 2020). In turn, drought may cause modifications of their spectral properties (Cotrozzi et al. 2017, 2020, Grulke et al. 2020). Although the spectral variation via teledetection has been associated with metrics of growth, foliar phenology, and functional traits (Kothari et al. 2023), few reports have treated this relation in chaparral ecosystems without partitioning the variance among or within species (Ustin et al. 1998, Stylinski et al. 2002). It is critical to understand how phenology and foliar spectroscopy are coupled among and within species throughout the year because understanding these patterns at the leaf scale may allow an explanation of the temporal variation in vegetation reflectance, which may be critical to the validation of remote sensing surveys of vegetation.
We evaluated the covariation of spectral traits with stem and leaf functional traits of nine species in chaparral in Baja California, Mexico. Taking into account precipitation, air temperature, and soil water content during nine months of 2017 and 2018, we quantified variation in number of leaves and stem growth, as well as three VI: The Normalized Difference Vegetation Index (NDVI), the Photochemical Reflectance Index (PRI), and the Water Band Index (WBI). These VI have all shown associations with vegetation performance. NDVI is typically associated with green biomass and the reflectance of photosynthetic pigments (Peñuelas & Filella 1998). PRI is an indicator of radiation use efficiency, permitting an estimate of the seasonal variation and inter-annual productivity of vegetation (Garbulsky et al. 2008). WBI is a sensitive measure of the change in canopy water content (Claudio et al. 2006). By compiling this data, we tested for correlations of VI with foliage variability and functional traits in this Mediterranean-climate vegetation. Our working hypothesis was that species with lower growth rates will be evergreen in leaf habit, and consequently would have less variability in the VI. In the opposite case, fast-growing species will be deciduous species, with higher variability in the VI. Altogether, our results would allow an explanation of the patterns of temporal variation in functional and spectral traits, both interspecifically and intraspecifically, within a semiarid ecosystem.
Materials and methods
Study area. This study was performed at Rancho El Mogor in Valle de Guadalupe, 18 km North of Ensenada, Baja California, México at 406 m asl (32° 01’ 54’’ N, 116° 36’ 11’’ W; Figure S1). Valle de Guadalupe is semi-arid, with Mediterranean-type climate (Del Toro Guerrero & Kretzschmar 2020), characterized by winter rains from November through April and dry, warm summers from May through October (Del Toro Guerrero et al. 2014). The mean annual temperature was 17 °C, and the mean annual precipitation was 309 mm from 1980 through 2009, with high inter-annual variability, from ca. 80 to 600 mm (Del Toro Guerrero et al. 2014). The study site was located within the Southern California Floristic Province, where the vegetation has mainly elements of sclerophyllous evergreen chaparral, intermixed with coastal Diegan sage scrub vegetation elements (Westman 1985), with an average height of 1 m. For this study, the nine most abundant shrub species were selected, which encompass over 80 % of the soil cover in the site, in addition to one herbaceous species that was not sampled: Ornithostaphylos oppositifolia (Parry) Small, Adenostoma fasciculatum Hook & Arn, Erigonum fasciculatum Benth, Xylococcus bicolor Nutt, Rhamnus crocea Nutt, Cneoridium dumosum (Nutt. ex Torr. & Gray) Baill, Salvia apiana Jeps, Malosma laurina Nutt ex Abrams, and Fraxinus parryi Moran, from highest to lowest cover (Díaz de León et al. 2021). Grapevine and olive agriculture are the main economic activities within the area (Espejel et al. 1999).
Meteorological measurements. Air temperature (via sensors HMP155, Vaisala, Helsinki, Finland), precipitation (TR-525M, Texas Electronics, TX, USA), and soil water content (Hydra Probe II, Stevens, Portland, OR, USA) of the study area were obtained from the instrumentation from an Eddy Covariance Tower within Rancho El Mogor (32° 01’ 49.15” N, 116° 36’ 56” W, EMg in the LNC-MexFlux network), less than 100 m from the studied individuals. The raw data was recorded in a datalogger (XLite 921B, Sutron, Sterling, VA, USA) and was processed in LI 7x00 File Viewer (LI-COR, Lincoln, NE, USA) to obtain the mean monthly values of air temperature, precipitation, and soil water content (%) at 5 and 10 cm depth.
2018 was an abnormally dry year in Baja California, with total annual precipitation of 95 mm in Valle de Guadalupe. To corroborate local measurements, data were also extracted from a meteorological station from CICESE, located at 3.3 km from the study site, at 32° 0’ 0.00’’ N, 116° 36’ 10.0’’ W.
Species sampling. Measurements were performed from the end of the dry season, September 2017, through May 2018, which corresponded to the beginning of the 2018 dry season. Thus, the measurement period was nine months, covering the end of one dry season, the growth period, and the first month of the next dry season. For each species, six individuals were randomly selected that were at least 5 m apart from each other (Figure S1). For each individual, a terminal south-oriented 25 cm branch was marked to follow leaf turnover monthly. Each month during the survey, three vegetation indices, leaf number, leaf area, and stem growth, were quantified within the same branches or an adjacent one if the marked branch was damaged or missing.
Vegetation indices. For each individual, a set of three healthy, fully expanded leaves (or 1 cm2 of leaves in the case of species with fascicled needle-type leaves) within the same marked terminal branches were selected to perform the spectral measurement with a portable spectroradiometer (PP Systems, UNISPEC SC Single Channel, Amesbury, Massachusetts, EUA), in the range of 300 to 1,100 nm. The individuals pertaining to the same species were measured during the same days around midday (between 11 to 13 h). From the spectral reflectance, the bands corresponding to near-infrared (NIR, from 800 to 900 nm), red (R, from 600 to 650 nm), superior red (RED_S, from 564 to 576), inferior red (RED_I, from 525 to 537 nm), near superior infrared (NIR_S, from 954 to 986 nm), and near-infrared inferior (NIR_I, from 884 to 916 nm) were extracted, to calculate the vegetation indices as follows: Normalized Difference Vegetation Index (NDVI):
NDVI = (NIR - RED) / (NIR + RED); the Photochemical Reflectance Index (PRI), PRI = (RED_S - RED_I) / (RED_S + RED_I); and the Water Band Index (WBI), WBI = (NIR_I) / (NIR_S).
Foliage variability. For each individual, every month, the total number of leaves in the marked terminal branch was counted manually. Because species varied in leaf area and in the absolute number of leaves per branch, ranging from less than 12 (e.g., M. laurina) to several hundred (e.g., A. fasciculatum), an index of relative state of foliage, the relative number of leaves (Δleaf) was calculated for each individual each month as the ratio of leaf number relative to the month with the highest amount of leaves:
Proportion of leaves in individual i at month j, PLij = leaf number individual i at month j / annual maximum number of leaves for individual i
The ratios were then averaged among all individuals per each month of study within each species to obtain the average variation of relative leafiness per month for each species, and subsequently, the monthly ratios were averaged to obtain the annual average deviation of leafiness relative to the maximum for each species. Finally, annual Δleaf was obtained as (1 - annual average deviation of leafiness), thus could range from zero, which would imply that no difference in leaf number was found during the survey, to values approaching 1 for prolonged and substantial bareness.
Leaf area. For each individual, every month, a branch adjacent to the marked one was cut (25 cm, south-oriented, healthy branches). The branches were placed in a sealable plastic bag with moistened paper on the inside to avoid excessive loss of water, and transported within the same day to the lab, where they were placed in a bucket covered with a black plastic bag to allow for overnight rehydration. The following day, each leaf was photographed with a digital camera in an adaxial position (with a resolution of 1,334 × 750 pixels at 326 dpi). The resulting images were processed in the software ImageJ (National Institute of Health, EUA, imagej.nih.gov). In this way, the monthly average leaf area per 25 cm of stem length was obtained per species.
Branch growth. With a measuring tape, every month, the length of the marked terminal branch was measured on each individual; monthly growth was calculated, then averaged for each species. From the beginning of the experiment, the closest branch bifurcation to each 25 cm branch was double-marked with plastic flagging and colored wires. On some occasions, it was necessary to change the marked branch because of herbivory or mechanical rupture.
Functional traits. During the first month of the sampling (September 2017), functional or structural traits of leaves and stems were quantified for each species. These included individual heights (H in m), summed basal diameters (BA in cm), and cover per plant (m2). Above-ground biomass for each species in the same study site was obtained from Díaz de León et al. (2021).
For all individuals, a branch near to the spectral measurements branch was also cut for foliar functional trait measurements. The branches had at least 20 leaves, and after overnight rehydration, leaves were placed in sealable bags for the following measurements: leaf length, width, thickness, leaf area, leaf mass per unit area (LM), and leaf mass dry content (LDMC). All measurements were performed following the standardized methods of Pérez‐Harguindeguy et al. (2013). Leaf length, width, and thickness were measured using a digital caliper. LA was calculated with the scanned image (scanner Perfection 4490; Epson Corp. Nagano, JP, US), taken on the day after collection (after overnight rehydration), and images were processed using ImageJ (ImageJ, National Institutes of Health, USA). We weighed the fresh and dry mass (Mettler Toledo) after rehydration and after 72 h at 70 °C to calculate LDMC (%) as 1- [(fresh mass - dry mass) / fresh mass] × 100.
Statistical analysis. To determine if there were significant relationships between all variables, linear correlation matrices were calculated between functional, structural and spectral traits. The intra and interspecific variation in relative leaf number (Δ, “phenology”), leaf area, and growth were compared using one-way ANOVA (F- values). However, for the three vegetation indices, given that the assumptions of normality and data heteroscedasticity were not met via Shapiro Wilk tests (NDVI = 0.9, P < 0.05; PRI = 0.77, P < 0.01; WBI = 0.51, P < 0.01), Kruskal-Wallis non-parametric tests (H - statistics) were performed. Statistical analyses were performed with JASP 0.8.6.0 (JASP Team 2024, Love et al. 2019).
To partition the variance for the vegetation indices (VI), a mixed model was employed, with VI values as response variables and species (fixed factor) and the variability within species due to the month of the survey (random nested factor) as explanatory variables, in R (R Core Team 2019) with the nlme package (Pinheiro et al. 2007). One analysis was performed per each VI (NDVI, PRI, and WBI). If significant differences were found in each analysis, multiple comparisons using the Tukey procedure were performed, using the multcomp package (Hothorn et al. 2016). From the mixed-model nested ANOVAs, we extracted the sum of squares from species, months within species, and the residual unexplained error. Finally, foliage variability, spectral and functional data were summarized using a principal component analysis. From these analyses, a path diagram was constructed, integrating traits with the principal components that had λ > 1, and showing the patterns of covariation among traits.
Results
During the study period (September 2017 to May 2018), we were able to capture the onset, peak, and decline in soil moisture, even though the year under study was particularly dry in comparison with the long-term record for the area (Figure 1A). Even with the low precipitation, there was an increase in soil moisture, both at five and ten cm depth, that followed the main precipitation events (Figure 1B). Precipitation was positively associated with soil moisture at 10 cm depth (R = 0.77, P = 0.02), and at 5 cm (R = 0.70, P = 0.05). Air temperature had no association with rain or soil moisture variables.
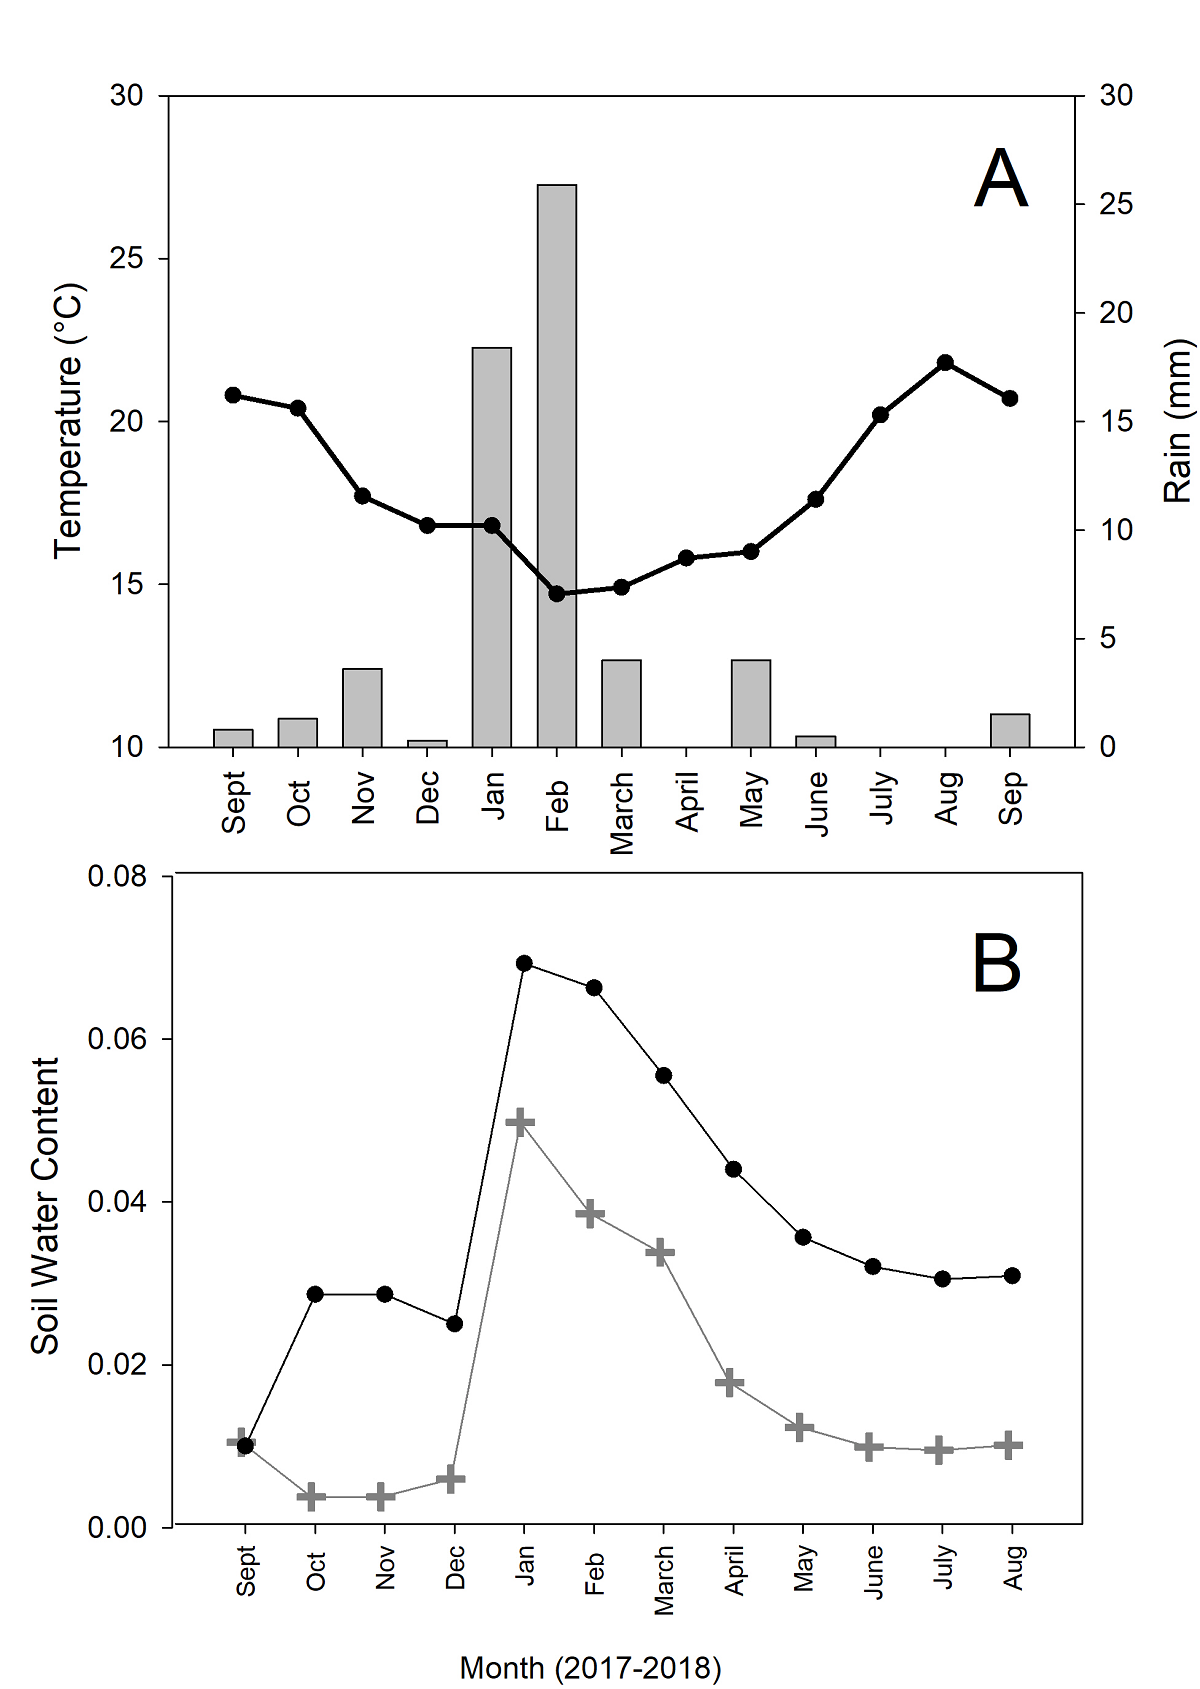
Figure 1 A. Air temperatures (black line and circles) and accumulated monthly rain (bars)from October 2017 to May 2018 at Rancho El Mogor, Baja California, México. B. Volumetric soil water contents (unitless) at 5 cm depth (grey line, crosses) and 10 cm depth (black line, circles).
Species differed significantly in annual average relative leaf number (Δ) through the year (F = 73.4, P < 0.001, Figure 2A). The average value of Δ for all the studied species was 0.34; the species that had the lowest variability was M. laurina, which showed a Δ of 0.10. Three species were deciduous with values of Δ above the mean level of the sampled species, F. parryi = 0.69, S. apiana = 0.47, and E. fasciculatum = 0.39, and the rest of the species showed an evergreen habit but with varying levels of Δ (Figure 2A).
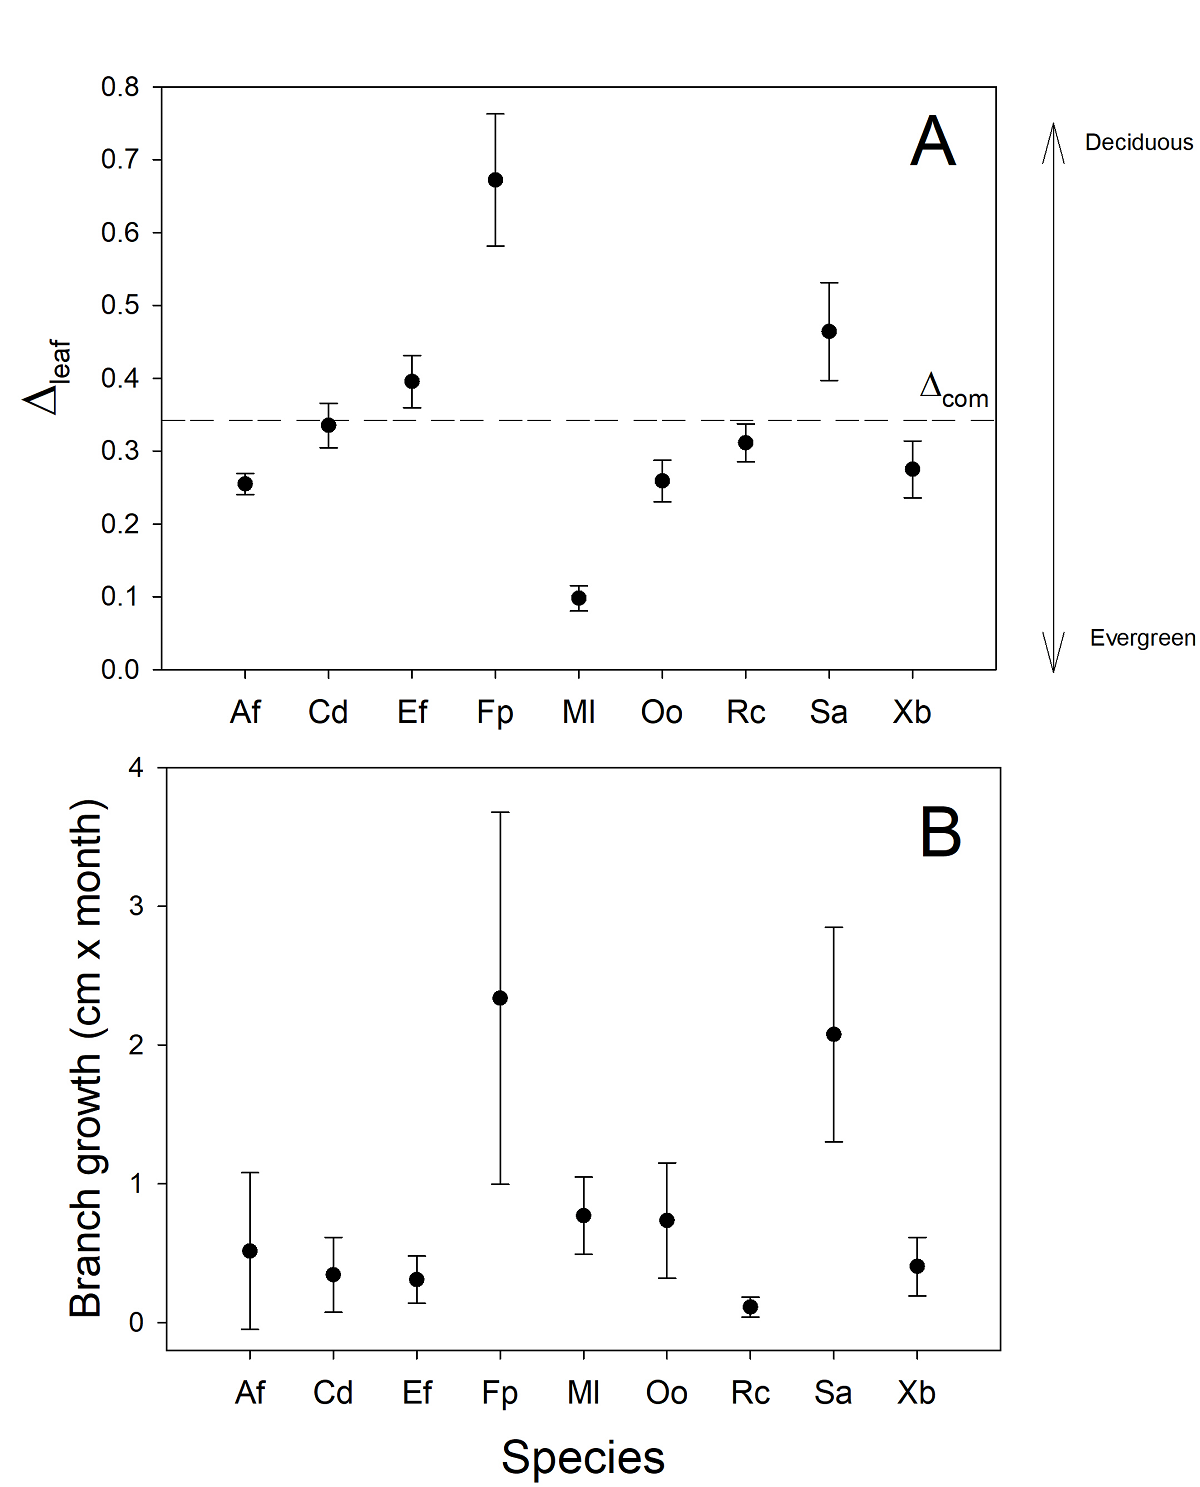
Figure 2 Annual average of relative leaf number (Δ) of nine chaparral species, obtained from monthly leaf counts from nine months between 2017- 2018 at Rancho El Mogor, Baja California, México (A). Absolute longitudinal growth at the branches employed to quantify Δ. Bars are standard errors of the mean.
Average stem growth among species was 0.84 cm per year, and this trait also showed interspecific variability (H = 24.3, P = 0.001), with deciduous species showing greater stem elongation (Figure 2B). The species with the highest stem growth was F. parryi, followed by S. apiana. Evergreen species showed less variability in stem length growth, and the species with the least growth was R. crocea (Figure 2B).
Intra and interspecific variation in vegetation indices. The three vegetation indices (VI) varied within and among species. NDVI showed high variability among species (H = 27.1, d.f. = 8, P < 0.01, Figure 3A), and most species also displayed intraspecific variability in this trait across time. The highest values of NDVI were found in X. bicolor and F. parryi, and the lowest was found in O. oppositifolia (Figure 3A). PRI variation was significant among species (H = 20.6, d.f. = 8, P = 0.008; Figure 3B), and PRI was higher for S. apiana and lower for O. oppositifolia and E. fasciculatum (Figure 3B). Finally, WBI (H = 23.4, d.f. = 8, P = 0.003; Figure 3C) was higher for O. oppositifolia and lower for S. apiana (Figure 3C).
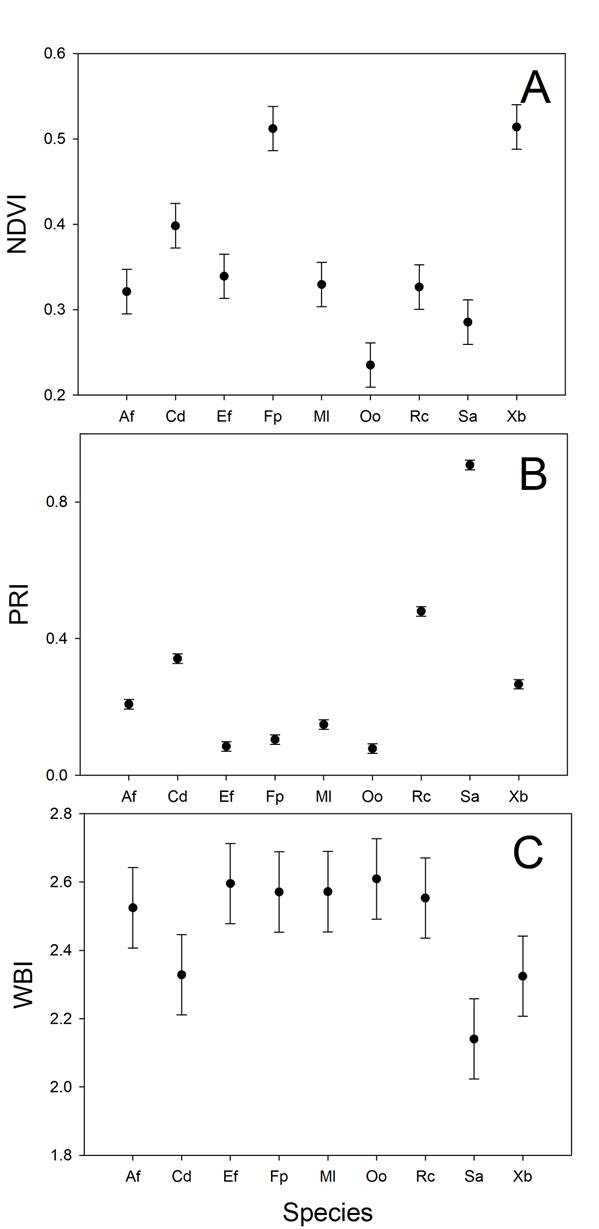
Figure 3 Interspecific variability in three vegetation indices obtained from the leaves of nine chaparral species, obtained from monthly leaf measurements from nine months between 2017- 2018 at Rancho El Mogor, Baja California, México. NDVI: Normalized Difference Vegetation Index, PRI: Photochemical Reflectance Index, WBI: Water Based Index. Bars are standard errors of the mean.
The partition of variance showed that most of the variability in the VI database was due to variation within species across time (ca. 55 %), followed by the effect of species per se (ca. 20 %), and finally, there was ca. 25 % of unexplained residual error in the three VI (Figure 4).
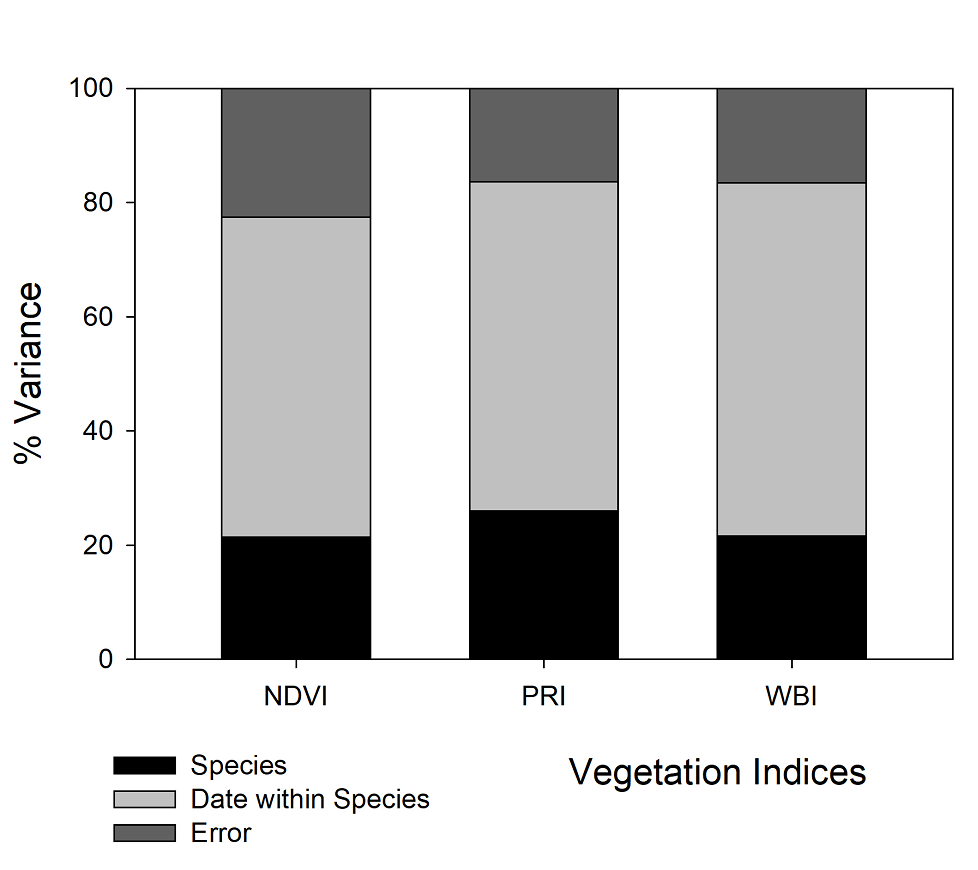
Figure 4 Interspecific, intraspecific, and residual error variance obtained for three vegetation indices measured in the leaves of nine chaparral species. Measurements were performed across nine months between 2017- 2018 at Rancho El Mogor, Baja California, México.
Correlation of vegetation indices and functional traits. When tested for the same individuals and dates, the three vegetation indices showed significant correlations among them (Table 2). The three vegetation indices also had significant associations with foliage variability and leaf area, which in turn was strongly associated with foliage variability (Table 2). The NDVI was also positively related to stem growth, but neither WBI nor PRI were related to stem growth (Table 2). When comparing the average values for all individuals for all months with other functional traits (Table S1), no significant associations were found (Table S2).
Table 1 Species abbreviation list and their contribution with relative cover and aboveground biomass parts. Abbr. = Abbreviation, W = percentage of wood biomass per total aboveground biomass, including litter; L = percentage of leaf biomass per total aboveground biomass, including litter; F = percentage of flower and fruits biomass per total aboveground biomass, including litter; Li = Litter biomass as percentage of total aboveground biomass.
| Species | Family | Relative cover (%) | W | L | F | Li |
|---|---|---|---|---|---|---|
| Ornithostaphylos oppositifolia (Parry) Small | Ericaceae | 30.8 | 23 | 10.5 | 1 | 65.5 |
| Eriogonum fasciculatum Benth. | Polygonaceae | 17.52 | 65.3 | 8.2 | 0 | 26.5 |
| Adenostoma fasciculatum Hook. & Arn. | Rosaceae | 16.7 | 79.7 | 8.5 | 0 | 11.8 |
| Xylococcus bicolor Nutt. | Ericaceae | 6.4 | 35.0 | 29.5 | 11.2 | 24.3 |
| Rhamnus crocea Nutt. | Rhamnaceae | 3.94 | 87.0 | 13.0 | 0 | 0 |
| Cneoridium dumosum (Nutt. ex Torr. & Gray) Baill. | Rutaceae | 3.53 | 67 | 14.5 | 0.5 | 18.0 |
| Malosma laurina Nutt. ex Abrams | Anacardiaceae | 2.6 | 63 | 4 | 1 | 32 |
| Salvia apiana Jeps. | Lamiaceae | 3 | 95 | 5 | 0 | 0 |
| Fraxinus parryi Moran | Oleaceae | 1.5 | 87 | 11 | 2 | 0 |
Table 2 Correlation matrix between three vegetation indices and three functional traits measured in six individuals of nine chaparral scrub species during nine months (October 2017 to May 2018) in Rancho El Mogor, Valle de Guadalupe, Baja California, México. NDVI: Normalized Difference Vegetation Index, PRI: Photochemical Reflectance Index, WBI: Water Based Index, Growth: stem longitudinal growth, Phen: relative leaf number, LA: leaf area.
| Variable | NDVI | PRI | WBI | Growth | Phen | LA | |
|---|---|---|---|---|---|---|---|
| NDVI | Pearson's r | - | |||||
| p-value | - | ||||||
| PRI | Pearson's r | 0.335 | - | ||||
| p-value | 0.004 | - | |||||
| WBI | Pearson's r | 0.514 | 0.856 | - | |||
| p-value | < .001 | < .001 | - | ||||
| Growth | Pearson's r | 0.232 | 0.052 | 0.182 | - | ||
| p-value | 0.048 | 0.660 | 0.120 | - | |||
| Phen | Pearson's r | 0.434 | 0.234 | 0.416 | 0.201 | - | |
| p-value | < .001 | 0.044 | < .001 | 0.084 | - | ||
| LA | Pearson's r | 0.487 | 0.409 | 0.450 | 0.200 | 0.572 | - |
| p-value | < .001 | < .001 | < .001 | 0.085 | < .001 | - |
Five structural and functional traits and the three vegetation indices for the nine species were summarized via principal components analysis (Figure 5). We found evidence that three components had eigenvalues > 1, together summarizing ca. 79 % of the variation in this dataset (Figure S2), with the first component summarizing 35 % and being associated with stem growth, foliage variability, LMA, and shrub height. The second component summarized 31 % of the variation and was associated with foliage variability, LMA, shrub height, leaf area, and the WBI index. Finally, the third component summarized 13 % of the variation and was associated with NDVI and PRI indices, plus shrub height and foliage variability (Figure 5, Table S2).
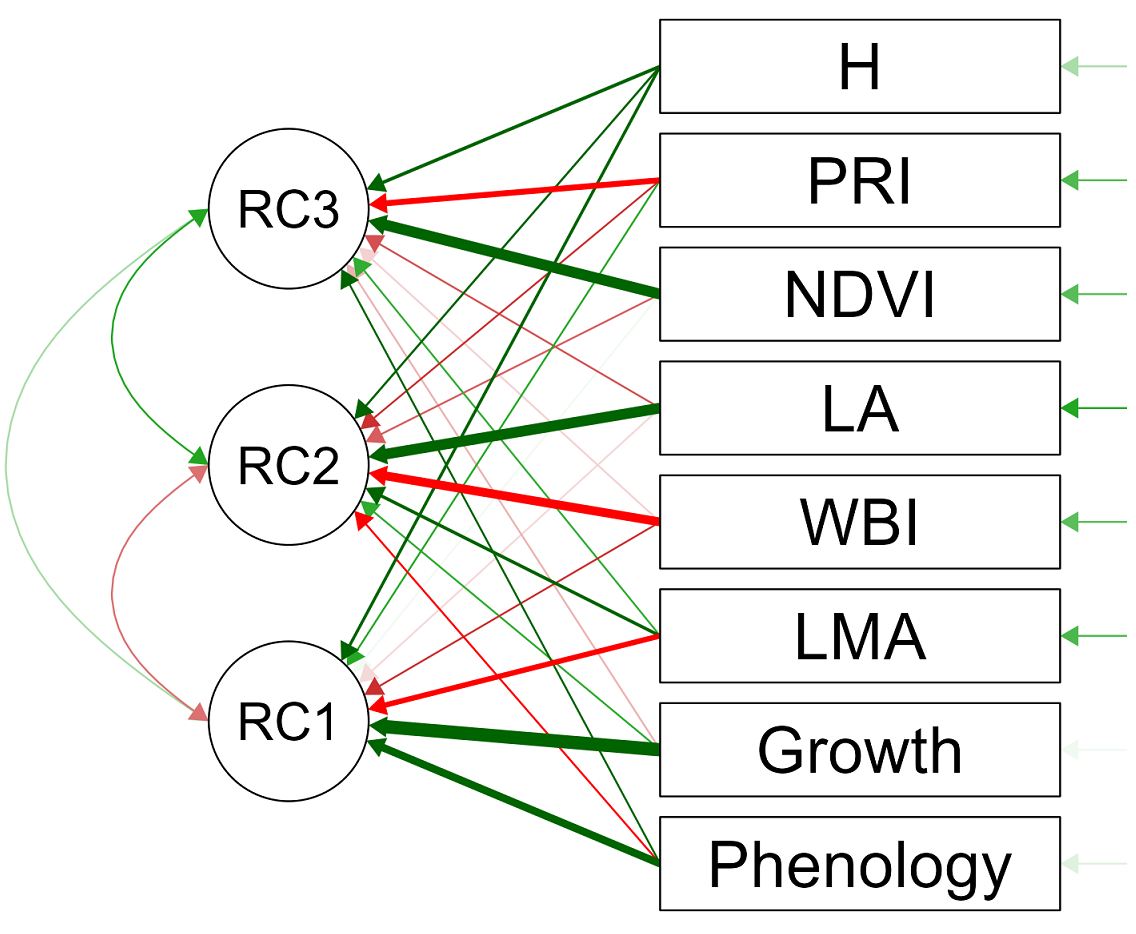
Figure 5 Path diagram showing the correlations between five functional traits and three vegetation indices with the first principal component (RC1) summarizing 35 % of the variability, the second principal component (RC2) summarizing 31 % of the variability, and the third principal component (RC3) summarizing 13 % of the variability from nine chaparral species at Rancho El Mogor, Baja California, México. Functional traits: Phenology: average relative leaf number, LA: leaf area, Growth: stem longitudinal growth, H: Shrub height, LMA: Leaf mass per unit area). Vegetation indices NDVI: Normalized Difference Vegetation Index, PRI: Photochemical Reflectance Index, WBI: Water Based Index.
Discussion
Our exploration of the inter and intraspecific variability in three vegetation indices, and their patterns of covariation with phenology, growth, and leaf areas, indicate that a high percentage of the variability in these traits is due to intraspecific seasonality, as the time of measurement of foliar spectroscopy determines a high percentage of variability in the dataset, even more than among-species differences. Even when this study included species with contrasting patterns of leaf display and growth, our data suggest that any remote sensing evaluation of vegetation using indices in chaparral should take into account this high seasonal variability. Additionally, our results indicate that species vary in a concerted fashion regarding phenology and some functional traits, where deciduous species have faster volumetric growth than evergreen species, and NDVI has several associations with key biological traits in chaparral, more than the other two vegetation indices tested. Altogether, our results may shed light on the biological causes of foliar spectral variability in seasonal environments.
Interspecific covariation among stem and leaf functional traits and its correlation to NDVI. Similar to other frost-free environments (e.g., dry tropical forests and subtropical deserts, Medina 1995, Méndez‐Alonzo et al. 2012, González-Rebeles et al. 2021), we found high variability in the structure and functional traits of leaves among species. In particular, variation in foliage or relative leaf number, expressed as the average ratio of monthly leaf number to yearly maximum leaf number (Figure 2), showed high interspecific variation, ranging from species that deploy new leaves within the short rainy season during winter and drop these leaves entering the hot dry summer (particularly F. parryi, Figure 1) to species that maintain practically the same number of leaves through the year (such as M. laurina). These changes were accompanied by variation in volumetric growth on the stem, suggesting that the species that have short-lived leaves are highly productive during the brief season when soil water availability is high, investing in long-term structures in the stems. In contrast, the species with longer times to replace the leaves had low volumetric growth in stems, suggesting that the maintenance of long-lived leaves entails costs to enhance survival, at the expense of rapid growth (Grime 2006). Thus, species may be arranged along a gradient of phenotypic variation, inducing varying strategies to exploit temporally variable resources, as has been found in several seasonal ecosystems of the world (Medina 1995, Reich 2014, Li et al. 2018, Volaire 2018).
We found associations of both foliage phenology and stem growth with NDVI. This index is based on foliar reflectance of red and near-infrared spectral bands, correlating with the function of the chlorophyll complexes and, secondarily, with the amount of intracellular water in the leaves (Sims & Gamon 2003). In concordance, although the correlation was weak, we found the highest values of NDVI in the species with higher foliage variation and higher stem growth (S. apiana, F. parryi), and the lowest values of NDVI in species with evergreen habits (A. fasciculatum, O oppositifolium). Given that the community composition is more biased towards evergreen species (Díaz de León et al. 2021), NDVI is an appropriate physiological indicator of the hydrological status of this type of vegetation (Del Toro Guerrero et al. 2022). Future phenology surveys may benefit by employing a combination of NDVI and water-based indices, thus encompassing the variety of physiological strategies within this type of community. However, taking into account the high intraspecific variability, other vegetation indices currently less employed, such as PRI and WBI are also suitable to employ as indicators of the state of vegetation within this region.
Seasonal inter and intraspecific variation in spectral traits within a semiarid ecosystem. In Californian Mediterranean-type vegetation, experimental treatments have shown that species ranking, regarding stem and functional traits, are maintained irrespective of the level of water availability present in the environment (Funk et al. 2021). Our results indicate that most of the variability of our vegetation indices (VI) was found within species across time. Our data indicate that among-species differences in VI on all dates account for only ca. 20 - 25 % of the total variability of the data. In contrast, variability within species across time accounts for more than 50 % of all the VI variation. This implies that seasonality has a profound impact on the reflectance values of leaves in this environment, even though chaparral is traditionally considered an evergreen community (Cooper 1922). Spectral variability found in VI is associated with gross primary productivity at the ecosystem level in chaparral (e.g.,Sims et al. 2006, Cueva et al. 2021), and probably with water-use efficiency and biomass production at the individual plant level. These patterns merit further research, particularly given the scenarios of persistent and intensifying droughts in Western North America (Cook et al. 2015, Williams et al. 2020). We found less than 25 % of the unexplained variance, may be due to the species inter-individual variability in leaf characteristics. We attempted to use only leaves without evident damage and of the same cohort and we expect the intra-individual variability in this ecosystem to be less marked than in other ecosystems where the difference between sun and shade leaves is striking (Niinemets et al. 2015).
Our dataset found high variability within species for three commonly used VI. However, we are aware that evaluating the interannual variability in both functional and spectral traits would provide valuable information to achieve higher resolution in remote sensing surveys, particularly because the study year was unusually dry; high interannual variability in precipitation is typical of this region (Del Toro Guerrero & Kretzchmar 2020). Employing spectrometers with higher resolution and recent developments in machine learning algorithms may boost the search for VI specific to the species of this community, allowing better surveillance of the condition of natural resources within this region.
In conclusion, we found that our study species responded to varying soil water availabilities, both in the foliage variation and in the underlying leaf reflectance values. Concurrently, they varied in leaf area, leaf abundance and stem growth through the year. This variation was correlated with NDVI, PRI, and WBI. However, most variability in the vegetation indices for this community was due to intraspecific temporal variation, and secondarily with among-species variation, and finally by unexplained variation, and were decoupled from VI in this community. Future research should enhance the search for newly developed VI intrinsically coordinated with leaf structural and functional traits.
Supplementary material
Supplemental data for this article can be accessed here: https://doi.org/10.17129/botsci.3474

