1. Introduction
Reinforced concrete is one of the most commonly-used contruction materials in the world due to its physical and mechanical properties, which includes issues regarding its durability. These factors stimulate interest in the search for new technologies and new compounds as proposed improvements of certain characteristics or to its applicability (Mechtcherine et al., 2020; Nguyen; Castel, 2020; Kanellopoulos et al., 2020).
Improvements to materials technology has made it possible to produce concrete with special characteristics, such as lightweight concrete used for thermal insulation. The widespread use of this material is particularly attributed to its benefits of reducing specific mass and density, savings related to formwork, reinforcement, and in transportation costs, in the case of precast structures (Khodabakhshian et al., 2018; Zhang et al., 2020).
Cellular concrete is another type of low-density material, which is the main object of study in this paper, where it has been produced with additives that produce air bubbles within the concrete, decreasing its specific mass (Stumm; Schweike; Stemmermann, 2018; Trong; Asamoto; Matsui, 2018; He et al., 2018; He et al., 2019). Considering the many uses of cellular concrete because of to its lightness and lower specific weight, there is concern regarding the use of this material for reinforced concrete structural members, due to its potential behavior with regard to the propagation of steel reinforcement corrosion from the number of voids within the material and its lower mechanical strength (Du et al., 2020).
Concrete durability is an essential issue, as it makes it possible to understanding a material's performance throughout a structure’s lifetime (Kashani et al., 2017). Moreover, it can be affected by the action of external aggressive agents, such as chloride ions or carbon dioxide - CO2 (Shon et al., 2018; Nascimento et al., 2021).
One of the principal problems related to the durability of reinforced concrete is the corrosion of steel bars leading to the degradation or loss of the structural properties of the material. According to Badar et al., (2014), good quality concrete provides the necessary conditions to promote the pH of the passivation layer of the steel.
The central question of this study is to determine if the voids present from the incorporation of air within the cellular concrete mitigate the corrosion of the steel bars and make the process asymptomatic, i.e., without cracks or stains on the external face of the element? This hypothesis becomes viable by observing that concrete that undergoes a freeze-thaw cycle can be protected by the intentional incorporation of air.
In summary, then, the main objective of the study is to evaluate the behavior of reinforced concrete elements under the corrosion process when using cellular concrete (with incorporated air). This research not only provides a reference to determine the behavior of cellular concrete, but also as a proposal that covers some useful information for its application in the construction industry.
In summary, the main objective of this study is to evaluate the behavior of reinforced concrete elements under corrosion when using cellular concrete (with incorporated air). This study not only provides a reference to determine the behavior of cellular concrete, but also gives information useful for its application in the construction industry.
2. Experimental procedure
2.1 Materials
To manufacture the cellular concrete, the parameters studied by Mariz (2013), who performed durability evaluations on cellular concrete, were used. The test parameters were selected as the initial basis for the dosing procedures and their results, in terms of specific mass, were similar to those analyzed in this study.
The type of cement used was the national brand CPV - ARI MAX. This type of agglomerate was chosen due to its quick strength gain and absence of additives.
The added mineral content contained in other types of cement could contribute to the thinning and filling of pores within the concrete, which hinders the entry of aggressive agents and, consequently, prevents the corrosion of the steel bars from starting.
Natural fine aggregate of quartz origin (sand), from the Recife Metropolitan Area, was used. The natural sand was purchased for its specific physical characteristics and was acquired in a humid state, making it necessary to correct its water content through natural drying. To ensure the proper moisture content, 600 g of material were placed in an oven for 24 hours at a temperature of 100°C ± 2°C and, following this, 300 g were used for the granulometric characterization test, taking into account the fine aggregate granulometry according to the NBR NM 248 standard (ABNT, 2003). It was necessary to analyze the optimum usage zone of the fine aggregate (sand), because it can influence the ideal density of the cementitious composite (concrete). Through the aggregate particle size distribution, it was possible to obtain parameters such as the fineness modulus (FM) of 2.93 and the maximum diameter (Dmax) of 4.5 mm, classifying the material as fine aggregate with well-distributed medium grains. The results can be seen in (Figure 1).
The coarse aggregates (gravel) were also analyzed and, the granulometric classification showed them to have a Dmax of 12.5 mm and an FM of 6.48. This value was chosen by taking into account the thickness of the concrete plate (e = 50 mm), respecting the recommendation that Dmax be less than or equal to 1/4 of the smallest dimension of the mold. The granulometric curve of the material was not determined in this study, but the type of aggregate used was classified as gravel 1.
The additives used were: additive 1 - Techniflow 520, from MC Bauchemie. This plasticizer was used in the concrete matrix dosage with normal specific mass (family R); additive 2 - Gethal 2011, from Gethal. This is an atmospheric-based concentrated organic/chemical additive. It is used in the production of concrete with specific mass lower than 2000 kg/m³ (L1, L2, and L3 families).
After preliminary tests, the uniform mix used to produce the specimens was: 1Cement : 2.2Sand : 2.6Gravel : 0.60(w/c) by weight, which is, in mass, 353 kg/m³ of cement, 776.6 kg/m³ of sand, 917 kg/m³ of grave, and 211.8 liters of water; M% = 55% (mortar content); A% = 10.5% (water-dry matter ratio); and Plasticizer additive = 0.6%. For the light concrete, the plasticizer additive was replaced by an air filter (0.1% of the cement mass), varying the mixing time.
2.2 Methods
2.2.1 Preparation of the steel bars
Before testing, the bars were sanitized according to the G1-03 international standard (ASTM, 2017). A total of 72 steel bars of each gauge (6.3 mm, 8.0 mm, and 10.0 mm) were cut to a length of 30 cm, and 48 bars of each gauge were cut to a length of 20 cm. Following this, the steel bars were placed in a solution of 500 ml of hydrochloric acid, 3.5 g of hexamethylenetetramine, and 1 L of water, for 15 minutes. Then, they were washed under running water with the help of steel brushes, to remove the surface oxide layer and impurities. After drying, the bars were weighed before inducing the corrosive process.
2.2.2 Specimens used for analysis
The methodology used to develop this study was organized to be able to understand the behavior of lightweight reinforced concrete elements (cellular concrete) undergoing corrosion of its steel reinforcement. Throughout the process, the material elements were evaluated through electrochemical tests (corrosion potentials and resistivity) and physical tests on the steel bars (mass loss and tensile strength). The specimens were configured in the form of a plate, (35 cm wide x 35 cm high x 5 cm thick) as shown in (Figure 2).
The copper conductors made it possible to electrically connect the steel bars from the exterior, thereby controlling the corrosion potential. The choice of 5-cm-thick plates was made in order to facilitate the activation of the corrosive process through the entrance of chloride ions, by reducing the distance between the bar and the external surface. The samples were distributed between concrete having a common specific mass (reference) and three types of cellular concrete families (L1, L2 and L3) with light specific masses. This distribution can be seen in (Table 1).
Table 1 Number of plates developed and their mechanical behavior.
| Concrete family | Specific mass in the fresh state (kg/m3) | Steel gauges – CA 50 (mm) | Total number of specimens | Compressive strength (MPa) | ||
|---|---|---|---|---|---|---|
| 6.3 | 8 | 10 | ||||
| R | 2.3 | 6 | 6 | 6 | 18 | 33.5 |
| L1 | 1.9 | 6 | 6 | 6 | 18 | 8.94 |
| L2 | 1.7 | 6 | 6 | 6 | 18 | 2.15 |
| L3 | 1.5 | 6 | 6 | 6 | 18 | 0.61 |
For purposes of analysis, a steel mesh made of three vertical bars and two horizontal bars was developed, making a total of five steel bars in each concrete mold. The vertical bars serve as connecting elements for the three horizontal bars (Figure 3), creating a greater density of steel within the plate and, consequently, increasing the possibility of observing the characteristic symptoms of steel corrosion.
To produce the specimens, eight 18-mm thick slabs (2.10 m x 1.20 m) of coated wood were used. The coated formwork was chosen to provide a better surface finish for the concrete slabs and, in addition, to optimize their production, transportation, and concreting. A rectangular mold of dimensions (1.50 m x 0.65 m x 0.35 m), with internal partitions, was chosen. Each rectangular mold contained 36 forms. This mold is shown in (Figure 4).
2.2.3 Concrete specimen production and formwork removal
A total of 72 slabs (35 cm x 35 cm x 5 cm) were produced, and cylindrical specimens were also made for the mechanical characterization tests, but those results were not presented in this study. Due to the thinness of the plates, in order to facilitate the concreting operation and to guarantee a good finishing and filling of the molds, no spacers were used to align the steel mesh. The bars were centered inside the molds by hand. After removing the plates, they were kept protected from direct rain and sunlight for 28 days, and the wetting and drying process using a salt water solution was started. Before the start of the corrosion process, a visual inspection and photographic registration was performed to maintain the external physical characteristics of the plates.
2.2.4 Inducing corrosion of the steel bars
Two procedures were used to induce corrosion in the steel bars within the concrete plates. The first procedure, called (type 1), used the principle of galvanic corrosion. The copper functions as a cathode and the steel becomes the anode, losing electrons (corrosion). The material was also connected to the steel mesh (Figure 5 (a) and (b)) of each plate, located at the bottom of the formwork.
The second procedure (type 2) to induce corrosion was performed by passing the already molded concrete slabs (Figure 6 (a) and (b)), through repeated wet and dry cycles with 5% NaCl (sodium chloride) solution, following procedures found in the literature and in the study conducted by Ye et al., (2017). After 28 days, visual inspection and electrochemical tests (potential and resistivity) were performed, before beginning the plate immersion process. A complete cycle consisted of three days of immersion (with about 25 cm of water covering the plates) and four days of air drying (protected from direct sunlight).
2.2.5 Tests for control of concrete production
During the production of the concrete, two tests were performed to control its characteristics. These were: specific mass of concrete in the fresh and hardened state, performed according to NBR 9833 (ABNT, 2008) with the result obtained for lightweight concrete according to the procedures instituted by NBR 12644 (ABNT, 2014).
Concrete characterization tests were performed for each family according to their specific mass, in order to have comparative parameters and their respective behaviors for the steel bar corrosion process.
2.2.6 Covering of the steel bars and thickness of the concrete plates
In order to verify the covering of the steel bars on both faces of the slabs after concreting, electromagnetic sensors were used. This equipment, Hilti's Ferroscan PS200, was used to estimate the average covering of the bars on each of the slabs. In addition, images were taken to verify the positioning of the bars. A and B were nomenclatures given to the faces of the plates to represent the positioning of the steel mesh, as indicated in (Figure 7).
The thickness of the plates was measured with a tape to calculate the coverage of the steel bars in relation to face A.
2.2.7 Physical monitoring tests
The physical monitoring test was divided into two phases: visual inspection of the slabs and mass loss. With regard to visual inspection, a first analysis was performed a few days after concreting and before beginning the wetting and drying cycles. During the study period, other visual inspections were performed at the end of each immersion cycle to monitor the evolution of degradation. To analyze the visual appearance of the slabs, a criterion was developed for this study based on the existence of corrosion stains and characteristic cracks that can appear on the surface, as shown in (Table 2).
The second type of physical monitoring test was the evaluation of the mass of the bars lost at the end of the corrosion process. With this information, it was possible to verify which plates and which families were most affected by exposure to the aggressive agent. After removing all of the steel bars, they were cleaned with a solution of hydrochloric acid and water to remove all concrete residues that may have adhered to the bars, as well as any excess corrosion products. After a thorough cleaning, each bar was weighed to verify its mass loss, comparing the values before and after the study period. NBR 7480 (ABNT, 2007) indicates the requirements and criteria for the use of steel bars for reinforced concrete. In this case, the standard establishes a value for the mass of the bars per unit length, according to each gauge, as well as tolerance values.
2.2.8 Electrochemical monitoring tests
Two types of tests were used to monitor the evolution and likelihood of corrosion of the steel bars present in the slabs over time: corrosion potential and resistivity of the concrete surface. The corrosion potential test was performed according to C 876 (ASTM, 2015), which provides guidelines to evaluate the test criteria. The equipment used was Canin+ from Proceq+. Twelve points on each plate were tested: three horizontal lines, one at the top, one in the middle, and one at the bottom, with four points on each line. These points were located 10 cm apart. In this way, it was possible to map the full corrosion potential of the plates.
To measure the surface resistivity of the concrete, the four-electrode method (Wenner method) was used, with the Resipod equipment from Proceq. As with the corrosion potential test, water was sprayed onto the concrete surface before taking readings. As recommended by TC154-EMC (RILEM, 2003), each resistivity measurement taken was an average of five readings taken a few millimeters apart. Before the start of each wetting and drying cycle, in other words, after the four-day drying period and immediately prior to re-immersion of the slabs in water, the electrochemical monitoring tests mentioned above were performed.
3. Results and discussions
The central question of this study is whether or not the corrosion of steel bars in cellular concrete can be asymptomatic (without cracks or stains), different from traditional concrete and, for this, some considerations must be made. No cracks were observed in any of the cellular concrete slabs nor in the reference mixture (R). As for staining, only 7 slabs (10%) were asymptomatic, three from the R family and four from the L1 family.
It was not possible to state, based only on the conditions of this study, that the corrosion of steel bars in lightweight concrete will not generate cracking. Namkung et al., (2019) and Pachla et al., (2021) state that, for higher mass loss values, greater than those found here, a greater volume of corrosion products is generated, leading to greater expansion stresses and, consequently, the emergence of micro cracks.
According to Zhang et al., (2020), porosity and pore size have a significant effect on the mechanical behaviors of cellular concrete. The initial compaction phase of the material depends on porosity to a certain degree, which is explained by the collapse and compaction of surface pores or defects. Although 90% of the slabs had staining at different intensities, the variable covering of these slabs must be taken into account.
Stains occurred most frequently on face "A". When analyzing the estimated amount of covering, in general, for all families, face "A" was thinner than face "B". It is possible that different behaviors might be found with greater and more uniform coverage.
An interesting piece of information about the slabs from the L1 family, which were asymptomatic, is related to their coverage of the steel bars. Three of the four had thinner covers than the family average, and still showed no crack formation. These results do not agree with the analyses performed by Green (2020), who reported that the corrosion process, and consequently the staining, was independent of the covering of the steel bars and occurred expressively in aggressive environments.
The plates from families L2 and L3, the most porous ones, were visually classified as being more degraded, which was also verified by the loss of mass seen in the electrochemical monitoring tests. There was also a marked decrease in compressive strength when larger amounts of air were integrated into the concrete. Some of the slabs had a greater steel bar mass loss, and the L3 family had the second highest loss percentage.
For higher levels of mass loss, it is expected that a greater amount of corrosion products will be formed and this will appear more intensely on the surface of the slabs, as seen in the study by Du et al., (2020). However, the result of some of the plates, with regard to the corrosion process and staining was contrary to expectations. These slabs were visually classified as having mild degradation. This is an example where there is a possibility of the pores "absorbing" the stains (Figure 8 (a) and (b)) and in (Figure 9 (a) and (b)). This behavior was also seen by Liu et al., (2020) and Liu et al., (2021).
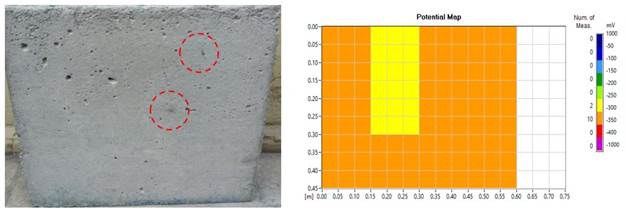
Figure 8 (a) "Absorption" of corrosion products through the pores; (b) Map of corrosion potential (no severe effects apparent).
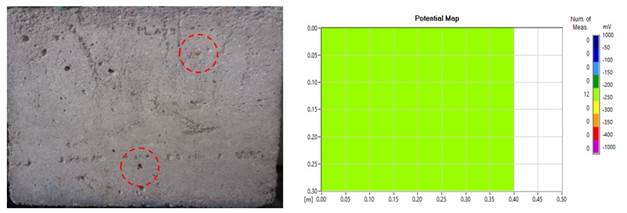
Figure 9 (a) "Absorption" of corrosion products through the pores; (b) Map of corrosion potential (no severe effects apparent).
Even if this is only an isolated occurrence, it should not be ignored. With respect to durability and other concrete properties, it was observed that the lightweight concrete studied was more susceptible to steel bar degradation than the reference concrete. S
Chung et al., (2019), Dong et al., (2020), and Al-Shwaiter, Awang, and Khalaf (2021) reported that the incorporation of low-density materials into concrete reduces energy consumption, with characteristics that meet the minimum mechanical properties to be effectively used as building materials.
3.1 Visual inspection
Of the 18 slabs in each family, 67% of the R group were classified as having a light degree of degradation and two were not relevant. The second "best" family in terms of least visual degradation, L1, had only two slabs classified as having a high degree of degradation. The two most visually degraded families, according to the proposed classification, were L2 and L3, having 44% and 61% of the slabs classified with a high degree of degradation, respectively. These analyses can be better seen in (Figure 10).
Regarding the physical behavior of the concrete slabs, it was noticed that the Na+Cl- (sodium chloride) solution triggered the corrosion of the steel bars, where some stains could be seen on the surface of the slabs. In (Figure 11 (a) and (b)), corresponding to plate family R, a high level of degradation was not evidenced and the values on corrosion potential map ranged from -350 mV to -400 mV.
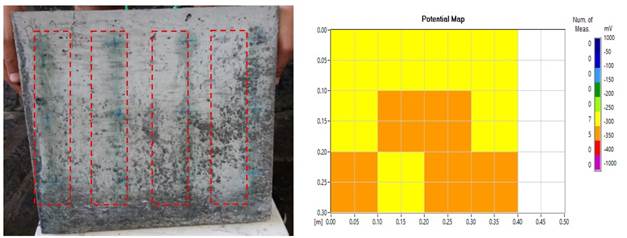
Figure 11 (a) Effects of surface degradation on the concrete slabs; (b) Map showing the corrosion potential (mild effects).
As for the slabs of family L1, it was noticed that the degradation caused by the presence of sodium chloride affected the durability of the steel bars, as seen in (Figure 12 (a) and (b)). The corrosion occurred at specific points on the plate and the surface stains occurred in the regions where the concrete layer was thinner. The mapping of the corroded steel bars, showed that the corrosion potential values ranged from -250 mV to -350 mV.
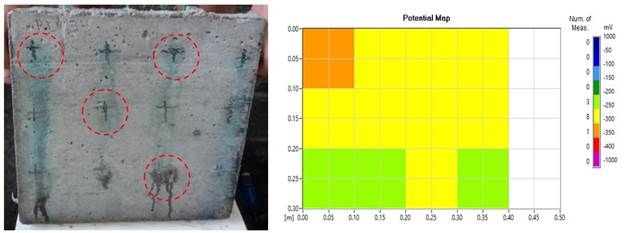
Figure 12 (a) Effects of surface degradation on the concrete slabs; (b) Map of corrosion potential (mild effects).
The degradation of the steel reinforcement within the concrete slabs of families L2 and L3 was the most severe, and the surface stains caused by the transport of oxides to the surface occurred because the physical behavior inside the material. The incorporated air content resulted in a higher void index that facilitated the ingress of chloride ions, leading to corrosion and pitting. The mapping of the corroded steel bars showed corrosion potential values ranging from -400 mV to -1000 mV for both families, as shown in (Figure 13 (a) and (b)) and (Figure 14 (a) and (b)).
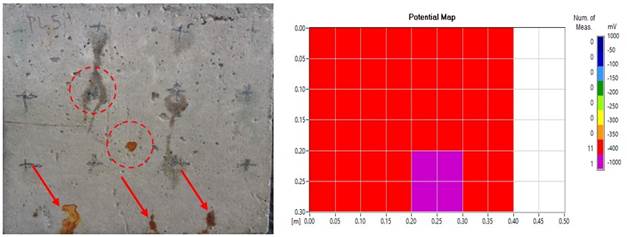
Figure 13 (a) Effects of surface degradation on the concrete slabs; (b) Map of corrosion potential (severe effects).
3.2 Corrosion potential
The evaluation criteria followed the procedures proposed by C 876 (ASTM, 2015). Values that are more electronegative than -350 mV have a 90% probability of corrosion, while values more electropositive than -200 mV have only a 10% probability of corrosion.
Values between these limits lie in the uncertainty range. During the experimental period, six tests were performed to measure the corrosion potential of the plates. The first was performed only a few days after concreting and the second immediately before the start of the NaCl immersion cycles. The other tests were performed during the study to follow the evolution of the corrosion of the steel bars contained in the concrete slabs.
The results of the corrosion potential tests for each family can be seen in (Figure 15). It is understood that the value representing the corrosion potential of the plate should be the most electromechanical (i.e., the one in the worst condition) among the 12 measured points.
The darkest points seen after the test, show the regions where readings were taken in an area of (10 cm x 10 cm). Among the 12 measurements of the corrosion potential, 10 fall within the region of uncertainty, but with values close to the safe range. The other two points were within an area having less than 10% probability of corrosion.
Some commentary can be made regarding the variation in corrosion potential for the slabs from all families. The first readings, taken only a few days after concreting, are located in the uncertainty zone. According to Hou et al., (2021) this occurs due to the presence of lime on the concrete surface or because of the formation of a water film on the steel bar.
With the second measurement, there was a tendency for the potential to shift towards the "safe" zone, with a corrosion probability of less than 10%. This behavior is attributed to the longer curing period, with the plates being drier and more protected. Immediately after the second reading, the immersion cycles were begun.
For the third reading (after 36 days), a sudden drop in the corrosion potential can be verified, especially for the most porous families (L2 and L3). When comparing the L3 family with the R family, it can be seen that the measurement of the corrosion potential at 120 days is less electronegative, -394 mV compared to the result for the R family of -431 mV, i.e., a difference of 9%, due to the high electrolytic activity of the chloride ions.
3.3 Electrical resistivity
To understand the effects of electrical resistivity on cellular concrete, it is necessary to analyze the microstructural parameters of the material, however, this was not a variable studied in this article. According to She et al., (2018) and Han, Lee, and Byun (2021) the formation of voids or micropores in the matrix of the cement composite enhances the diffusion of aggressive agents such as NaCl. The size of these pores can vary from 100 μm to 350 μm, and they can occur in different shapes, as shown in (Figure 16). The authors also state that, the larger the pore radius, the higher the electrical resistivity, ranging from 2 μm to 5 μm.
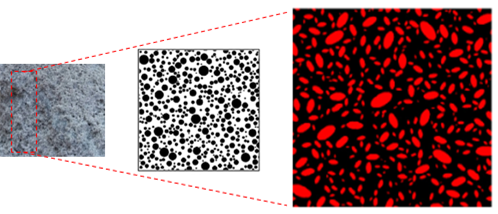
Figure 16 Examples of randomly-distributed pores having different shapes and a randomly-generated microstructure with radii between 2 μm to 5 μm. Source: Adapted from She et al., (2018).
The monitoring of reinforced concrete structures is necessary, because there are environments where they are required to have a longer service life. One of the issues to be evaluated is the degree of structural degradation due to permeability by sodium chloride (Yi et al., 2020). According to Lynch, Farrar, and Michaels (2016), electrical resistivity is a parameter used in damage detection, but this technique may not be feasible for some cement composites, due to the uncertain influence of many factors on the measurements obtained. Consequently, there are several studies on the influence of individual factors that improve the reliability of the results, such as: specimen geometry, water/cement ratio, types of percussive materials, aggregate size, curing conditions, and the presence of steel bars (Sanchez et al., 2016). For this study, concrete slabs containing steel bars were developed and the electrical resistivity was measured during the NaCl permeability period, with higher values initially observed for families L2 and L3 of 22.9 KΩ.cm and 36.2 KΩ.cm, respectively, which can be seen in (Figure 17).
A study conducted by Dong et al., (2020), corroborated the results obtained in this study, as the electrical resistivity of their samples increased sharply from 4.5 KΩ.cm to 16 kΩ.cm in 29 days. To better contextualize this point, a longer "resting" period in a dry place protected from rain and sun enhances resistivity up to 29 days, specifically for cement matrices with higher levels of incorporated air (which can more easily lose retained moisture), due to the number of pores formed.
After the start of the immersion process, a sharp drop in resistivity was observed, remaining between values of 1 to 10 KΩ.cm until the end of the study period, indicating a high activity/corrosion rate, according to the adopted criteria. The data agree with the studies conducted by Michel, Sørensen, and Geiker (2021), whose results indicated no significant difference in electrical resistivity, ranging from 0.5 to 2.5 KΩ.cm.
The studies conducted by Alnahhal et al., (2021) and Lokeshwari et al., (2021) indicate that the use of lower density materials in cellular concrete can improve electrical resistivity, where it ranges from 2.5 kΩ.cm to 5.0 kΩ.cm. Their results do not agree with those obtained in this study, because the higher the percentage of incorporated air, the higher the corrosion rate of the steel bars. This behavior can possibly be explained by the constant presence of chloride ions (strong electrolytes, facilitating ionic movement) and the possible retention of moisture within the concrete plates, because they were laid out to air dry for periods of 4 days.
All of the concrete families showed similar electrical resistivity behavior on the slab surfaces. According to Dong et al., (2020), more intense hydration can lead to higher cement consumption and, above all, high temperatures between the inside and outside of the concrete due to the heat released. This process can form microstructures that facilitate the passage of chloride ions into the cement composite and, in turn, lower the electrical resistivity. On the other hand, the first one hundred days of curing are significant in ensuring a sufficient electrical resistivity to contain the diffusivity of chloride ions, because the denser the material is, the lower its porosity.
3.4 Mass loss
The total mass loss of the steel bars per family followed a sequence, as shown in (Figure 18). Families L2 and L3, besides demonstrating higher electronegative corrosion potential values and a more degraded visual appearance (quantitatively and qualitatively), also obtained higher steel mass loss values (absolute and percentage).
In the analyses performed, it was observed that the concrete plates had a percentage mass loss from the steel bars of close to 2%, but when they were analyzed together (as families), this value ranged between 0.6% to 1%. A longer period of immersion in the NaCl solution would probably produce higher values of mass loss, but this was not necessary for this study, because the results obtained are considerable with regard to the formation of corrosion products. Family L3 had the highest percentage mass loss (Figure 19), when compared with families L1 (Figure 20) and L2 (Figure 21). This behavior may have occurred due to the fixed air content formed when mixing the material in the cement matrix. Another variable that can be taken into account is the mixing time for the concrete mixes, which was between 5 min and 20 min, where the air content formed varied between 5% and 40%.
In (Figure 22), it can be seen that, the higher the percentage of air incorporated within the cement composite (cellular concrete), the greater the total loss of mass from the steel bars, because the voids index facilitates the entry of aggressive agents. The advance of the corrosion products against the content of incorporated air grows exponentially as can be seen by the R² = 0.9482.
The mass loss from the L3 family (cellular concrete) was 55% higher than that of the R family (reference concrete). These results show that the incorporated air content of the concrete should be less than 10%, because it interferes in the improvement of mechanical properties and, moreover, enhances the corrosion of the steel bars within the material.
Concrete masses with low resistance tend to have less electropositive (Ecorr) values, highlighting that the readings for corrosion potential are not always due to the exposure time of the material in aggressive environments, but also to the type of additive used and the mass loss from the steel bars within the cement composite. To better contextualize this point, in (Figure 23 (a)), it was noticed that all families (R, L1, L2, and L3) had corrosion potential readings between -250 mV and -600 mV, but the data were not statistically different at 5% variance, as shown in the Pareto diagram (Figure 23 (b)).
4. Conclusions
When investigating whether reinforcement corrosion in cellular concrete may be asymptomatic, the presence of cracks was not observed for any family of concrete tested. However, it is necessary to point out that the non-occurrence of cracks was specific to the parameters used in this study. For example, the cover used (5 mm) and the severe conditions of exposure to wetting and drying in a NaCl solution. Other considerations were relevant to the tests performed, such as:
With regard to staining, despite the high incidence of this symptom, its occurrence may be related to the variable covering thickness between the slab faces (A and B). However, the concrete families with higher levels of incorporated air, had greater water absorption, and lower density and compressive strength.
With regard to the tests, families L2 and L3 (higher air content) presented more visual degradation, and also had the greatest steel mass loss. Therefore, given the results and analysis, the initial hypothesis can be discarded, because according to the results obtained, a greater incorporation of air did not mitigate corrosion, but instead led to an increase in the probability of the concrete presenting reinforcement corrosion.
The visual inspection analyses found the R group to have 67% of its slabs classified as lightly degraded and two being not relevant. With a percentage of 0.1%, the L1 family had lower degradation than the L2 and L3 families, which had 44% and 61% of their slabs, respectively, classified as highly degraded.
With regard to the corrosion potential, the R, L1, L2, and L3 families all had the same behavior after 29 days, with measurements more electropositive than -200 mV. During the 120 days, the corrosion potential of the L3 family was less electronegative, possibly due to the high electrolytic activity of chloride ions in the innermost layers of the cellular concrete.
With regard to electrical resistivity, after 29 days, the L2 and L3 families showed a large increase due to the internal stability of the voids and the presence of easily-lost water. This behavior provides the cellular concrete of both families with an insignificant corrosion risk, because it is greater than 20 KΩ.cm. After 36 days, all families presented a very high risk of corrosion, with values between 0 and 5 KΩ.cm.


 texto en


