INTRODUCTION
Water is the main body constituent of animals and a basic component in the functioning and maintenance of their physiological processes. It represents up to 74 % of soft tissue and participates in their vital processes (Speakman et al. 2001). Water is fundamental in saliva production for food mastication and swallowing, waste secretion, body temperature regulation, tissue lubrication, milk production, mineral balance, pH maintenance, and nervous system buffering (Mississippi State University 2008). As part of animal feeding, water is the simplest nutrient but the highest in volume for any given animal. Animals can withstand long periods of time without food, but they can only withstand a few days without water. Therefore, water availability in both quantity and quality not only represents a productivity factor, but also a sign of respect for animals and their rights to have a healthy and comfortable (Lardner et al. 2005).
Water quality in cattle ranches is influenced by natural and anthropogenic factors and can be internal and external. Internal factors can be geomorphology, range type and condition, water sources, cattle management, and rusting of machinery and facilities (Fava et al. 2002). In shrub-lands, dominant soils are sedimentary and calcareous, so water may be alkaline with high salt content and metals such as aluminum. Conversely, soils in grasslands are volcanic, alluvial, neutral or lightly acid, and low in salts (COTECOCA 1978). In terms of plant cover, there is an inverse relationship between basal cover and soil erosion by water (Havstad et al. 2007, Quiñones-Vera et al. 2009), which means higher soil particles and salts on stock-water developments such as streams, rivers, tanks, and dams (Holguín et al. 2006). Water quality is also closely related to cattle management. It is common that cattle go into ponds and dams when drinking, causing sediment movement and water contamination by cattle urine and manure (Sherer et al. 1988). Conversely, this rarely happens when using water troughs (Surber et al. 2003). In relation to external factors, water at cattle ranches can be affected by anthropogenic activities that potentially generate contaminants including urban wastes, minemetallurgic, and agriculture activities (Korenekova et al. 2002, Lukowski and Water 2011).
Despite the key role of water in livestock growth and reproduction, there is little information on water quality, not only for cattle ranches but also for any livestock enterprise. No research was found on water quality for cattle ranches under extensive conditions in north Mexico. This might be relevant since cattle ranches receive water runoff from urban sources and other potential contaminating sources like mining and agriculture. These anthropogenic activities represent potential contamination for animal water sources. However, it is unknown whether water runoff has an effect on water quality of groundwater, tanks, springs and rivers that flow through cattle ranches. The objective of this study was to evaluate drinking water quality for beef cattle in the cow-calf operation through calculation of a water quality index that relates water physical-chemical composition with common drinking water sources of cattle ranches in southern Chihuahua, Mexico.
MATERIALS AND METHODS
The study was carried out at 25 cattle ranches of the cow-calf system located in seven municipalities of Chihuahua, Mexico. Orography of the ranches varies from valleys to hills and low mountains. Climate of this region is dry temperate, with temperatures ranging from -12oC to 32oC, and mean annual precipitation of 450 mm. Vegetation varies from grasslands and shrub-lands in the valleys to woodlands in the mountains, including several tree and tree-like species such as pine (Pinus spp), Juniperus deppeana and oak (Quercus spp). Main vegetation types where cattle ranches are located include mesquite (Prosopis glandulosa) shrubland, creosotebush (Larrea tridentata) shrubland, oakbunchgrass, and shortgrass prairie (COTECOCA 1978). Anthropogenic activities representing potential for water contamination in cattle ranches take place in all studied municipalities. Mining activities are the most common in Hidalgo del Parral, Santa Barbara, and San Francisco del Oro municipalities, with gold, silver, lead, copper, zinc, fluorite, and barite mining. Also, irrigated agriculture in Allende, Coronado, and Matamoros, and forestry in San Francisco del Oro and Huejotitan municipalities are important economic activities (INEGI 2009 a, b).
In all cattle ranches, water sources for cattle were identified and samples were collected to determine their quality based on their physical and chemical variables, metals and metalloids. The water sources were groundwater, earthen tank and spring-river. A total of 43 water samples, 1.0 L each, were taken in plastic bottles. In each ranch, a sample of each available water source was taken. From the 43 samples, 28 came from groundwater and nine from earthen tanks (eight from non-fenced tanks where cattle got into the water, and one from a fenced earthen tank). The other six water samples came from permanent streams (four from springs and two from low flow rivers). Water samples from groundwater were taken at water troughs. The earthen tank water samples were taken from the water body´s edge. In the water springs and rivers, water samples were taken directly from the sites where cattle regularly drink water. None of the water springs or rivers were fenced, so cattle got into water for drinking, with possible contamination of water by soil erosion, runoff, and cattle urine and feces. Water samples were collected from march to april 2011, during the dry season. Proximity of ranches to potential contamination sources was also recorded. Two ranches were close (< 5 km) to wastewater sources, four close to mining wastes (< 5 km), one close to irrigated crops, two close to dry-land crops, and the rest were far (> 5 km) from potential contamination sources. After collection, water samples were placed in an ice-chest and transported to laboratory and kept refrigerated at 4oC until physical and chemical analysis. Water sampling and management were performed under Mexican regulations (SECOFI 1980).
Estimated parameters were potential of hydrogen (pH), electrical conductivity (EC), dissolved oxygen (DO), turbidity (TUR), total suspended solids (TSS), total dissolved solids (TDS), metals and metalloids (As, Cd, Co, Cr, Cu, Mg, Mn, Ni, Pb, Se, and Zn). Potential of hydrogen and EC were estimated with a Hanna Instruments® model HI-98130 multiparametric tester (SE 2011, SECOFI 2000). DO was estimated through SE (2001a). A 60 ml aliquot was placed in a covered recipient, and 5 drops of A reactive and five drops of B reactive were added; the recipient was closed, stirred and left to stand until sedimentation of the material, which took about 2 min. Then, 10 drops of reactive C were added to the recipient, covered and stirred again. When the sample turned to light yellow, DO concentration was measured in a Hanna Instruments® model HI-9146 oximeter. To estimate TUR, a Hanna Instruments® model H193703 turbidity meter (SE 2001b) was used. Solid contents (TS, TSS, and TDS) were estimated according to the Mexican regulation (SE 2015). Total solids were analyzed through dehydration (110o C for 24 h) of a 50 ml aliquot in a porcelain bowl, and weighted by difference at ambient temperature. Total dissolved solids were estimated according to the SE (2015) method, using a 50 ml aliquot passed through a vacuum pump with a filter in a Buchner funnel. Once the filtration process ended, filter paper was placed in a stove at 60oC for 24 h. After that, filter paper was dried at ambient temperature, and weighed. Total dissolved solids were calculated by weight difference between TS and TSS. Metal and metalloids were quantified using the SE (2001c) Mexican regulation. Digestion process was performed with a 100 ml aliquot and 5 ml of nitric acid until completion. Then, the digested aliquot was filtered and tri-distilled water added up to the original volume. Concentration of metals and metalloids was done with an ICP Optical Emission Spectrophotometer (Perkin Elmer® model 8300). Data were analyzed with Kruskall-Wallis non-parametric test, since data did not comply with normality assumption required for parametric tests (Bautista et al. 2009). Pb, Mn, Cu and Cd were excluded from this analysis, because of heteroscedasticity. The one-way Kruskall-Wallis test was performed (SAS 2008) with water source as source of variation.
Water quality index (WQI) was determined considering the parameters closely related to animal health and productivity, according to Alobaidy et al. (2010), and constructed in five steps:
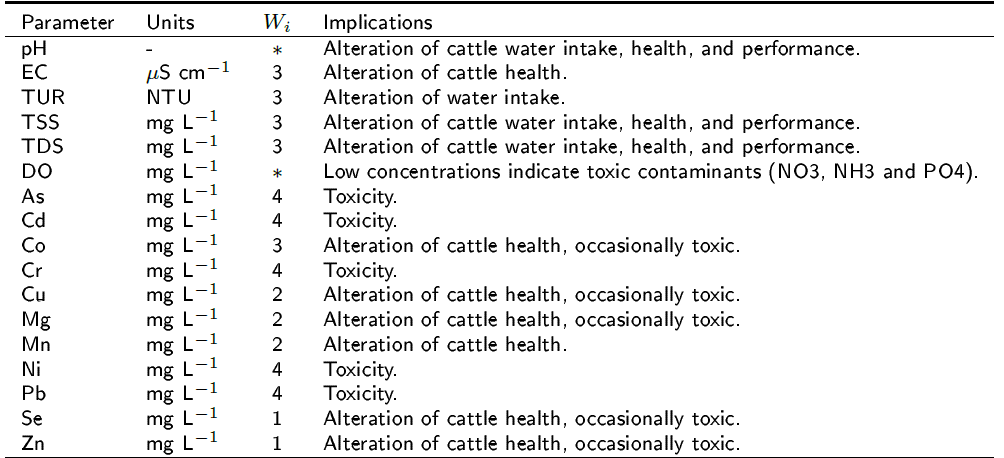
A specific weight (Wi) on a 1 to 4 scale was given to the selected parameters, based on their importance as water quality indicators for cattle. A value of one was given to less important parameters and four to more important parameters (Table 1). Values of Wi correspond to standard values reported from research articles and obtained from experts through panel sessions (Wright 2007, Olkowski 2009, Almeida et al. 2012, Gharibi et al. 2012, Curran 2014).
Table 1. Values of Wi and cattle health and performance implications of the parameters used to determine WQI in northern Mexico's cow-calf system.

* Not included in the WQI estimation.
Relative weight of each parameter was estimated through the following equation:
Where: Pi = Relative weight of each parameter, Wi= Specific weight of each parameter (1-4), n = Number of parameters (1-n).
Quality rating was calculated through the following equation:
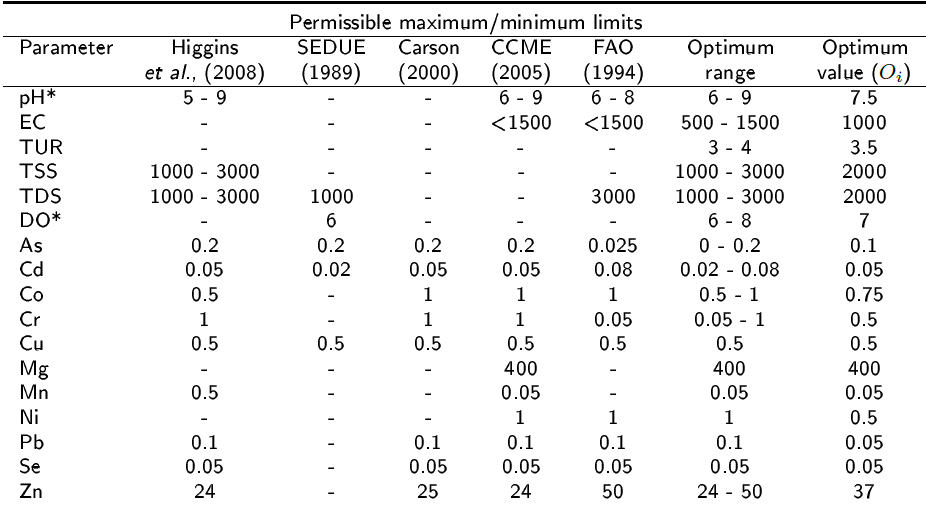
Where: qi= Quality Rating, Ci= Chemical concentration of each parameter, Oi= Optimum value for each parameter (Table 2).
Table 2. Permissible maximum/minimum limits, optimum range and optimum value (Oi) of the physical and chemical variables, heavy metals and metalloids for beef cattle drinking water according to different references.

* Not included in the WQI estimation.
Values of Oi were assigned based on several reports (Carson 2000, CCME 2005, SEDUE1989, FAO 1994, Higgins et al. 2008).
The water sub-quality index (Si) was obtained for each parameter:
The water quality index (WQI) was estimated through the summation of the Si for each parameter:
The WQI obtained for each water source was qualified based on the classification proposed by Sahu and Sikdar (2008). According to them, a WQI less than 50 corresponds to excellent quality water; a WQI from 50 to 100 to good water; a WQI from 100 to 200 to poor water; a WQI from 200 to 300 to very poor water and a WQI above 300 to water unsuitable for drinking.
RESULTS
Values for Wi assigned to the studied variables are shown at Table 1. Arsenic, Cd, Cr, Ni, and Pb received a value of 4 since they have a high impact on cattle health and productivity. Four variables (EC, TUR, TSS, TDS, and Co) were assigned a value of 3. Copper, Mg, and Mn received a value of 2, and finally, Se and Zn received a value of 1 because of their low importance as cattle water quality indicators.
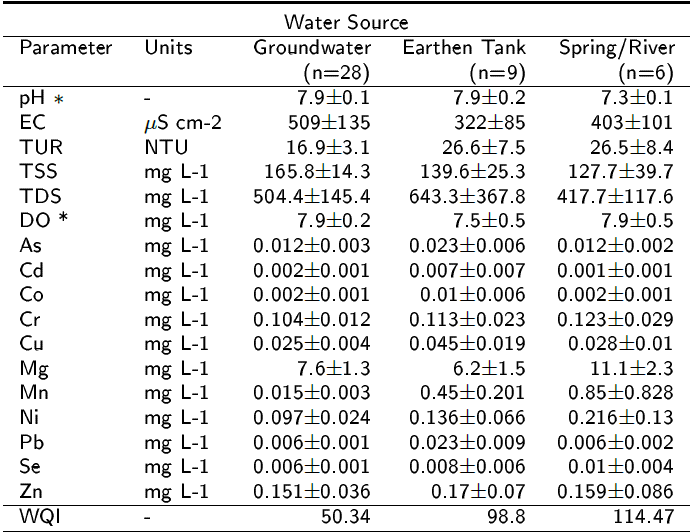
Table 3 shows physical and chemical composition of drinking water for cattle in the study area. The only parameters influenced by water source were pH, As (p < 0.05) and Co (p < 0.01). The rest of the means are only different in descriptive terms. Highest pH value corresponded to groundwater and earthen tank water with 7.9, and decreased to 7.3 in spring/river water. Values for As and Co showed that both parameters were higher in earthen tank than in groundwater and spring/river water sources. Mean values for EC were from 322 in earthen tank to 509 µS cm-2 in groundwater. Groundwater showed lower TUR with 16.9 NTU compared to the other water sources, and always was higher than the range and optimum limits for all water sources. However, in our study, TSS were similar and varied from 166 mg L-1 in groundwater to 128 mg L-1 in spring/river water. TDS values were 417.7, 504.4 and 643.3 mg L-1 for river/spring, groundwater and earthen tank, respectively, and were within range and optimum limits. Concentration of DO was similar among water sources, varying from 7.5 to 7.9 mg L-1. Metal and metalloid concentration fell within optimum range, except Mn for earthen tank and spring/river waters (0.45 and 0.85 mg L-1, respectively) that exceeded range and optimum values.
Table 3. Water physical and chemical parameters (mean ± SE) and WQI values in northern Mexico's cattle cow-calf operation according to water source.

* Not included in the WQI estimation.
As shown in Table 3, groundwater showed best quality with a 50.34 WQI, corresponding to good class. Earthen tank water also corresponded to good class with a 98.8 WQI, while spring/river water was classified as poor water for cattle with a 114.47 WQI. Those parameters that surpassed optimum level for cattle drinking were TUR for all water sources and Mn for earthen tank and spring/river waters. None of high importance (Wi=4) parameters had higher concentrations than optimum.
DISCUSSION
Methodology used for WQI estimation is designed for those parameters whose beneficial effect on water quality is inversely related to their concentration (Alobaidy et al. 2010). Therefore, in the calculation of WQI, DO was not included because this parameter follows a direct relationship to water quality. Similarly, pH was not included since this variable affects water quality under both low and high values. In terms of permissible limits, pH values in the three water sources were within the optimum range (6-9) and only spring/river water was slightly below optimum value of 7.5 (Table 2). Values for pH in our study are similar to those of Brew et al. (2011) who mentioned that water pH varies with water source within the same ranch, from 7.0 in groundwater to 7.4 in earthen tank water. The EC values obtained in our study are similar to those found by Banoeng-Yakubo et al. (2009) and fall within range and optimum value specifications. According to Mukhtar et al. (2009), EC is an indicator of dissolved salts in water and is a common problem in arid regions. Probably, these low EC values may be explained by the fact that most of the ranches (15/25) are not confined to arid regions. Main toxic effects of EC include abdominal pain, nasal and nervous disorders (Curran 2014).
TUR is an indicator of water cleanness and may be correlated to TSS, depending on the kind of water source (Almeida et al. 2012). In groundwater, an important factor for TUR increasing is algae presence (Rasby and Waltz 2011), although wind may generate dust, increasing TUR and TSS. TSS values were higher than those reported in other studies (Surber et al. 2003) but did not exceed the range and optimum values for cattle drinking water. Sherer et al. (1988) mentioned that water TSS concentration increases when cattle get into water to drink. TSS generate from runoff during intense rain in soils with low plant cover (Havstad et al. 2007, Quiñones-Vera et al. 2009, Hone-Jay et al. 2013). TDS values were similar among water sources. TDS concentration varies naturally with salt runoff from soil that goes into surface water. In the case of groundwater, TDS is directly affected by hydrogeochemical properties of the aquifers (Thivya et al. 2014, Mosley 2015). Domestic waste water discharge and cattle mismanagement contribute to the increase of TDS in surface water (Surber et al. 2003, Rajankar et al. 2011). Although Mn showed a higher than optimum concentration in earthen tanks and spring/river sources, cattle intoxication by this metal in water is rare. High intake of Mn causes anemia and digestive disorders (Olkowski 2009). Sources of Mn in water are natural soil-borne, cattle feed, and waste water from urban centers (Sommers 1977, Blanco-Penedo et al. 2009).
Results of WQI obtained in this study are similar to other studies where the same methodology was used (Banoeng-Yakubo et al. 2009, Alobaidy et al. 2010, Gharibi et al. 2012, Thivya et al. 2014). These authors reported that the most influencing parameters in the WQI were heavy metals and TDS concentration. Differences in water sources observed in this study concur with other investigations. In a study made in Oregon, Miner et al. (1992) determined that cattle prefer groundwater offered in a water trough rather than spring/river or earthen tank water. Similarly, yearling steers drinking groundwater gained 23 % more weight than those drinking earthen tank water in Alberta, Canada, due to a higher TSS concentration in earthen tank water (Surber et al. 2003).
CONCLUSIONS
Cattle drinking water in the cow-calf system in southern Chihuahua, Mexico is good for groundwater and earthen tank, and poor for spring/rivers. Water quality parameters that negatively influenced WQI were turbidity and Manganese concentration. To obtain reliable data about the effects of water on animal health, it would be necessary to include other diagnostic variables, in addition to the water quality indicators used in this study.


 nueva página del texto (beta)


