Appendix B
Evaluation of Olympic Games forecasts
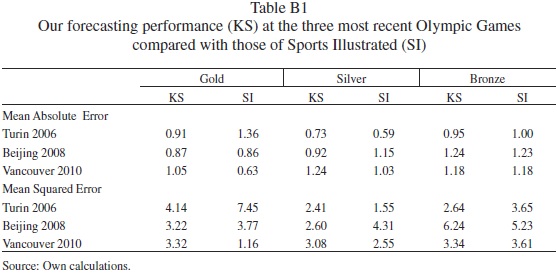
Table B1 summarizes our forecasting performance for the Olympic Winter Games of Turin in 2006 and Vancouver 2010, and the Olympic Summer Games of Beijing in 2008. The table reports two measures of forecast performance. The mean absolute error indicates that, on average for all countries in the samples, our predictions are off by about one gold medal, one silver medal, and one bronze medal. The mean squared error penalizes big deviations from the realizations more severely, but is not easy to interpret. We also compare our forecasting performance with those of Sports Illustrated (SI). This US based sports journal publishes forecasts for each event and for each individual medal. From these predictions, we compile the medal tally. There are differences with our method. SI bases its predictions on their huge expertise of sports and athletes. Moreover, they publish the forecast very close to the start of the Games, so they are able to include the most recent information about the athletes who are competing and about their current form. Our predictions are based on statistical techniques, and are made a couple of months before the start of the Games. Despite these differences, we sometimes outperform SI, as illustrated in Table B1.