Annex
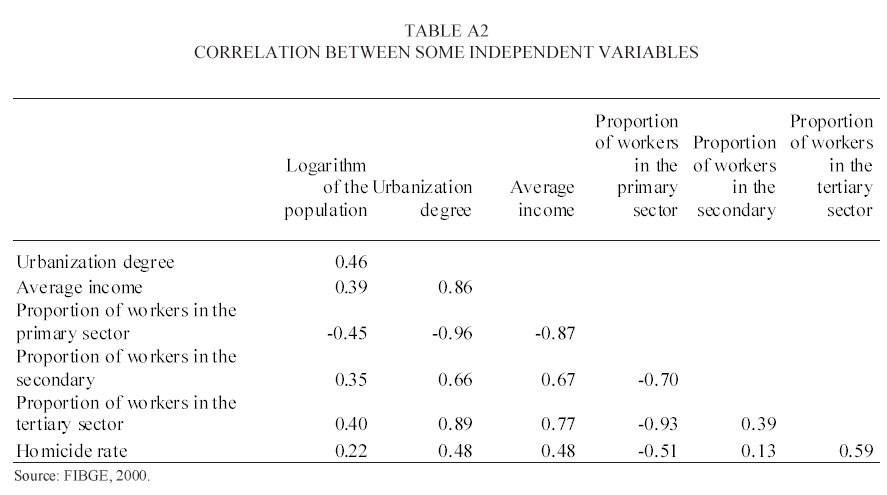
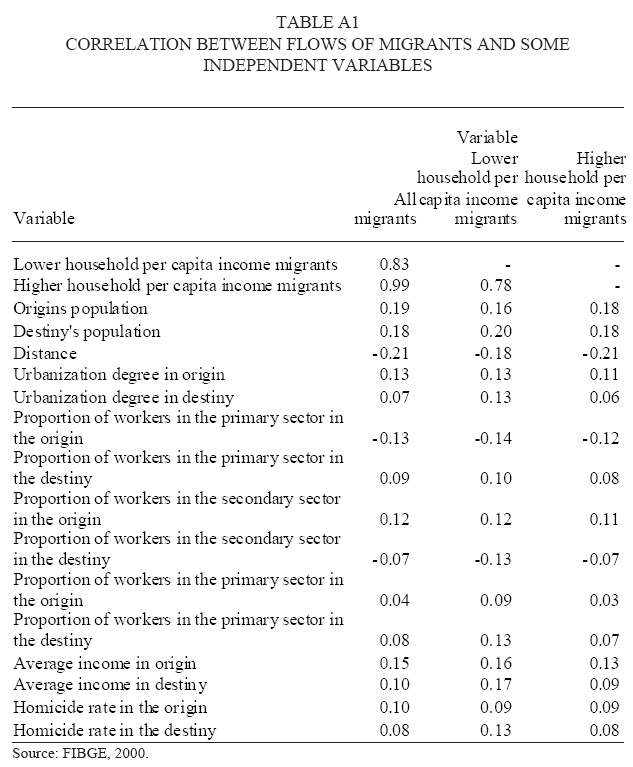
We show here two tables with coefficients of correlation between variables. Table A1 shows the correlation between the magnitude of flows of migrants and other variables. The magnitudes of the flows are highly correlated between themselves, with coefficients between 0.78 and 0.99. The correlations between the magnitude of the flows and the other variables were weaker but all of them were statistically significant. Table A2 shows the correlations between some independent variables. Given some of the socioeconomic aspects in Brazil, all of them show the expected sigh.