


 nueva página del texto (beta)
 Inglés (pdf)
 Artículo en XML
 Referencias del artículo
 Enviar artículo por email
 Citado por SciELO
  Similares en
SciELO
Similares en
SciELO 
 Permalink
1. Introduction
Land surface conditions in the North American Monsoon (NAM) region undergo dramatic changes each summer in response to the rainy season (e.g., Tang et al., 2012; Vivoni, 2012; Xiang et al., 2014). As a result, prior studies have explored whether the NAM region in the southwestern U.S. and northwest Mexico exhibits a feedback mechanism between the land surface states and the atmospheric conditions leading to precipitation generation. For instance, a positive soil moisture-precipitation feedback has been identified using regional climate models (e.g., Small, 2001; Xu et al., 2004; Vivoni et al., 2009). Using a global model, Feng et al. (2013) found that a positive soil moisture-precipitation feedback was limited to the northern (more arid) sections of the NAM region, while a negative feedback was apparent in more southerly (tropical) areas. While discrepancies in the direction of the feedback mechanism might be due to variations in approach, prior studies suggest that the mechanisms underlying the soil moisture-precipitation feedback in the NAM region are not well understood, in particular at the scale of storm events.
Less attention has been placed on quantifying the vegetation-precipitation feedback, though theoretical (Eltahir, 1998) and observational (Méndez-Barroso and Vivoni, 2010) studies suggest that seasonal changes in vegetation albedo and transpiration might play an important role. The NAM region is characterized by a strong seasonality in vegetation greenness and biomass that is closely linked to interannual changes in precipitation (Forzieri et al., 2011, 2014). The seasonal progression of vegetation greening has been quantified using a number of different remote sensing platforms and incorporated into modeling studies (e.g., Matsui et al., 2005; Watts et al., 2007; Castro et al., 2009; Vivoni, 2012; Tang et al., 2012; Méndez-Barroso et al., 2014). However, the intraseasonal variations of vegetation greenness and their link to available soil moisture have not been studied extensively, despite their importance for setting the land surface conditions prior to the occurrence of individual storm events. As a result, the storm-scale impacts of soil moisture and vegetation anomalies on precipitation generation have not been quantified.
While our focus in this work is on the NAM region, feedback processes between land surface states and convective precipitation are important across a wide range of different climate settings (Rodríguez-Iturbe et al., 1991; Eltahir, 1998; Findell and Eltahir, 1997; Pal and Eltahir, 2001; Siqueria et al., 2008; Vivoni et al., 2009; Alfieri et al., 2008; Jones and Brunsell, 2009; Matyas and Carleton, 2009; Comarazamy et al., 2010; Zaitchik et al., 2013; Tuttle and Salvucci, 2016). Water-limited ecosystems in arid and semiarid areas typically yield positive feedback between increased land surface wetness and precipitation. Under these conditions, Eltahir (1998) proposed that an increase in soil moisture or vegetation results in decreases in albedo and an increase in latent heat flux which both yield higher net radiation at the land surface and higher atmospheric humidity. In a more energetic and moister lower atmosphere, convection and condensation are promoted, leading to subsequent precipitation in the positive feedback loop. Recently, Tuttle and Salvucci (2016) used observational data to identify a positive soil moisture-precipitation feedback in the semiarid and arid regions of the western U.S., confirming that water limitations are the primary control on the feedback processes, as opposed to energy constraints.
Given that its rainy season occurs during the summer (i.e., an in-phase relation between radiation and precipitation), the NAM region is an excellent area to diagnose the occurrence and magnitude of positive feedbacks between soil moisture and vegetation on precipitation processes. First, the high radiation setting leads to low energy limits to evapotranspiration, except during days with morning cloudiness (Méndez-Barroso and Vivoni, 2010). Second, vegetation is sensitive to the onset, magnitude and intraseasonal changes in precipitation (Forzieri et al., 2014). Finally, disentangling the independent feedback effects of soil moisture and vegetation greenness on precipitation using observations is difficult given their high correlation (Méndez-Barroso et al., 2009, 2014). Thus, building on prior observational efforts and land surface modeling studies (e.g., Vivoni et al., 2007, 2008, 2010; Xiang et al., 2014, 2017), we conduct fully-coupled land-atmosphere simulations using the WRF-Hydro modeling system (Gochis et al., 2014) to represent the independent effects of initial soil moisture and vegetation conditions on precipitation without consideration of the potential synergies between these initial states. This is achieved by first carrying out a set of WRF-Hydro ‘baseline’ simulations in two summers (July-August of 2004 and 2013) selected based on synoptic conditions and data availability in a large watershed in northwest México. The baseline simulations are compared to both reanalysis products and the offline (uncoupled) WRF-Hydro simulations of Xiang et al. (2017). Subsequently, sets of short-term (72 h) experiments are conducted using different initial soil moisture and vegetation conditions for four selected storm periods to diagnose the occurrence and magnitude of the feedback processes. Our analyses are limited to the assessment of spatially averaged conditions in the large watershed for the purpose of identifying general trends in the feedback pathways across all storm periods. A particular focus is placed on identifying the differences in the feedback pathways of soil moisture and vegetation anomalies in generating precipitation in the NAM region for a set of representative storm periods.
2. Methods
2.1. Study region
The study of NAM has drawn binational attention since the climate system provides essential water resources for the U.S.-Mexico border region. For instance, the NAM Experiment (NAME) 2004 field campaign was aimed at collecting coordinated land surface and atmospheric data to improve the predictability of warm season precipitation over North America (Higgins et al., 2006). Here, we conduct modeling experiments over the Río Sonora basin (RSB) in Sonora, Mexico (Fig. 1) where prior research activities related to NAME have increased the available observations useful for model testing (e.g., Vivoni et al., 2007; Méndez-Barroso et al., 2009, 2014). The RSB is a north-south oriented watershed (21 264 km2) with mean annual precipitation ranging from 350 to 700 mm (Hallack-Alegria and Watkins, 2007) of which 40 to 70% falls during the NAM from July to September (Vivoni et al., 2008). The mountainous terrain within the RSB exhibits a relief of more than 2000 m, leading to spatial heterogeneities in soil texture and vegetation distributions in the basin (e.g., Robles-Morua et al., 2015; Xiang et al., 2017). Prior land surface modeling studies have built a solid foundation on the simulation of hydrologic and ecosystems processes in the RSB (e.g., Vivoni et al., 2010; Robles-Morua et al., 2012; Xiang et al., 2014; Mascaro et al., 2015) allowing for the detailed coupled land-atmosphere modeling experiments conducted in this work.

2.2. Model description
The Weather Research and Forecasting (WRF) modeling system (ARW version 3.8) is a nonhydrostatic, terrain-following, eta-coordinate mesoscale model used widely for operational weather and climate forecasting in the NAM region (e.g., Vivoni et al., 2009; Mearns et al., 2012; Sharma and Huang, 2012; Castro et al., 2012; Tripathi and Dominguez, 2013). Multiple modeling options exist in WRF for atmospheric physics and dynamics, including turbulence, radiation, planetary boundary layer, cumulus, and microphysics parameterizations, with Table I indicating the selected schemes in this study. The atmosphere is simulated using 44 vertical layers with the top level set to 100 hPa. As a recent development, WRF-Hydro integrates multiple land surface representations within WRF to improve its ability to represent distributed hydrologic processes, including overland flow routing, subsurface transport, river routing and the impacts of reservoirs (Gochis et al., 2014; Yucel et al., 2015; Senatore et al., 2015; Xiang et al., 2017). Here, the Noah with multi-parameterization (Noah-MP, Niu et al., 2011) land surface scheme is adopted to simulate water and energy fluxes in each two-way nested domain (Fig. 1, Table II) of 12, 4 and 1 km cell resolution, with the domains determined in a manner consistent with NAME modeling efforts (e.g., Gutzler et al., 2009). The innermost domain (Domain 3) was selected to cover the RSB and uses an explicit convection scheme, as opposed to the Kain-Fristch cumulus parameterization used in Domains 1 and 2. For each time step of Domain 3, land surface model states and fluxes (e.g., soil moisture content for each soil layer, lateral runoff) are exchanged between Noah-MP (1 km resolution) and a disaggregated overland and river routing scheme (100 m resolution). Additional details on the setup of the coupled land surface and routing schemes in WRF-Hydro are provided by Gochis et al. (2014) and Xiang et al. (2017).


2.3. Baseline simulation setup
For the baseline simulations, lateral atmospheric boundary conditions for the outer domain (Domain 1) were obtained from the North American Regional Reanalysis (NARR, Mesinger et al., 2006) dataset at three-hourly, 32 km resolution for the period of June 30 to August 31 in the years 2004 and 2013. These summers consisted of relatively similar total basin-averaged precipitation (Table III) as obtained from precipitation products in NARR and the North American Land Data Assimilation System (NLDAS, Mitchell et al., 2004). In turn, Xiang et al. (2017) identified a similar amount of vegetation greening in each summer as compared to the interannual variability exhibited from 2004-2014. For the baseline simulations, daily variations in vegetation fraction (VF) and leaf area index (LAI) were derived from the Moderate Resolution Imaging Spectroradiometer (MODIS) sensor and ingested into WRF-Hydro as time-varying fields following the procedure detailed in Xiang et al. (2017) for the offline runs. Within the inner domain (Domain 3), soil moisture fields were initialized for June 30 of each year in the baseline simulations by using outputs from the offline WRF-Hydro runs driven by NLDAS meteorological forcings from May 1 to September 30 in 2004 and 2013. Given the validation activities of the offline runs (Xiang et al., 2017), this strategy substantially improved the soil moisture initialization of the baseline simulations as compared to using NARR soil moisture fields that have been found to be biased toward wet values in the region (Vivoni et al., 2008).

2.4. Storm-scale simulation setup and initialization experiments
Storm-scale experiments were conducted with a setup similar to the baseline simulations during four selected storm periods in 2004 (July 12-15 and July 23-24) and 2013 (July 15-18 and August 2-5). Simulations were initialized at 00 UTC and run for 72 h with analyses between hours 7 (00 AM local time) and 54 (i.e., analysis duration of 48 h). Table III compares the total precipitation over the RSB for each storm period from NARR and NLDAS reanalysis products. Prior studies have described the conditions leading to the formation of precipitation in the study region for each period. To assist in understanding the underlying meteorological conditions, Figure 2 presents the 500 mb surface plots at 1200 UTC on the first day of the four selected events from the U.S. National Weather Service (NWS, http://www.spc.noaa.gov/obswx/maps/). The July 12-15 and July 23-24 periods in 2004 consisted of mesoscale convective complexes, which are a common storm type during the NAM (Nesbitt et al., 2008) associated in these periods with upper level inverted troughs (Gochis et al., 2007; Finch and Johnson, 2010). In contrast, the July 15-18 and August 2-5 periods were caused by upper level low and high-pressure systems, respectively, leading to widespread convective storms (Moker et al., 2014). During the summer of 2013, a transect experiment was conducted with detail synoptic conditions documented throughout the monsoon season (Serra et al., 2016; http://monsoonwx2013.wordpress.com). In these well-documented daily conditions, it is worthwhile to note that, on July 15, 2013, the upper level low-pressure system originated near northern Texas and later moved into Sonora, persisting until the end of the July 15-18, 2013 event. During the August 2-5, 2013 event, strong southerly upper level winds to the west of Texas resulted in a shear environment and led to the organization of convective storms over Sonora. Figure 3 presents the time series of precipitation averaged over the RSB from the NLDAS product during the baseline simulations and identifies the four storm periods resulting from these synoptic conditions. From this, it is clear that the selected periods have relatively common precipitation occurrences in each summer season, with total accumulations of 22 to 31 mm (Table III). Furthermore, these occur at different times during the NAM progression (Vivoni, 2012), such that the earlier events experience lower initial soil moisture and vegetation conditions and the later events are progressively wetter and greener. Thus, the similar storm amounts and the variations in the initial conditions among the storm-scale simulations provide a suitable testbed to explore the soil moisture and vegetation feedback processes with precipitation, though the sample size of storms analyzed here is small.


Fig. 3 Basin-averaged NLDAS precipitation (mm h-1) in (a) 2004 and (b) 2013 during the baseline simulations with shaded periods representing the storm-scale simulations.
Four initialization experiments were conducted for each storm period by perturbing the initial soil moisture and vegetation conditions. All other land surface and atmospheric conditions are obtained from the baseline simulations. Table IV presents the spatial mean and ±1 standard deviation of the initial soil moisture (θ s ) and vegetation parameters (VF and LAI) for each case. In experiments 1 and 2, surface soil moisture is modified to a spatially-uniform wet condition of 0.2 m3 m-3, which is close to the basin-averaged field capacity (Exp. 1 or uniform soil moisture, USM) and to spatially-variable soil moisture (Exp. 2 or spatially-variable soil moisture, SSM) obtained through an offline simulation where a 50 mm uniform precipitation event is redistributed by the WRF-Hydro model for 24 hours. As an example, Figure 4 illustrates the initial soil moisture condition of the July 12-15, 2004 event, specified in the baseline simulation and for experiments 1 and 2. Note that for the August 2-5, 2013 period, a higher uniform soil moisture of 0.3 m3 m-3 was used in experiment 1 since the baseline simulation was already close to the soil field capacity due to the late seasonal timing of the event, and as a result, experiment 2 was selected to represent a slightly drier condition. In experiments 3 and 4, the vegetation parameters are modified to a spatially-uniform value of high greenness (VF of 60% and LAI of 2.1 to match maximum values in the RSB from 2004 to 2014) in Exp. 3 (uniform vegetation, UVEG) and to spatially-variable parameters obtained by uniform additions to the original data preserve the same mean state as Exp. 3 but allow for spatial variations (Exp. 4 or spatially-variable vegetation, SVEG). The experimental setup results in a total of 16 simulations of 72 h duration (four initial conditions for four storm events) that allow examining the independent impact of uniform and spatially-variable soil moisture and vegetation anomalies on storm-scale feedback processes.
Table IV Initial soil moisture and vegetation conditions for storm-scale simulations shown as spatial mean and ±1 standard deviation (std) in the RSB.


Fig. 4 Initial soil moisture (m3 m-3) distributions at 00 UTC July 12, 2004 for the baseline simulation and for experiments 1 (USM) and 2 (SSM).
A process-based analysis following the theoretical relationships of Eltahir (1998) is conducted to explore the effects of initial soil moisture and vegetation on precipitation. This consists of analyzing: (1) the impact of soil moisture and vegetation on land surface states and the surface energy balance, (2) the relationship between net radiation at the surface and boundary layer conditions, and (3) the linkage among boundary layer states and precipitation generation through linear regression parameters (and coefficients of determination, R2) and correlation coefficients (CC). More specifically, land surface processes are examined through the basin-averaged surface soil moisture (θ s ), surface albedo (a), surface temperature (T s ), evaporative fraction (EF) and net radiation (R n ), while atmospheric conditions are inspected using the basin-averaged planetary boundary layer depth (PBLH), wet bulb temperature (T wb ), lifting condensation level (LCL) and convective available potential energy (CAPE). In all cases, linear relations are assessed between differences (Δ) in the variables from the initialization experiment (i.e., Exp. 1, 2, 3 and 4) and the baseline simulations (i.e., Δ = Exp. minus baseline). For each storm period and experiment (16 simulations), the variables of interest are obtained as basin averages (from 1 km resolution) that are time-averaged during the 48 hours of analysis (for θ s , a, R n and T wb ) or averaged from two mid-day values (for EF, Ts, PBLH, CAPE and LCL).
3. Results and discussion
3.1. Evaluation and characterization of baseline simulations
The baseline WRF-Hydro simulations are first evaluated by comparing model outputs with precipitation derived from NLDAS which has been bias-corrected over the RSB with a local rain gauge network (Xiang et al., 2017). Figure 5 shows that the spatial distribution of total precipitation during the summer season (July-August) produced by the coupled WRF-Hydro simulation has a higher spatial detail than the bias-corrected NLDAS product, due to differences in resolution. The general pattern of decreasing precipitation from south to north is captured well in the simulations, though it is clear that there is a mismatch in the spatial location of the highest rainfall accumulations for both summer periods. This is partly due to the bias-correction of the NLDAS product, which can substantially increase rainfall amounts within the RSB to respect the ground-based observations, in particular for northern areas of the watershed. The coupled WRF-Hydro performance is further evaluated in Figure 6 and Table III with respect to the basin-averaged precipitation (P) products from NARR and bias-corrected NLDAS. The baseline simulations capture reasonably well the onset of the monsoon precipitation and the seasonal timing of storm events in the RSB for each year as compared to NLDAS (Fig. 3). For the storm periods, WRF-Hydro precipitation amounts are within the range of values reported in the reanalysis products (Table III) and consistent with prior studies reproducing organized convection in mountain areas of the NAM region (e.g., Carbone et al., 2002; Vivoni et al., 2009; Castro et al., 2012).

Fig. 5 Comparison of cumulative precipitation (mm) from June 30 to August 31 derived from WRF-Hydro simulation, and NLDAS dataset with bias correction. Comparison is presented for 2004 (left) and 2013 (right).

Fig. 6 Basin-averaged precipitation (mm h-1) from the WRF-Hydro simulations in 2004 and 2013 (a, f), and comparison of baseline simulations to basin-averaged NLDAS cumulative P (b, g) and offline (uncoupled) WRF-Hydro simulations in terms of basin-averaged ET (c, h), θ s (d, i, with ±1 std as envelops) and T s (e, j) for 2004 and 2013. Storm periods are shaded.
Discrepancies, however, are noted in terms of how precipitation amounts are delivered to the land surface from the rainfall hyetograph (Fig. 3 and Fig. 6a, f) and cumulative rainfall (Fig. b, g). Comparisons of basin-averaged daily precipitation between the baseline simulations and the original NLDAS products leads to correlation coefficient of 0.32 and 0.17, root mean square error of 6.37 and 6.31 mm day-1 and bias of 0.13 and 0.06 mm day-1 for the 2004 and 2013 summer season. As compared to the bias-corrected NLDAS product, a degraded simulation performance was noted (correlation coefficient of 0.2 and 0.13, root mean squared error of 7.02 and 6.49 mm day-1 and bias of -0.45 and -1.13 for 2004 and 2013, respectively). This suggests that the baseline simulations have moderate quantitative skill in reproducing the basin-averaged rainfall conditions as estimated by NLDAS, with better performance when bias-correction is not applied, an indication that performance deteriorates when accounting for ground-based data. As interior grid nudging is not adopted in the model setup, large-scale synoptic patterns from the NARR data might be degraded and lead to the mismatch in rainfall. In addition, the scale discrepancy among ground-based observations and grid-based simulations also plays a role. For both seasons, the bias-corrected NLDAS product is characterized by more frequent, smaller storm magnitudes, when averaged over the RSB, while the coupled WRF-Hydro simulations produce a few large precipitation events (e.g., August 5, 2004 storm of 50 mm). While this difference is important for the land surface response, we note that storm magnitudes and timings are sufficiently similar in the bias-corrected NLDAS product and the baseline simulations for the analysis discussed below.
Figure 6 also shows comparisons of basin-averaged evapotranspiration (ET), surface soil moisture (θ s ) and surface temperature (T s ) from the baseline (coupled) and offline (uncoupled) WRF-Hydro simulations, with the latter driven by the bias-corrected NLDAS meteorological forcing, while the former is dependent on the lateral boundary conditions from NARR. This distinction is important since the drier conditions in NARR (Table III) propagate from the lateral forcing to the atmospheric conditions in the baseline simulations. As a result, basin-averaged ET and θ s in the uncoupled simulations are notably larger than in the coupled runs for both seasons, except in response to the large precipitation events generated by WRF-Hydro. As expected, the four storm periods led to similar increases in ET and θ s , as well as reductions in T s , right after the precipitation occurrence with land surface effects that can last for several days. A smaller diurnal range of basin-averaged T s in the coupled simulations is attributed to the more realistic pattern of atmospheric conditions at 1 km resolution over complex terrain as compared to the coarser (12 km) NLDAS meteorological fields (Robles-Morua et al., 2015; Mascaro et al., 2015).
3.2. Land surface states and energy balance in initialization experiments
Soil moisture and vegetation feedback mechanisms are linked to the effects of antecedent precipitation on land surface conditions. Figure 7 diagnoses the land phase of the positive feedback processes proposed by Eltahir (1998) by inspecting relations of surface soil moisture with albedo (Fig. 7a) and evaporative fraction (Fig. 7b) as well as the link between evaporative fraction and surface temperature (Fig. 7c. In all cases, results from the four initialization experiments (Exp. 1, 2, 3 and 4) and four storm periods in 2004 and 2013 (16 symbols in total) are depicted as basin-averaged differences (Δ) from the baseline simulation. Linear regression equations (with R2) and correlation coefficients are listed in Table V for the soil moisture (USM and SSM, eight symbols) and vegetation (UVEG and SVEG, eight symbols) experiments, with bolded CC representing statistically significant results. In general, stronger linear relations and higher correlations are obtained for Exp. 1 and 2 as compared to Exp. 3 and 4, indicating that soil moisture anomalies have a more significant impact on the land phase of the feedback processes.

Fig. 7 Relations among differences in land surface states and fluxes (Δ = Exp. minus baseline). (a) Δ θ s vs. Δa. (b) Δ θ s vs. ΔEF. (c) ΔEF vs. ΔT s . Regression lines are shown with associated equations and R2 (Table V).
Table V. Linear regression equations, coefficients of determination (R2) and correlation coefficients (CC) between selected variables for soil moisture (Exp. 1 and 2) and vegetation (Exp. 3 and 4) initialization experiments, with bolded CC representing statistically significant results.

Surface albedo is slightly lowered (-Δa) with the imposed increases in soil moisture (+Δ θ s ) and vegetation greenness (+ΔVF), with a larger effect noted for Exp. 3 and 4 (i.e., > 0.01 decreases in a). Mid-day EF, an indicator of the amount of latent heat flux relative to the available energy, increases (+ΔEF) substantially with higher soil moisture (+Δ θ s ), but is less sensitive to changes in vegetation (+ΔVF), with some cases exhibiting -ΔEF. This latter effect is likely due to the impact of vegetation cover on lowering soil evaporation through radiation sheltering (Xiang et al., 2017). Correspondingly, changes in mid-day EF also affect ΔT s , with both +Δ θ s and +ΔVF typically yielding -ΔT s such that the land surface is cooled either by evapotranspiration (Exp. 1 and 2) or vegetation radiation sheltering (Exp. 3 and 4). Though achieved through different pathways, positive anomalies in soil moisture and vegetation greenness both lead to decreases in albedo and surface temperature. According to the positive feedback mechanism proposed by Eltahir (1998), these changes (-Δa and -ΔT s ) should increase the net radiation at the land surface (+ΔR n ). Table V confirms that negative slopes and CCs are found between Δa and ΔRn and between ΔT s and ΔR n for the soil moisture and vegetation feedback pathways, though R2 are low and statistically insignificant for the initial vegetation cases (Exp. 3 and 4). Underlying these relations are the impact of -Δa on increasing the net solar (shortwave) radiation or (1 - a)R s , where R s is the incoming solar radiation, as well as the effect of -ΔT s on increasing the net terrestrial (longwave) radiation due to a lower outgoing component or -Δ(σɛ s T s 4 ), where ɛs is the land surface emissivity and σ is the Stefan-Boltzmann constant. Combining the impact of -Δa and -ΔTs in the experiments increases +ΔR n by up to 17.7 W m-2, consistent with the values of 10-12 W m-2 cited by Eltahir (1998) for increasing soil moisture. As a result, the available energy at the surface is enhanced by positive soil moisture (+Δ θ s ) and vegetation (+ΔVF) anomalies, with a stronger effect for cases with higher soil moisture (USM and SSM) as compared to greener conditions (UVEG and SVEG). When a reduced initial soil moisture was imposed (-Δ θ s in Exp. 2 for August 2-5, 2013), linear relations between land surface and energy states were confirmed.
3.3. Planetary boundary layer dynamics in initialization experiments
The dynamics of the planetary boundary layer (PBL) are influenced by its contact with the land surface, with a larger net radiation (+ΔR n ) or available energy at the land surface linked to more energetic boundary layer conditions (Eltahir, 1998). In addition, the partitioning of R s into latent heat flux, or a higher evaporative fraction (+ΔEF), favors a lower PBL height (-ΔPBLH) that increases the available moist static energy in the lower atmosphere. Figure 8 diagnoses the atmospheric phase of the positive feedback mechanisms by inspecting relations of EF and PBLH (Fig. 8a) and PBLH and the wet bulb temperature (T wb ) often used to quantify the PBL energetic state (Fig. 8b, Williams and Renno, 1993). Linear regression equations (with R2) and correlation coefficients are listed in Table V. Results for the initial soil moisture cases (Exp. 1 and 2) cases show that +ΔEF leads to -ΔPBLH, whereas the vegetation greening experiments (Exp. 3 and 4) indicate the complementary trend of -ΔEF leading to +ΔPBLH, with high CCs and R2 values for all cases. This implies that higher soil water (+Δ θ s ) reduces the boundary layer height (-ΔPBLH) through its impact on surface energy partitioning (+ΔEF), while higher vegetation cover (+ΔVF) in some cases reduces the evaporative fraction (-ΔEF) via its impact on radiation sheltering and thus increases the boundary layer height (+ΔPBLH). This distinction among the soil moisture and vegetation feedback pathways is noteworthy. Mid-day PBLH impacts Twb, with soil moisture anomalies leading to +ΔT wb due to a shallower PBLH, while vegetation increases result in -ΔT wb due to a deeper PBLH, though the overall relations across all storm events are considered weak. As a result, increased soil moisture reduces PBLH and increase T wb , with the opposite weaker effects observed for higher vegetation greenness.
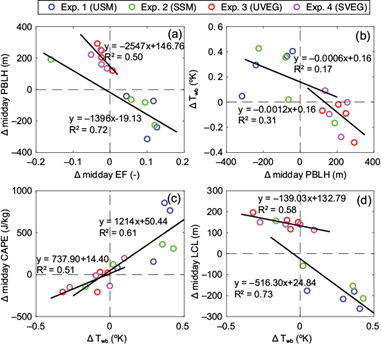
Fig. 8 Relations among differences in land surface fluxes and atmospheric conditions (Δ = Exp. minus baseline). (a) ΔEF vs. ΔPBLH. (b) ΔPBLH vs. ΔT wb . (c) ΔT wb vs. ΔCAPE. (d) ΔT wb vs. ΔLCL. Regression lines are shown with associated equations and R2 (Table V).
3.4. Convection and precipitation generation in initialization experiments
The energetic conditions in the boundary layer impact the generation of convective precipitation (Eltahir and Pal, 1996; Eltahir, 1998), with a larger wet bulb temperature (+ΔT wb ) leading to a higher convective available potential energy (+ΔCAPE) and a lower lifting condensation level (-ΔLCL). As shown in Figure 8 and Table V, these relations are statistically confirmed for the initialization experiments with 95% confidence interval. Note, however, that Exp. 1 and 2 (USM and SSM) result in +ΔT wb leading to +ΔCAPE and -ΔLCL, whereas Exp. 3 and 4 (UVEG and SVEG) indicate the complementary trend of -ΔT wb leading to -ΔCAPE and +ΔLCL, with high CCs and R2 values for all cases. The noted differences in CAPE between the soil moisture and vegetation initialization experiments are shown in Figure 9 as spatial maps of mid-day ΔCAPE (Exp. minus baseline) averaged over all storm periods. Wet initial soil moisture conditions (USM and SSM) increase CAPE throughout the RSB, with a stronger impact for the case of spatially-uniform wetness near the field capacity (Exp. 1 or USM). Initial vegetation states set at maximum values, on the other hand, have a mixed spatial impact on CAPE, with positive values in the north and central portions of the RSB and negative values in the southern areas, with the overall effect of reducing the basin average of mid-day CAPE. It is interesting that the spatial variability of θ s (USM vs. SSM) appears to have a stronger role in inducing spatial variations in CAPE than the spatial variability of VF and LAI (UVEG vs. SVEG), indicating a stronger spatial dependence of the soil moisture-precipitation feedback.

Fig. 9 Spatial maps of differences of mid-day CAPE (J kg-1) obtained as Exp. minus baseline and averaged over the four storm periods for each experiment.
Precipitation (P) amounts during each storm period are linked to the initial conditions most directly through the lifting condensation level (LCL), which is decreased in a more energetic boundary layer. In addition, the LCL deficit (defined as LCL - PBLH) has also been used as a metric for inspecting precipitation generation (Findell and Eltahir, 2003). As noted in Table V, soil moisture anomalies in Exp. 1 and 2 show that -ΔLCL and -ΔLCL deficit are both linked to +ΔP, indicating that a lower LCL or PBLH approaching the LCL lead to an increase in precipitation magnitude across the four storm periods, though the R2 and CC are relatively low. Exp. 3 and 4 (UVEG and SVEG), on the other hand, only exhibit a negative relation between LCL deficit and P as the initial vegetation states lead to a PBL that is deepened more than the LCL is raised (-ΔLCL deficit) such that a higher possibility exists for the PBL to reach the LCL and trigger convective precipitation (Findell and Eltahir, 2003; Zaitchik et al., 2013). Notably, the R2 and CC for Exp. 3 and 4 between ΔLCL deficit and ΔP are slightly higher than for the other cases (Table V), though statistical significances are not achieved. Thus, the different atmospheric mechanisms tracked for each feedback process are notable. The impact of the initial soil moisture and vegetation states on storm-scale total precipitation amounts is shown in Figure 10 as spatial maps of ΔP (Exp. minus baseline) averaged over all storm periods (48 h of analysis). Clearly, precipitation is increased regionally at low to moderate amounts (0.2 to 3 mm), while localized precipitation in the RSB can be augmented from 13 to 26 mm, for both higher initial soil moisture or vegetation condition in a similar way. Precipitation enhancements tend to concentrate in southern mountainous areas of the RSB with some correlation noted with locations with increases in CAPE (Fig. 9). Interestingly, there appears to be no effect of the spatial variability of soil moisture (USM vs. SSM) or vegetation states (UVEG vs. SVEG) on precipitation patterns when viewed across the four storm events.

4. Summary and conclusion
Land surface controls on precipitation generation have been hypothesized to be important during the NAM season in northwest México (e.g., Matsui et al., 2005; Domínguez et al., 2008; Vivoni et al., 2009; Méndez-Barroso and Vivoni, 2010). However, to our knowledge, no prior studies have directly tested the independent impact of initial soil moisture and vegetation conditions on storm-scale precipitation accumulations in the region. In this study, we utilized a fully-coupled land-atmosphere modeling system to investigate the effect of imposed soil moisture and vegetation anomalies on precipitation generation using the framework of Eltahir (1998) to diagnose the mechanisms underlying two distinct positive feedback loops. The work was limited to coupled (online) simulations during four storm periods (72 h) sampled from two NAM seasons under a set of uniform and spatially-variable adjustments of soil moisture and vegetation greenness. Nevertheless, the baseline simulations compared favorably with available reanalysis products and the uncoupled (offline) runs that were evaluated against ground-based and remotely-sensed land surface conditions by Xiang et al. (2017). Selected storm periods were of comparable size and sampled differences in initial conditions, thus providing a suitable testbed for exploring soil moisture and vegetation feedback processes with precipitation.
Our study findings are summarized in two conceptual diagrams shown in Figure 11 based upon the framework of Eltahir (1998) for the soil moisture-precipitation (Fig. 11a) and vegetation-precipitation (Fig. 11b) feedback pathways. Blue (up, increase) and red (down, decrease) arrows track the results from the initialization experiments that commence with the imposed soil moisture and vegetation anomalies for uniform and spatially-variable cases (Table IV). At the land surface, a similar behavior occurred with respect to albedo for both feedback pathways, with a decrease in a due to soil wetting and vegetation greenup leading to higher net solar radiation. However, a distinction was noted with respect to the evaporative fraction, where an increase in θ s had a significant effect on increasing EF, while higher VF and LAI slightly decreased EF due to the effects of vegetation radiation sheltering of soil evaporation. Despite these distinctions, the overall effect of soil moisture and vegetation anomalies was a decrease in surface temperature and an increase in net terrestrial radiation, thereby augmenting net radiation and turbulent fluxes. For the atmospheric phase, variations in land surface energy partitioning (EF) are sufficiently strong to induce a decrease in the planetary boundary layer height and an increase in the wet bulb temperature for the case of positive soil moisture anomalies as proposed by Eltahir (1998), but deviate in this behavior for the initial vegetation cases. This distinction among the two feedback pathways is important, as it requires an alternative explanation for how the PLBH and LCL interact to promote precipitation in the case of vegetation greening (Findell and Eltahir, 2003). In addition, positive anomalies in land surface states result in differences in convective available potential energy with more widespread (localized) increases for the soil moisture (vegetation) experiments, though these distinctions are less apparent in terms of precipitation patterns.

Fig. 11 Schematics of (a) soil moisture-precipitation and (b) vegetation-precipitation feedback pathways with study findings. Upward (blue) arrows represent increases in a variable, while downward (red) arrows depict decreases.
Overall, the process-based analysis reveals that both the soil moisture-precipitation and vegetation-precipitation feedback mechanisms are positive at the storm-scale within the study area and can lead to increases in precipitation of up to 26 mm over 48 h. More importantly, the underlying pathways via which each feedback process operates have been diagnosed using the framework of Eltahir (1998) to identify distinctions in how the initial vegetation state affects precipitation generation. While the positive vegetation-precipitation feedback appears to be weaker than the soil moisture-precipitation feedback process along particular pathway steps, it is noteworthy that precipitation outcomes between the two cases are similar in terms of spatial extent and magnitude. This suggests that the correct initialization of soil moisture and vegetation cover conditions through remote sensing or sensor networks is equally important for improving the predictability of precipitation during the NAM, and likely more important for cases with weak synoptic forcing when local interactions are more relevant (Domínguez et al., 2008). Furthermore, the sensitivity of precipitation to both soil moisture and vegetation states indicates that as the NAM progresses and the land surface becomes wetter and greener (e.g., Vivoni et al., 2008; Forzieri et al., 2011; Mascaro et al., 2015), the positive feedback loops would play an increasing more important role in sustaining local precipitation recycling. In addition, since the time scales of variability in soil moisture (1-3 days) and vegetation cover (3-7 days) are different during the NAM (Vivoni, 2012), the degree of land surface memory would also vary in such a way that the more efficient soil moisture-precipitation loop is likely to dominate after a storm event, whereas the vegetation-precipitation feedback might play a larger role in subsequent days. Identifying the temporal variability of the precipitation feedback processes and the synergies that might exist between soil moisture and vegetation conditions are thus considered fruitful avenues of future research using coupled land-atmosphere modeling systems.

