


 nueva página del texto (beta)
 Inglés (pdf)
 Artículo en XML
 Referencias del artículo
 Enviar artículo por email
 Citado por SciELO
  Similares en
SciELO
Similares en
SciELO 
 Permalink
1.Introduction
Instead of evolving in isolation, galaxies are found in clusters and groups, and they can interact quite strongly with their nearby companions. These interactions can have a profound impact on the properties of galaxies, resulting in intense bursts of star formation, the onset of quasar-like activity in galactic nuclei and perhaps even the complete transformation of spiral galaxies into elliptical galaxies. Studies of galaxies in the early universe show a significant fraction of interacting and merging systems, and theories of cosmological structure formation indicate that most galaxies have had some form of strong interaction during their lifetime. Rather than being rare events, galaxy interactions may be the dominant process shaping the evolution of the galaxy population in general (Mihos 2000).
The evolution and interaction of galaxies is governed by gravitational effects. Morphologically, in the interacting galaxies there are large bridges and tails, stellar bars and/or increased spiral structures and, commonly, the bodies of galaxies are distorted .(Schweizer 1986). Toom & Toome (1972), through numerical simulations, established that the gravitational interaction with another galaxy may be the source not only of spiral structures, but also of the filamentary structure, which they called ‘tidal tails’; thus, gravity is solely responsible for these large and thin tails and several other deformations seen in several surveys (e.g. Arp 1966; Karachentsev 1987; Vorontsov-Velyaminov et al. 2001).
Numerical simulations show that during a merger, tidal forces from a companion galaxy trigger the formation of a bar in the disc of a perturbed galaxy (Noguchi 1987; Salo & Laurikainen 2000a,b; Renaud et al. 2015). The bar acts to trigger starburst activity by rapidly funnelling large amounts of gas to the nuclear region (Barnes & Hernquist 1992; Dinshaw et al. 1999; Gabbasov et al. 2014; Martin & Soto 2016). When a bar is clearly observable in the stellar component, the gas dynamics shows very distinctive characteristics, corresponding to elliptical and non-circular orbits; the isovelocities contour curves are deformed symmetrically. Hence, the inclination of the central isovelocity contour curve along the minor axis is one of the main features used to identify a bar (Bosma 1981; Combes et al. 2002).
The simplest case in the process of galaxy interactions is that of isolated galaxy pairs, which are systems composed of two galaxies located so close in space that the gravitational effect of their nearest neighbours can be neglected relative to the gravitational effects exerted between each other (Fuentes-Carrera et al. 2004; Rosado et al. 2011, Gabbasov et al. 2014). Systematic research on double galaxies provides us with important information about the conditions of formation and properties of the evolution of galaxies (Karachentsev 1987).
Obtaining kinematic information from interacting galaxies is useful for understanding the effect that the interaction can have on each of the members of the pair (Fuentes-Carrera et al. 2004, 2007; Repetto et al. 2010). In highly disturbed velocity fields, double nuclei, double kinematic gas components, and high amplitude discrepancies between both sides of the rotation curves imply strong galaxy-galaxy interactions or mergers. On the other hand, stellar and gaseous major axes misalignments and tidal tails suggest collisions that may not always lead to merging (Amram et al. 2003; Torres-Flores et al. 2014).
From the observational point of view, most of the kinematic work on interacting galaxies has been carried out using long-slit spectroscopy along certain positions (e.g. Günthardt et al. 2016), restricting kinematic information to only a few points on the galaxy. However, for an asymmetric perturbed system, it is important to obtain the kinematic information from large portions of the disc, using observational techniques such as integral field spectroscopy with a scanning Fabry-Perot interferometer (FP). In this way, the extended kinematic information can help us determine the interaction process which has been produced on each of the members of the interacting system, in addition to the fact that, sometimes the axial symmetry of each galaxy is lost during the interaction (Fuentes-Carrera et al. 2004, 2015; Epinat et al. 2008).
1.1.NGC6090
The isolated interacting galaxy pair KPG486 (NGC6090) has been described as a double nuclei system with an asymmetric disc and two long tidal tails of ≈ 60 kpc in length (e.g. Dinshaw et al. 1999). At optical wavelengths, this galaxy system looks like the NGC4038/39 galaxy system (The Antennae) (e.g. Toomre & Toomre 1972; Hummel et al. 1987; Martin et al. 1991; Mazzarella & Boroson 1993; Dinshaw et al. 1999; Bryant & Scoville 1999). This feature can be observed in the upper panel of Figure 1 which shows the optical image of NGC6090 taken from the Digitized Sky Survey (DSS) in a field of view of 4 arcmin.

Fig. 1 Top: Image from the Digitized Sky Survey (DSS) in a 4 arcmin field of view centred on the galaxy system NGC6090 over which, superposed in red, is shown the Hα direct image, taken with a 6819 Å filter with a FWHM of 86 Å (obtained from the PUMA in its direct image mode at the 2.1 m telescope from the Observatorio Astronómico Nacional in San Pedro Mártir, OAN-SPM, Baja California, México). Bottom: 2.22 μm image from the Near-Infrared Camera Multi-Object on the Hubble Space Telescope (NICMOS/HST) over which, superposed in red, is shown the H𝛼 direct image from OAN-SPM in a 28 arcsec field of view centred on NGC6090. The color figure can be viewed online.
In radio-wavelengths NGC6090 appears as a pair of interacting spirals separated by 0.14 arcsec, with nuclei in contact and with enormous curved wings (Martin et al. 1991).. Meanwhile, molecular gas appears elongated and aligned along the direction of the nuclei as a rotating disc (Wang et al. 2004) or ring (Bryant & Scoville 1999; Sugai et al. 2000). The position angle of that disc is ≈ 60o with a major axis length of ≈3.4 arcsec; the CO source appears to peak between the radio nuclei rather than on one of them and the molecular gas component does not appear to belong to any of the galaxies in the system based on kinematics (Wang et al. 2004).
Due to the interaction evidence that NGC6090 shows it was defined as a merger by Chisholm et al. (2015). But NGC6090 has also been defined as a galaxy system in an intermediate stage of merging or pre-merging because, in addition of its two nuclei and tidal tails, the galaxy system has an identifiable bridge (Miralles-Caballero et al. 2011). In the near-infrared, the galaxies that make up NGC6090 are seen as follows: NGC6090NE has a distorted spiral structure and evidence of a stellar bar, and NGC6090SW looks like an irregular galaxy; the position of its nucleus is still under discussion. In Table 1 we list the general parameters of NGC6090 which hitherto have been reported only for a single galactic system.
Table 1 Parameters of the Galaxy system NGC 6090
| Parameters | NGC 6090 system |
| Coordinates (J2000) | α = 16h 11m
40.7s
δ = +52o 27´24´´.a |
| Other names | KPG 486a,c NGC 6090a UGC 10267 a Mrk 496a |
| Morphological type | G Pair a
Multiple galaxy b Merger, double nucluese Mergerg |
| Mean heliocentric | 8906a |
| Radial velocity (km s-1) | 8855b |
| Distance (Mpc) | 122d,* 123.3e,* 128 g,** 127.7 h,** |
| LIR(Lʘ) | 3 x 10¹¹ f |
| mb | 14.36 a |
| D25/2 (arcim) | 4.36 b |
| Photometric nuclear | |
| Separation (arsec) | 5.4 e |
aNASA/IPAC (2014) (NASA/IPAC Extragalactic Data Base (NED) is operated by the Jet Propulsion Laboratory, California Institute of Technology, under contract with the National Aeronautics and Space Administration. https://ned.ipac.caltech.edu/).
bHyperLeda (HyperLeda: http://leda.univ-lyon1.fr/).
hCortijo-Ferrero et al. (2017).
*Distance D = v=H0 computed using H0 = 75kms-1 Mpc-1.
**Distance obtained from z = 0:02930 with H0 = 70kms-1 Mpc-1.
To investigate the distribution of ionized hydrogen gas, the morphology, and kinematic and dynamic behaviour of the galaxy system NGC6090, we obtained a FP data cube spectrally centreded on the Hα emission line of the system. In this paper we present the analysis of the Hα image, the velocity field and dispersion velocity map of the pair of galaxies NGC6090, as well as the rotation curves obtained for each member. Lastly, we comment on our results and those found in the literature, and compare the kinematic characteristics of the galaxy system NGC6090 with those of the Antennae made by Amram et al. (1992).
This paper is organized as follows: in § 2 there is an overview of the observational parameters and the reduction process; in § 3 we present the morphological features of NGC6090 observed from its H𝛼 monochromatic and continuum maps; § 4 is devoted to the kinematic analysis made from our FP data. We show the derived velocity fields, the associated rotation curve of each member of the galaxy system NGC6090 and we analyse the non-circular motions of each galaxy through the velocity dispersion map of the system; § 5 is dedicated to the dynamical analysis, including the computation of the mass of each galaxy. A discussion is presented in § 6, and our conclusions are given in § 7.
In this paper, we considered H0 = 75km-1Mpc-1 (Condon et al. 1990) and adopted a distance of 118Mpc for NGC6090.
2. Observations and Data Reductions
Our observations of NGC6090 were performed in July 2015 with the f/7.5 Cassegrain focus at the 2.1 m telescope at the Observatorio Astronómico Nacional in San Pedro Mártir, Baja California, México (OAN-SPM) using the scanning Fabry-Perot interferometer, PUMA. PUMA is a focal reducer built at the Instituto de Astronomía-UNAM and used to obtain images and Fabry-Perot interferometry of extended emission cosmical sources. The FP used is an ET-50 (Queensgate Instruments) with a servostabilization system; it has a free spectral range of 19.9 Å (909 km s-1) at Hα. The effective finesse of PUMA is ≈ 24 which implies a sampling spectral resolution in H𝛼 of 0.414 Å (19.0km s-1)achieved by scanning the interferometer free spectral range through 48 different equally spaced channels . However, due to the parallelism of the FP mirrors during the data acquisition for the observations, particularly of NGC6090, the measured finesse for this data cube was ≈ 10 which leads to a sampling spectral resolution of 0.97 Å (44.1km s-1)at Hα.
We used a 2048 x 2048 CCD detector with a pixel scale of 0.317arcsec and we set a 4 x 4 binning to enhance the signal, obtaining a 512 x 512 pixel window inside of a field of view of 10 arcmin. So, we obtained a final spatial sampling per pixel of 1.27aecsec which is slightly better than the average seeing of 1,67arcsec. To isolate the redshifted Hα emission line an interference filter centred at 6819 Å with FWHM of 86 Å was used. Thus, we obtained an Hα data cube with a total exposure time of 72 minutes (90s per channel).
In order to avoid phase wavelength dependence of the FP layers it is necessary to calibrate the data cube in wavelength. So, we used a Ne lamp whose line at 6717 Å is close to the redshifted nebular wavelength to obtain a calibration cube at the end of the observation. The parabolic phase map was computed from the calibration cube in order to obtain the reference wavelength for the line profile observed inside each pixel. The instrumental and observational parameters are listed in Table 2.
Table 2 Instrumental and observational parameters
| Parameter | Value |
| Telescope | 2.1 m (OAN, SPM) |
| Instrument | PUMA |
| Detector | Site3 CCD |
| Detector size | 2048 x 2048pix |
| Image scale (binning 4 x 4) | 1.27 arcsec/pix |
| Scanning FP interferometer | ET-50 |
| Finesse | ≈10 |
| FP interference order at Hα | 330 |
| Free spectral range at Hα | 19.9 Å (909km s-1) |
| Spectral sampling | |
| resolution at Hα | 0.97 Å (44.1 km s-1) |
| Interference filter | 6819Å (FWHM= 86 Å) |
| Total exposure time | 72 min |
| Calibration line | 6717Å (Ne) |
| Average seeing | 1.67 arcsec |
For the data reduction and analysis we used the ADHOCw1 software to make the standard corrections to the cube: removal of cosmic rays and bias subtraction, subtraction of the OH sky lines at 6828.5 Å, 6842.2 Å and 6863.9 Å (Chamberlain 1961, Krassovsky et al. 1962) and application of a spectral Gaussian smoothing with σ = 57km s-1 in the data cube. We applied IRAF2 tasks such as to determine the average seeing of our data and to add the World Coordinate System (WCS) to the resulting maps of NGC6090. To complete the data analysis we used our own Python scripts.
The FP scanning process allows us to obtain a flux value in arbitrary units at pixel level for each of the 48 scanning steps. The calibration in wavelength was fixed for each profile at each pixel using the calibration data cube. Thus, the intensity profile found throughout the scanning process contains information about the monochromatic emission (ionized gas emitting at Hα), the continuum emission of the object, as well as the velocity of the ionized gas.
The computation of the image of the continuum was made considering the average of the 3 lowest intensities of the 48 channels of the cube (e. g. Vollmer et al. 2000; Fuentes-Carrera et al. 2013; Cárdenas-Martínez & Fuentes-Carrera 2018). For the monochromatic image, the intensity of the Hα line was obtained by integrating the maximum value of the line profile for each pixel.
ADHOCw calculates the radial velocity fields using the barycentre of the profile of the Hα line for each pixel with an accuracy for the central velocities of ± 5 km s-1 . We masked the velocity field including only a rectangular area that contains the part of the radial velocity map corresponding to NGC6090. Then, we superimposed the radial velocity profiles on the resulting velocity field and masked the radial velocity field based on the signal-to-noise ratio of each pixel, whose values were in the range from 24 in the centre of the galaxy system down to 4 in the most external pixels.
In addition to the data cube, we obtained a direct H𝛼 image of NGC6090 having the FP out of the optical path and with the same filter, with an exposure time of 90 seconds.
3. Monochromatic and Continuum Images
On the DSS optical image of NGC6090 (upper panel of Figure 1) we superimposed the direct Hα image obtained with PUMA. The ionized gas emitting at Hα that we detected was found within the central area of the object, which has 20.32 arcsec per side, i.e. 16 pixels per side, where 1pix = 1.27arcsec = 0.726 kpc. The mean heliocentric radial velocity that we determined for the galactic system NGC6090 is 8885km s-1. We did not detect ionized gas emitting in Hα in the tidal tails (antennae), so we limited our kinematic analysis to the central area of NGC6090 disregarding the antennae. In the bottom panel of Figure 1 we show the NICMOS/HST 2.22 μm image whose 22 arcsec field of view matches our results.
To visualize the morphology of NGC6090 that the PUMA data show the contours of the H𝛼 continuum (Figure left panel) and monochromatic (Figure 2 right panel) emissions of NGC6090 were superposed on the NICMOS/HST image.

Fig. 2 Left: contours of the continuum linearly spaced from 1500 to 10000 ADU obtained from the Hα data cube by the scanning FP interferometer, PUMA, overlaid on the NICMOS/HST 2.22 μm image in a 22 arcsec fiweld of view centred on NGC6090. Right: contours of the Hα monochromatic image linearly spaced from 4000 to 240000 ADU obtained with PUMA, overlaid on the NICMOS/HST 2.22 μm image in a 22 arcsec field of view centred on NGC6090. The color figure can be viewed online.
The coordinates of the continuum maximum of NGC6090NE are
For the galaxy NGC6090SW, the coordinates of the photometric maximum are
αj2000 = 16h 11m40.8s,
δj2000 = +52o27´27´´.0 and the coordinates of the Hα
monochromatic maximum are
4.Kinematic Results
4.1.Velocity Fields
In the previous section it was shown that the ionized gas emitting at H𝛼 does not have the same morphology as the continuum emission. As a consequence of this phenomenon, due to the interaction between the galaxies, we do not expect that all the photometric and kinematic parameters will exactly match. In Figure 3, which shows the velocity field of NGC6090 (with its isovelocities contour curves and the 2.22 μm image superposed) it is possible to notice the velocity field of two independent galaxies, i.e. NGC6090 presents two velocity fields ordered roughly on each one of its photometric maxima. Also, each velocity field has distortions towards the outside, mainly toward the northern side of both galaxies.

Fig. 3 Velocity field acquired with the H𝛼 data cube observation obtained with the scanning FP interferometer, PUMA, in a 26 arcsec field of view centred in NGC6090. On the velocity field are overlaid, firstly, the NICMOS/HST 2.22 μm image and, secondly, the isovelocity contours of each galaxy which are linearly spaced by a factor of 10 starting from 8810km s-1. Each isovelocity is labelled in km s-1 units. The color figure can be viewed online.
For NGC6090NE, the values of the radial velocities within its ordered velocity field, which reaches a radius of R=5.6arcsec, lie in the range from 8783 to 8919 km s-1. For NGC6090SW, the radial velocities lie in the range from 8799 to 9143 km s-1 within its velocity field ordered up to a radius of R=4.5 arcsec. Furthermore, Figure 3 for NGC6090NE, shows that the isovelocity contour curves of the disc of the galaxy are not symmetric with respect to the kinematic minor axis. This feature, added to the morphology indicated by the continuum contours described in the previous section, suggests the presence of a stellar bar, in agreement with the criteria proposed by .Bosma (1981)
4.2.Rotation Curves
From the morphological and kinematic features described in previous sections, we can argue that we have detected two independent galaxies inside the NGC6090 galactic system. In this kind of interacting systems the radial motions, such as inflows/outflows or motions perpendicular to the galactic disc, are second order effects, otherwise the discs would be destroyed. We started studying the circular motion of each galaxy in NGC6090, which corresponds to the most basic motion that can be assumed in a disc galaxy. In this way, the rotation curve of each galaxy was obtained from the kinematic data acquired with our FP observations using the ADHOCw software, which computes the radial velocity of the galaxies in every single pixel using the bary centre of the Hα profile observed in each pixel.
In doing so, we use the geometric and kinematic assumptions proposed by Mihalas
& Binney (1981). Supposing that each galaxy has a well-defined disc and that
the system rotates about an axis that is perpendicular to the galactic plane
which is inclined an angle i to the plane of the sky; we use the polar
coordinate systems (
Where Rk and θk are given in terms of the coordinates
pK and
The ADHOCw software averages the measured velocity of the pixels that are at the
same distance from the kinematic centre along the major axis, indicating the
dispersion associated to this average with bars on the points of the rotational
observed curves. In order to avoid strong dispersions associated to the points
of the rotation curves the pixels within an angular sector along the kinematic
major axis were considered as shown in left panels of Figure 4. Then, assuming that each galaxy has a well-defined
disc, due to its inclination it would look like an ellipse on the sky plane with
apparent axis lengths a and b; so, its inclination can be computed by

Fig. 4 Left panels show the velocity maps acquired with the H𝛼 data cube obtained with the scanning FP interferometer, PUMA, in a 22 arcsec field of view. On these maps was superposed the NICMOS/HST 2.22 μm image as a frame of reference for the position of galaxy components in the galactic pair; then, on each map, the solid line represents the major kinematic axis which indicates the kinematic PA, and the dashed lines represent the sector angle that was considered for the computation of the rotation curve of each galaxy: NGC6090NE above and NGC6090SW below. In the right panels are shown the rotation curves of each galaxy, obtained up to where the velocity field is ordered for each galaxy; the dispersion associated with the averaged value of pixels within the same sector is indicated with bars. The color figure can be viewed online.
Table 3 contains the parameters used to calculate the rotation curve of each galaxy. The listed values correspond to those values with which we obtained the rotation curves from our observations; changes in these values would result in scattered points in the rotation curves instead of symmetric rotation curves.
Table 3 Rotation curve parameters and mass range of each galaxy in the NGC 6090 pair
| Parameter | NGC6090NE | NGC6090SW |
| Coordinates (J2000) | ||
| δ = +5227 2694 | δ = +52 27 2221 | |
| Distance (Mpc) | 118 | 118 |
| Systemic velocity (km s-1) | 8880 | 8890 |
| Max. rotation velocity (kms-1) | 130±5 | 132±5 |
| Kinematic 𝑃𝐴 (o) | 150±3 | 26±3 |
| Inclination (o) | 13.9±0.5 | 64.8±0.5 |
| Radius (arcsec) | 5.6 | 4.5 |
| Radius (kpc) | 3.2 | 2.6 |
| Mass (Mʘ) | 0.76 x 10¹⁰ to 1.26×10¹⁰ | 0.63×10¹⁰ to 1.05 x 10¹⁰ |
The rotation curve of NGC6090NE presented in the upper right panel of Figure 4 was obtained with pixels in the
velocity field within an angular sector of 30o around the kinematic
major axis of the galaxy as marked in the upper left panel of Figure 4. The physical coordinates of the
kinematic centre, derived as the position around the photometric centre at which
the scatter in rotation curve is minimized, are
The rotation curve of NGC6090SW (bottom right panel of Figure 4) was obtained with pixels in the velocity field
within an angular sector of 60o around the kinematic major axis of
the galaxy. The physical coordinates of the kinematic centre are
In the rotation curve of NGC6090SW there is a point on the receding side with a high dispersion associated to the average of the radial velocities computed using only two pixels of the velocity field; the pixel on the kinematic centre considered the framework to draw the radial velocities in the rotation curve and hence, considered the point with the lowest radial velocity value, and the pixel at the southwest of the kinematic centre with the highest radial velocity value of the velocity field of the entire system. Despite that, we decided to use this point only to get a better view of the rotation curve of this galaxy toward the south.
4.3.Velocity Dispersion Field
Through the full width at half maximum (FWHM) of Gaussian functions fitted to the
velocity profile of the Hα line in each pixel we obtained the velocity
dispersion map of the galaxy system. Figure
5 displays the velocity dispersion map of NGC6090 with the NICMOS/HST
image overlaid. In NGC6090NE the velocity dispersion increases gradually from in
the eastern side of the galaxy, to
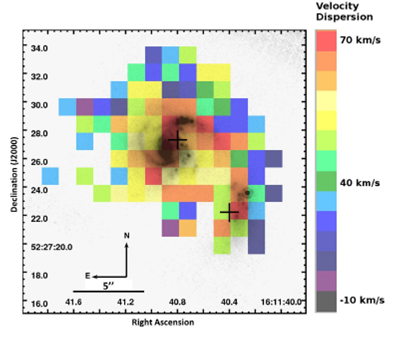
Fig. 5 Velocity dispersion map obtained using the PUMA in a 22 arcsec field of view centred on NGC6090 superposed on the NICMOS/HST 2.22 μm image. Symbols ‘+’ represent the photometric centre of each galaxy. The color figure can be viewed online.
In the north side of the galaxy system and between both galaxies, broader profiles were noticed through double radial velocity profiles with a low signal to noise ratio, detected with PUMA and mainly located in the bridge zone. Those broader profiles were already detected by Cortijo-Ferrero et al. (2017) and interpreted as a consequence of shocks in early-stage mergers. This feature of the velocity dispersion field indicates that NGC6090 has an interaction bridge between its galaxies. Those pixels with double velocity profiles are outside of the ordered velocity field of each galaxy, so that they do not contribute at any point in the computation of the rotation curves. Moreover, given their low signal to noise ratio we do not consider them in this work.
4.4. The Rotation Sense of NGC6090NE
Intensity profile of the continuum map of NGC6090NE along the minor axis centred on the galactic phometric centre. Following the gradient criterion of , the far side of the galaxy would be the one that decreases more smoothly. Therefore, the nearest side to the observer of NGC6090 is the eastern one. The top-right panel shows a schematic 3D orientation of NGC6090NE derived from our kinematic analysis. The color figure can be viewed online.
Radial-velocity measurements cannot by themselves distinguish leading and trailing spirals in thin disks. To determine whether a given galaxy leads or trails, we must determine which side of the galaxy is closer to us. Thus, to determine if the galaxies in NGC6090 lead or trail, we followed the gradient criterion of : the apparent brightness of the nuclear region falls off unequally from the centre outward along the minor axis, the far side being the one where the surface-brightness profile declines more smoothly. This means that if the inner disc is dusty, it absorbs a significant fraction of the starlight passing through it, then the surface brightness of the bulge at a given distance along its apparent minor axis will be lower on the near side . In this way, for each galaxy in the NGC6090 pair the intensity profile of the continuum emission was obtained along their minor axis in order to determine the rotation sense of each one.
For NGC6090NE, we extracted the intensity profile of the continuum from its minor photometric axis (see Figure 2 in § 3), as shown in Figure 6. This profile indicates that the side nearest to the observer is the eastern side of the galaxy. Then, considering that the rotation curve indicates that the gas on the northern side is blue-shifted and, availing us of the dust lanes which trace the arms structure of this galaxy (see right panel of Figure 1), we can infer that this galaxy has its arms rotating in a trailing direction.

Fig. 6 Intensity profile of the continuum map of NGC6090NE along the minor axis centred on the galactic phometric centre. Following the gradient criterion of , the far side of the galaxy would be the one that decreases more smoothly. Therefore, the nearest side to the observer of NGC6090 is the eastern one. The top-right panel shows a schematic 3D orientation of NGC6090NE derived from our kinematic analysis. The color figure can be viewed online.
On the other hand, for NGC6090SW it was not possible to obtain an accurate result through which we might determine its rotation sense, due to the low number of pixels with continuum emission along its minor axis. In addition, the image of 2.22 μm does not clearly mark the structure of spiral arms.
5. Mass Estimates Using Dynamical Analysis
A range of possible values for the mass of each galaxy in the NGC6090 system was
calculated using the approach described by Lequeux
(1983), as has been done before when studying pairs of galaxies (e.g
Amram et al. 1992, Fuente-Carrera et al. 2007; Repetto et al. 2010). This approach consists in calculating the mass
M(R) up to a certain radius where the rotation velocity V(R) has been measured. The
method considers two extreme cases to evaluate the mass of galaxies: the galaxy as a
flat disc or the galaxy as a spherical system. Thus, the mass of the spiral galaxies
is in the range of
Thus, from the NGC6090NE rotation curve, the maximum rotation velocity of this galaxy
is
When two galaxies of roughly equal mass have an encounter, their extended halos may merge to form a common halo. Then, the galaxies are expected to orbit in a common halo until dynamical friction and tidal interactions remove sufficient orbital energy for the galaxies to merge (e.g. Binney & Tremaine 1987; Mo et al. 2010). Thus, due to the active state of interaction of the galaxies in NGC6090 it is possible to infer that they are dominated by a flat disc individually, but a further study on the dynamics of this encounter would be necessary to dismiss the case in which both galaxies are dominated by a spherical halo.
A second independent way of obtaining the mass value of a pair of galaxies is the
method proposed by Karachentsev (1987), which
calculates the mass from the relative orbital motion of the components. This method
consists of assuming that the components of the pair move in a circular orbit with a
velocity V12 and a spatial separation r. When V12 and r are
transformed into observable quantities, they become the difference of the velocity
projected in the line of sight,
where G is the gravitational constant. As y and X depend on a sinusoidal function, in
order to obtain the upper limit of mass with this method without loss of generality,
we assumed that the orbital plane has an inclination of
where V12 is the difference between the velocities of the galaxies, and r
is the projected separation between the nucleus of each galaxy. For the system
NGC6090 we have,
6. Discussion
At optical wavelengths, NGC6090 appears as a double nuclei system with two curved antennas (tidal tails), so that this galaxy system has been described as similar to NGC4038/39 (the Antennae) (e.g. Toomre & Toomre 1972; Martin et al. 1991; Mazzarella & Boroson 1993; Dinshaw et al. 1999; Bryant & Scoville 1999). With the goal of studying kinematic similarities between both systems produced by the interaction of their own galaxies, we studied the Hα kinematics of NGC6090 using the scanning Fabry-Perot interferometer, PUMA. The Hα kinematics of the galaxy pair the Antennae has been studied through observations obtained with another FP bay Amram et al. (1992). In neither galaxy system, NGC6090 and the Antennae, was emission of ionized hydrogen detected in their tidal tails, i.e. in both galaxy systems ionized gas emitting at Hα was only detected in the central zone. Therefore, performed a kinematic analysis of the disc of the Antennae, as we have done for NGC6090 in this paper.
Amram et al. (1992) reported that in the
Antennae, ionized gas emitting at Hα is deficient compared with its continuum
emission, but that the emissions tend to grow toward its part farthest from its
companion. Then, the Antennae nuclei matched unambiguously with observations at 2.2
μm. The velocity field is not ordered throughout the system; none of its component
galaxies show the behaviour of a rotating disc. Additionally, there were no detected
pixels with double velocity profiles. Finally, using the method to measure the mass
of the galaxies, found that the individual masses of the galaxies in the Antennae
are approximately
For NGC6090, in § 3 we noted that the intensity of ionized gas emitting in Hα is lower with respect to that of the continuum; but within each galaxy, the ionized hydrogen gas is situated near to its companion, while the old stellar population is lagging in the opposite direction. The positions of the nuclei reported at 2.22 μm by , the HI continuum maxima reported by Dinshaw et al.(1999), and the monochromatic and continuum Hα maxima that we obtained in this paper are marked on the NICMOS/HST image in Figure 7.

Fig. 7 NICMOS/HST image at 2.22 μm of a field of view of 16 arcsec centered
at NGC6090. In this image we have marked the positions of the maximum
emissions of the continuum (O), the Hα monochromatic emission (
For NGC6090NE, we found that the maxima of the monochromatic and continuum of the PUMA observations almost completely coincide and match the kinematic centre (within 0.4 arcsec). In Figure 7 we show that the differences between the position of the nucleus of this galaxy reported in the literature and our results are minimal.
However, for the galaxy NGC6090SW the maxima of the continuum and the monochromatic
emissions derived from our observations of the ionized gas emitting in Hα are not
nearly in the same position as those in NGC6090NE. This galaxy presents greater
emissions of ionized hydrogen towards the north than the south, so that the
photometric maximum is located to the south, while the maximum monochromatic
emission is in the north. Thus, for NGC6090SW, the position of the monochromatic
emission maximum is
Dinshaw et al. (1999) compared the position of the brightest point in the 2.22 μm image with the maximum of the radio-continuum of this galaxy; they proposed that the infrared peak could be a field star. However, the emission of a field star could not be detected as the maximum of the redshifted Hα line of our observations of NGC6090. Therefore, it may be concluded that the infrared maximum for the southwestern galaxy is a component itself. This possibility is supported by Cortijo-Ferrero et al. (2017), who argued that the main absorption lines of their observations in the range from 3700 to 7100 Å at the knot of 2.22 μm have the same redshift as the galaxy. However, Cortijo-Ferrero et al. (2017) obtained that the position of the continuum maximum is southward of the infrared peak, near where we detected the continuum maximum, the kinematic centre and the velocity dispersion maximum of NGC6090SW. Thus, taking the maximum of the Hα continuum as the nucleus of the southwest galaxy, we determined that the separation of the nuclei of the two members of NGC6090 is 7.11arcec. Assuming that the average distance of the galaxy system NGC6090 is 118 Mpc, the distance between its nuclei is 4.1 kpc.
Regarding the velocity field of NGC6090, we said in § 4.1 that this galaxy system has
two ordered velocity fields which allowed us to compute the rotation curves of each
galaxy in the NGC6090 system. The rotation curves have maximum rotational velocity
larger than the dispersion or residual velocity fields: the northeast galaxy has a
maximum rotational velocity
Furthermore, with the continumm map obtained from our observations, with the asymmetric isovelocities contour curves, and the non-circular motions that we detected in NGC6090NE, we confirmed the assumption about the presence of a bar structure in this galaxy made in the infrared by Dinshaw et al. (1999) (see figure 2 of their paper) and at optical wavelengths by Cortijo-Ferrero et al. (2017)
In their paper, Amaram et al. (1992) concluded that the encounter of the galaxies that make up the Antennae is in an advanced stage of interaction. In the case of NGC6090, the features that we have discussed about its two ordered velocity fields, continuum and monochromatic maps, and the behaviour of its velocity dispersion field that signals an interaction bridge between galaxies, allow us to conclude that NGC6090 is a system in a less advanced stage of interaction than the Antennae, although both systems are in an interaction stage previous to a merger.
Regarding the mass values, Table 4 contains the values of the masses reported in the literature for the NGC6090 system at different wavelengths compared to our results. The range of the sum of independent masses estimated in this paper from the rotation curves of each galaxy obtained with the method of is of the same order of magnitude as the masses estimated by other authors in the infrared (Sanders et al. 1991; Bryant & Scoville 1999; Chisholm et al. 2016a; Cortijo-Ferrero et al. 2017) and radio continuum (Martin et al. 1991), which were determined by means of the mass-to-light ratio. However, the mass of the NGC6090 system calculated with the method proposed by is two orders of magnitude smaller than the former values, and an order of magnitude smaller than the dynamic mass estimated by Bryant & Scoville (1999).
Table 4 Masses of the galaxy system NGC6090 found in the literature at different Wavelengths compared with the ones found in this work
| Author | Phase of the | Mass |
| IM observed | [ |
|
| H2 | 1.4 | |
| H2(dyn) | 0.46 | |
| H2(gas) | 2.29 | |
| HI | 3.9 | |
| MIR | 5.02 | |
| MIR | 4.2 | |
| 3650 -6950 Å | 6.8 | |
| This work | H |
1.39 |
| H |
2.31 | |
| H |
0.032 |
The sum of the masses computed from the maximum rotation velocity is of the same order of magnitude as the masses acquired from the mass-to-light ratio at other wavelengths. They also coincide with the value determined by Sanders et al. (1991) and Bryant & Scville (1999), both if each galaxy is dominated by a flat disc or a spherical halo. Hence, we can argue that the kinematic parameters that we obtained in this work are reliable. The difference of an order of magnitude in the orbital mass can be consequence to our geometrical assumptions of the movement of NGC6090SW around of its companion.
Most of the numerical simulations have assumed similar initial conditions to model different features of the Antennae (e. g. Toomre & Toomre 1972, Barnes 1988, Teyssier et al 2010, Renaud et al. 2008, 2015), either its morphology or the formation of star clusters during the merger. They obtain always the same feature: two long tidal tails that form the antennae. Therefore, in general, the symmetry of the tidal action allows the formation of four arms if the two companions are disc galaxies; when the masses of the two interacting galaxies are equal or similar, the two internal spiral arms join up to form a bridge, while the two external arms are drawn into two antennae which remain for one or two billion years (Combes et al. 2002). This phenomenon is happening to the galaxies of NGC6090, which have similar mass values. We note the two tidal tails and the bridge between them, well defined by the nortweastern arm of NGC6090NE.
Finally, observed young starbursts occurring in regions offset from the galactic nuclei to the northwestern spiral arm of NGC6090NE. They inferred that if NGC6090NE had its arms trailing, the molecular gas clouds were just finishing an interaction with the central molecular gas. In § [3.4] we showed that the spiral arms in the north-eastern galaxy are trailing, favoring this theory. Another likely consequence of the trailing arms of NGC6090NE could be the outflow at the northeastern side of NGC6090SW detected by in the UV band (see Figure 1 of their paper), which coincides with a region of high H𝛼 velocity dispersion in NGC6090SW, which could have been formed by ram pressure during the interaction.
7. Conclusions
In this paper we present our observations of the ionized gas emitting at Hα of the isolated pair of galaxies NGC6090 (KPG486) carried out with the scanning Fabry-Perot interferometer, PUMA. This emission was detected solely in the central area of the system. Through our observations we obtained the monochromatic emission (ionized gas emitting at Hα), the continuum, the velocity field and the velocity dispersion maps. The velocity field of NGC6090 shows two regions with ordered isovelocity contour curves from which we computed the rotation curve of each galaxy of the pair.
Using the rotation curves we obtained the maximum rotation velocity, the mass of each galaxy, and the mass of the galaxy system. The sum of the individual masses that we calculated is consistent with the masses found in the literature, obtained with the mass-to-light ratio for different wavelengths. In addition, we obtained the orbital mass of NGC6090, which differs by two orders of magnitude from the sum of the individual masses. We conclude that this difference is due to projection effects.
In addition, enough emission was detected in the northeast galaxy to observe specific characteristics therein. In this galaxy, the isophotes of the continuum show signs of a stellar bar; the velocity field shows no symmetry with respect to the minor axis, which again suggests that this galaxy has a stellar bar. It was also possible to conclude that the arms of the NGC6090NE galaxy rotate in a trailing direction.
We concluded that the photometric centre of the southwest galaxy is in a location different from those reported of radio and infrared wavelengths, which were inconsistent. Furthermore, the maximum of ionized gas emitting at Hα and the maximum of the 2.22 𝜇m coincide, confirming that this knot is part of the galaxy, and therefore cannot be a field star. However, we were not able to study the morphological characteristics of the southwestern galaxy due to the size of the emission area that was detected.
As regards optical wavelength images of NGC6090, the system is similar to the Antennae (NGC4038/39), while also it has been defined as a merger. In this paper we have discussed the kinematic differences between these galaxy systems from observations made at the same wavelength with similar instruments. This allowed us to conclude that their differences are mainly due to the stage of interaction of the galaxies that make up these systems. Through the kinematic analysis of NGC6090 we concluded that these galaxies are in a stage of merger earlier than that of the galaxies in the Antennae.

