


 texto en
  Inglés (pdf)
 Artículo en XML
 Referencias del artículo
 Enviar artículo por email
 Citado por SciELO
  Similares en
SciELO
Similares en
SciELO 
 Permalink
1. Introduction
It is well known that high performance concrete (HPC) has better mechanical and durability properties than conventional concrete (Zhutovsky S. et. al., 2012). In HPC, supplementary cementitious materials (SCM), such as silica fume (SF) are commonly used to achieve a superior performance in terms of mechanical and durability performance (Lothenbach B. et. al., 2011). However, despite these benefits, the presence of silica fume in HPC could adversely originate early age cracking attributed to the hydration process (Pendergrass B. et. Al., 2014).
Calcium nitrite admixtures (CNI) are used as corrosion inhibitors since the 1980´s to extend the service life of reinforced concrete, and are commonly used in HPC for marine constructions (Gaidis J.M., 2004). In the presence of CNI, concrete setting times could be delayed (M.A. Quraishi, et. al., 2016; Hansson C.M. et al., 1998), but in this work we are expecting that the presence of SF could counteract this delay.
Because the fineness of SF, it is well knowknown that in the presence of this SCM, concrete shrinkage will be increased, mainly at early ages. With the inclusion of CNI we are expecting that shrinkage could be further augmented and consequently the a reduction of the potential durability. Therefore, a proposed solution to this issue could be the implementation of internal curing trough a superabsorbent polymer (SAP).
For the positive results it has shown to mitigate early age shrinkage (Snoeck D. et al., 2015), internal curing is known as a feasible technology to diminish the early age cracking of HPC (Craeye B. et al., 2011; Cusson D. et al., 2010). TheseThis technology consists in the introduction of a porous material within the fresh concrete, a highly porous material that could absorb a significant amount of water that will be released within the porous network of concrete as the relative humidity and internal pore pressure decreases. For this purpose, superabsorbent polymers and lightweight aggregates are the most common agents used to implement internal curing (Jensen O. et. Al al., 2001). However, the use of SAP has proved a better performance in terms of water absorption capacity (Mechtcherine V. et. Al al., 2012).
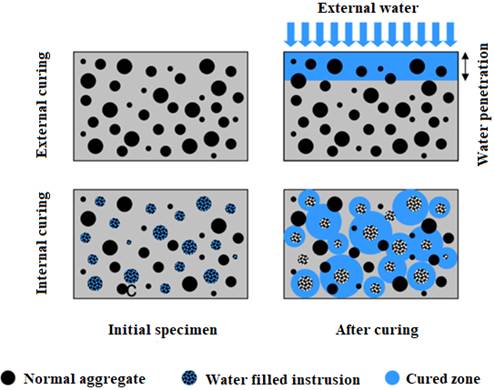
To implement this technology in HPC, the dosage of superabsorbent polymer that should be used could be determined through the modified Powers hydration model (T.C. Powers, et. Al al., 1948; Jensen O. et al., 2000; Jensen O. et al., 2002), a model that is explained by two different hydration systems, an open water-entrained system and a closed system isolated from an external source of water. Figure 1 illustrates the importance of internal curing in HPC, because in this concretes, the higher densification level of the cementitious matrix will prevent external curing to be effective (water penetration) through all the depth of concrete, a condition that could be solved through the implementation of internal curing.
Hence, returning to the concern of the use of CNI and SF in concrete. Because CNI could modify the setting time and hydration rate of a cementitious matrix (M.A. Quraishi, et al., 2016; Hansson C.M. et al., 1998), it is expected that the internal curing method with SAP could decrease these mentioned effects.
Most of the published research work about the effect of CNI in portland cement based concrete, evaluate the effect of this admixture through corrosion electrochemical tests, but leave aside the evaluation of the effect of this admixture regarding setting times and hydration rate (Hansson C.M. et al., 1998). In this project, is expected that the internal curing method with SAP will influence the hydration of the cementitious system and counteract the setting times delay associated to the presence of CNI, therefor it was mainly focused in the evaluation of the synergetic effect of CNI and SAP in fresh and hardened stage properties of an HPC with SF, such as: autogenous shrinkage, drying shrinkage, surface electrical resistivity and the non-steady chloride migration coefficient.
2. Procedure
Materials used for the production of the mortars:
An ASTM C 150 Type V Ordinary Portland cement (OPC), with a Blaine fineness of 363 m2/kg, a specific gravity of 3.1 and a loss on ignition (LOI) of 3.37 %.
An ASTM C 1240 dry condensed silica fume (SF) with a BET specific surface area of 21.63 m2/g, a specific gravity of 2.2, a LOI of 2.63 % and a SiO2 content of 95 %.
An ASTM C 33 crushed limestone aggregate (FA) from Monterrey, Mexico, with a maximum nominal size of 5 mm, a dry specific gravity of 2.61 and a water absorption of 2.2%.
A polyacrylamide-potassium polyacrylate super absorbent polymer (SAP) with an absorption of 25 g/g, a specific gravity of 1.004 and a desorption of 90% in pore solutions extracted from a set of ten cementitious pastes (Type V OPC + SF) with a water-to-binder ratio (w/b) of 0.4 and a silica fume dosage of 9.5 % in substitution of the mass of Portland cement.
A poly-carboxylate based superplasticizer (SP) with a solids content of 51.8%, a specific gravity of 1.1.
A calcium nitrite corrosion inhibitor admixture (CNI) with a solids content of 51.6% and a specific gravity of 1.3.
Mortars were prepared with a w/c of 0.40 and a silica fume addition of 9.5% by mass. The paste proportions were established according to the modified hydration Powers model for Portland Cement-Silica Fume (PC-SF) cementitious systems (T.C. Powers, et. Al., 1948; Jensen O. et al., 2000; Jensen O. et al., 2002), that analytically evaluate the hydration degree (α) for the same cementitious matrix exposed to an external open curing system or to an internal closed system isolated from the external curing water. For this project, the system was closed isolated with and without internal curing (see figure 2). The diagram in figure 2 present the volumetric phase distribution in a cementitious paste: capillary water, gel water (pw) gel solid (bw), and chemical shrinkage (CS). The CS and bw were calculated by the Test ASTM C 1608 and thermogravimetric analysis (TGA) correspondingly. The gel water amount was considered 0.19 g/g for cement and 0.5 g/g for silica fume (Sellevold E. J. et al., 1998).
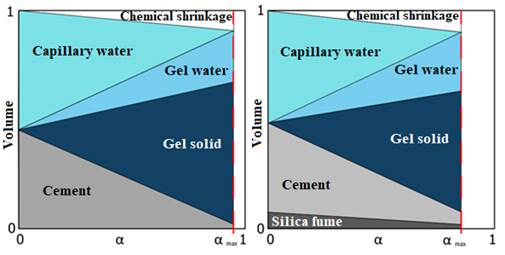
Figure 2 Volumetric phase distribution and hydration level in a cementitious paste with w/c of 0.4, without SF (left) and with SF (right), illustrated according to the Powers’ model. In the figure it is observed how the volumetric phase distribution change with the hydration degree (α), in the presence of a SCM.
Equation 1 was used to calculate bw:
Where:
M 1000 °C is the mass of the sample at 1000 °C in grams
M 105 °C is the mass of the sample at 105 °C in grams
M CO2 is the mass loss due to decarbonation of the CaCO3, usually between 650-800 ºC.
LOIcem is the loss of ignition of the cement
The required amount of internal curing water (ICw) to mitigate autogenous shrinkage in a Portland cement-silica fume cementitious paste with a w/c ratio of 0.40 was calculated according to equations 2 and 3:
Where:
Cem is the amount of cement in kg/m3
w/c is the water/cement ratio of the paste
s/c the microsilica /cement ratio
ICw is the amount of internal curing water in kg/m3
ICs is the amount of SAP in kg/m3
abs is the absorption of SAP in grams
des is the desorption of SAP in grams
The dosage of CNI was 2% respect to the mass of the cementitious materials. A target consistency (spread) of 24 ± 1 cm was established for the whole set of mortar mixtures, and it was measured in the ASTM C 230 flow table, according to the procedure described in ASTM C 1437, but without the drops specified in the standard procedure. To maintain constant the water-to-cement ratio, the amount of water in the admixtures was considered as part of the reaction water. Mixtures were prepared in an epicyclical type mixer that meets the requirements of ASTM C 305, through the following mixing procedure:
Materials were added to the mixer in the following order: fine aggregates, cement, silica fume, SAP and water. The mixing procedure begins 30 seconds after. For mixtures without SAP, mixing started immediately after the addition of water.
Then, materials were mixed at low speed for 4 minutes.
In this step, for mixture CNI, this admixture was dosed three minutes after mixing started (without turning off the mixer) and mixing continued for one additional minute at low speed.
After SP was dosed, mixing continued for one additional minute at low speed.
After an accumulated mixing time of 5 minutes, the mixer was turned off for 30 seconds to scrap the sides and bottom of the bowl with a trowel.
Then, the mixing process continued for three minutes at high speed.
For mixture SAP + CNI, CNI was dosed at the beginning of this step (5.5 minutes after mixing started).
For the whole set of mortars, the fresh stage properties characterization consisted on the determination of the consistency (spread) according to ASTM C 1437, but without any drop of the flow table; the air content and unit weight were determined according to ASTM C 85. Autogenous shrinkage was evaluated according to ASTM C 1698, after the final setting time of the concrete but in the mortar fraction of the material determined according ASTM C 403, and up to an age of 28 days. Measurements of the lineal autogenous strain was made by triplicate trough a flexible corrugated mold and a dilatometer.
The four mixtures evaluated in this work are identified according to the nomenclature that appears in table 1, and the proportions for all these mixtures, with the aggregated in dry condition are reported in table 2.
Table 1 Mixture identifications (ID)
| ID | Materials |
|---|---|
| REF | PC + SF |
| SAP | PC + SF + SAP |
| CNI | PC + SF + CNI |
| SAP+CNI | PC + SF + SAP + CNI |
Table 2 Mixture proportions in kg/m3, FA in dry condition
| Mixture | OPC | SF | Water | ICw | SP | FA | SAP | CNI |
|---|---|---|---|---|---|---|---|---|
| REF | 485.1 | 46.1 | 225.7 | ---- | 3.2 | 1513.8 | ---- | ---- |
| SAP | 481.7 | 45.8 | 224.1 | 32.5 | 3.2 | 1414.3 | 1.4 | ---- |
| CNI | 485.8 | 46.1 | 220.9 | ---- | 3.2 | 1506.7 | ---- | 10.7 |
| SAP+CNI | 481.3 | 45.7 | 217.0 | 32.5 | 3.2 | 1404.3 | 1.4 | 10.6 |
At the end of the mixing process, prismatic specimens with dimensions of 50 x 50 x 250 mm, were casted for the determination of the drying shrinkage, according to ASTM C 596 (four samples were casted for each mixture); cylindrical specimens with dimensions of 10 cm in diameter by 20 cm in height, were casted to perform the surface electrical resistivity tests (SER) according to AASHTO TP 95, with a device that operates according to the Four-Point Wenner Array Probe Test (AASHTO TP 95, 2011), as well as the non-steady chloride migration coefficient according to NT Build 492). The results of these two methods present good correlations and are commonly reported as durability indexes of concrete and as an indicator of the cement paste quality (T.C. Powers, et. Al., 1948). Specimens were demolded at 24 hours and placed in a curing room that meets the required controlled conditions established by ASTM C 31 (23°C ± 2°C and RH ≥ 95%).
3. Results and discussion
3.1 Hydration parameters
For OPC and SF, the hydration parameters were obtained from the Powers Model (T.C. Powers, et al., 1948; Jensen O. et al., 2000; Jensen O. et al., 2002) trough TGA (including the determination of the amount of calcium hydroxide, CH) and CS measurements, and were calculated according to equation 1-3. The results were used to calculate the internal curing water and the amount of SAP to be dosed and are summarized in in Table 3.
Table 3 Hydration parameters of the cementitious materials from TGA and CS measurements
| Cementitious | bw (g/g) | pw (g/g) | CS (ml/100g) | CH g/g | (α) |
|---|---|---|---|---|---|
| OPC | 0.23 | 0.19 | 6.03 | 0.16 | 1 |
| SF | 0 | 0.5 | 19.66 | 1.7 | ------ |
Through equations 1-3 and the values reported for the hydration parameters in Table 3, theoretically indicate that in a closed system the cementitious paste (OPC and SF) will reach a α of 1 if the final w/c ratio is 0.47. In our experimental work, the cementitious paste was set to have a w/c ratio of 0.40 and an s/c of 0.095, therefore in order to reach a w/c of 0.47; the amount of internal curing water to add in terms of w/c ratio should be 0.07. The required mass of water for internal curing (ICw), and the required dosage of SAP to implement internal curing within the mortar, are reported in table 4.
Table 4 Parameters to calculate the amounts of ICw and SAP to implement internal curing in a closed water system.
| w/cclosed | w/c | X | s/c | ICw (kg/m3) | SAP (kg/m3) |
|---|---|---|---|---|---|
| 0.47 | 0.40 | 0.07 | 0.095 | 33.8 | 1.5 |
3.2 Fresh stage properties
The fresh stage properties are presented in table 5. All the mixtures achieved the target spread of 24 ± 1 cm. The results of air content and unit weight exhibit that the substitution of sand by SAP increased the air content and subsequently decreased the unit weight. For mixtures CNI and CNI+SAP, the fresh stage properties were similar to the reference mixture.
Table 5 Fresh stage properties of mortars
| Mixture | Spread (cm) | Air content (%) | Unit weight (kg/m3) |
|---|---|---|---|
| REF | 24 | 1.4 | 2359 |
| SAP | 24 | 2.1 | 2283 |
| CNI | 24 | 1.3 | 2358 |
| CNI+SAP | 23 | 2.4 | 2295 |
Table 6 Setting times
| Mixture | Initial (min) | Final (min) |
|---|---|---|
| REF | 220 | 285 |
| SAP | 297 | 383 |
| CNI | 195 | 245 |
| SAP+CNI | 248 | 307 |
Because it is known that CNI could have an influence on the setting times (Hansson C.M. et al., 1998) and that SAP could also decrease setting times, the determination of this property was included in the experimental program of this work. The results of setting times reported in Table 6 indicate that alone, the dosages of CNI accelerate the initial and final setting times by 25 and 40 minutes, and that SAP delay these setting times by 1h:17m and 1h:38m respectively. In mixture SAP+CNI, the combined effect leads to a negligible delay in the initial and final setting times, of 28 and 22 minutes respectively. The acceleration or delay in setting times originated by CNI, SAP and SAP+CNI are negligible and do not represent any problem for practical applications.
3.3 Autogenous and drying shrinkage.
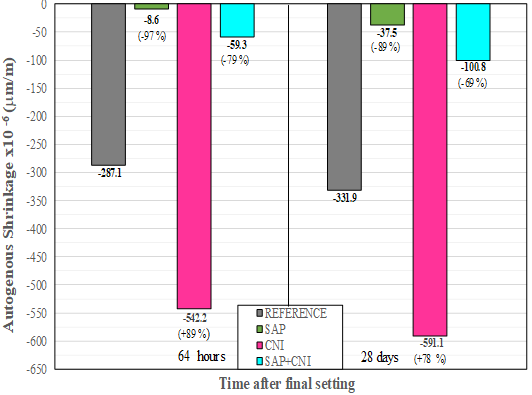
The results of autogenous shrinkage (AS) presented in Figure 3 at ages of 64 hours and 28 days exhibit the great benefit of SAP to counteract AS by 97% and 89% respectively. The presence of CNI significantly increases AS by 89% and 78% respectively, but in combination with SAP this undesired performance was opposite counteracting the volumetric instability and leading to AS reductions of 79% and 69% respectively.
For Reference, SAP and CNI mixtures, the results of drying shrinkage (DS) reported in Figure 4, at an age of 70 days (595, 620 and 645 µm respectively), clearly illustrate that SAP and CNI do not have a mayor effect in this property, however, by combining the two admixtures, DS increases to 765 µm, representing a minor increase of 145 µm in comparison to the average DS of the other three mixtures (620 µm).

3.4 Surface electrical resistivity (SER) and chloride migration coefficient (Dnssm)
The results reported in Figure 5, indicate that for all the ages reported in this figure, CNI slightly improved SER within a range of 10% to 13%. According to the qualitative classification reported in the standard test method for this tests AASHTO TP 95, the results for reference and CNI mixtures present a very low chloride Ion Permeability Potential. At 28 days, the presence of SAP originates a reduction of 36%, suggesting that the chloride ion permeability potential was affected and passes from very low to low, however at 70 and 114 days the reductions remains almost the same (38% and 32%), also that at this two ages the concrete recovers the very low chloride ion permeability potential. Mixture SAP + CNI presented a similar trend with reductions of 31%, 32% and 37% at the ages of 28, 70 and 114 days respectively.
Surface electrical resistivity is an indirect measure of both porosity and diffusivity. The electrical current flowing through the hydrated paste is due to an electrolytic process mainly resulting from the flow of ions present in the pore solution (K. O. Ampadu, et al., 1999) on the other hand, when the concentration of ionic species such as sodium and potassium decreases, this will lead to a decrease in ionic conductivity and therefore to an increase of the electrical resistivity (C. Shi, 2004). It seems that the increase of SER, originated by the presence of CNI, is the result of the decrease in the flow of electric current because of the probable decrease in ionic conductivity in the pore solution.
Among others, factors that affect SER results are porosity, water content, the presence of supplementary cementitious materials and the w/c ratio. For mixtures with CNI it is also important to highlight that this technique could provide slightly underestimated results (AASHTO TP 95, 2011).
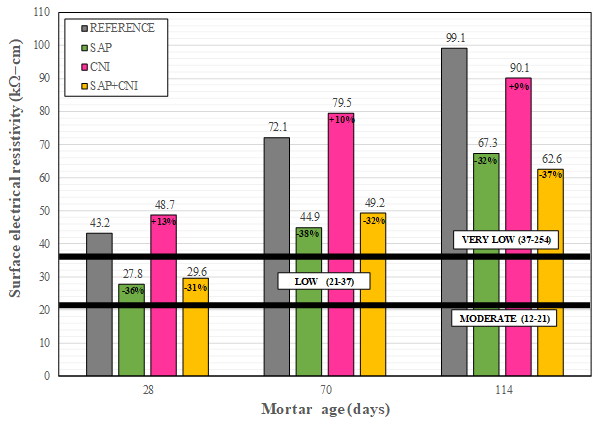
Figure 5 Development of surface electrical resistivity up to an age of 114 days, indication the three levels for the potential permeability of chloride ions according to AASHTO TP 95
Results in Table 7 indicate that the three technologies (SAP, CNI and SAP+CNI) increased Dnssm by 38, 30 and 122%. Even though, these increments could be perceived as very high, the qualitative classification established for this test method (Nilsson L., et al., 1998) indicate that for HPC with these technologies, the potential resistance to the ingress of chlorides is extremely high (Dnssm < 2.5x10⁻²m2/s) for mixtures SAP and CNI, and very high (Dnssm = 2.2 - 5.0x10⁻¹²m2/s) for mixture SAP+CNI. The coefficients of variation reported in table 7 are included as a reference of the uncertainty that could be expected for measurements made by triplicate.
Analysing the absolute differences for setting times, SER and Dnssm, we can observe that mixtures with SAP presented the higher values. This behaviour is attributed mainly to the increase in the water/cementitious ratio that could result during the very early ages, because it is considered that SAP does not effectively retain all calculated internal curing water, liberating part of it in a period comprised between the time when the specimens were casted and the time when the concrete reach its final setting time. Even though this slight adverse effect of SAP results, SER and Dnssm indicates that in terms of durability (cualitative) the effect is negligible.
Table 7 Chloride Migration Coefficient (Dnssm) at 114 days
| Mixture | Dnssm (x 10-12 m2/s) | Coefficient of variation (%) |
|---|---|---|
| REF | 1.46 | 4.44 |
| SAP | 2.01 | 7.04 |
| CNI | 1.90 | 5.03 |
| SAP+CNI | 3.25 | 9.14 |
If the SAP voids are empty, ions have to travel a slightly longer route to pass the void, but if SAP voids are full with liquid, they may provide an expressway without obstacles for ion transport. However, the liquid in the void may be wholly or partly held within a swelled SAP particle and the transport properties in a swelled SAP particle are not known (Marianne T. H. et al., 2015). This statement could be the reason of the higher coefficients (Dnssm) obtained for the mixtures with SAP.
4. Summary and conclusions
Based in the analysis of the results obtained for the mortars evaluated in this work, the following conclusions can be drawn:
Results of surface electrical resistivity indicate that SAP has the most detrimental effect in terms of durability. Although, sooner or later, mixtures will be classified with a very low probability for the penetration of chloride ions (37-251 kΩ-cm), SER results exhibit that the detrimental effect will delay the time when these mixtures reach this level of impermeability; 30 and 50 days after reference mixture respectively. CNI also induced a delay of 15 days.
Even though the differences in absolute values, SAP and CNI did not affect the qualitative impermeability, presenting an extremely high probability to resist the ingress of chlorides (Dnssm < 2.5x10⁻²m2/s). The combination of SAP and CNI slightly affected the impermeability of the materials, presenting a very high probability to resist the ingress of chloride (Dnssm = 2.5 to 5 x10-12 m2/s).
The qualitative evaluation criteria for SER and CNI results indicate that in terms of durability the incorporation of SAP and/or CNI to an HPC with silica fume and a water/binder ratio of 0.40, don’t reduce the durability of concrete.
The detrimental effect of SAP exhibited by the results of setting times, surface electrical resistivity and chloride migration coefficient are attributed to an increase of the water/binder ratio by an unquantified amount of internal curing water added during the hydration process between the time when specimens were casted and the final setting times.

