


 (pdf)
(pdf)


 SciELO
  SciELO
 Permalink
Introduction
The mice in the genus Baiomys belong to the cricetid tribe Baiomyini (Pardiñas et al. 2017) and includes some of the smallest North American rodents in the subfamily Neotominae, commonly known as pygmy mice (Packard 1960). Baiomys comprises two extant species: the northern pygmy mouse (B. taylori) and the southern pygmy mouse (B. musculus; Packard 1960; Pardiñas et al. 2017). The southern pygmy mouse primarily inhabits arid and semiarid lowlands (Packard and Montgomery 1978), from southern Nayarit and central Veracruz in México to northwestern Nicaragua, excluding the Yucatán Peninsula and the Caribbean tropical lowlands (Packard and Montgomery 1978; Pardiñas et al. 2017). This distribution overlaps with B. taylori in the west-central Mexican states of Colima, Jalisco, Michoacán, and Nayarit (Pardiñas et al. 2017). In this sympatric area, B. musculus and B. taylori are more strongly morphologically differentiated from each other than are other allopatric populations of each species (Packard 1960).
Baiomys musculus originally was described as Sitomys musculus (Merriam, 1892), and later the subgenus Baiomys was defined based on morphological differences (True 1894). Baiomys was recognized as an independent genus by Mearns (1907), who also was the first to use the binomial Baiomys musculus. Two years later, Baiomys was considered a subgenus of Peromyscus (Osgood 1909), but Miller (1912) subsequently re-recognized it as an independent genus. Currently, eight subspecies are recognized within B. musculus: B. m. musculus (Merriam, 1892; type specimen from Colima, México); B. m. brunneus (Allen and Chapman, 1897; type specimen from Veracruz, México); B. m. nigrescens (Osgood, 1904; type specimen from Chiapas, México); B. m. grisescensGoldman, 1932 (type specimen from Tegucigalpa, Honduras); B. m. infernatisHooper, 1952 (type specimen from Oaxaca, México); B. m. pallidusRussell, 1952 (type specimen from Morelos, México); B. m. handleyiPackard, 1958 (type specimen from El Quiche, Guatemala); and B. m. pullus Packard, 1958 (type specimen from Esteli, Nicaragua; Figure 1).
Baiomys musculus mice have been studied from different perspectives, including assessment of morphometry (Osgood 1909; Hooper 1952; Packard 1960), karyotypes (Lee and Elder 1977), allozymes (Calhoun et al. 1989), demographic features and habitat preferences (García-Estrada et al. 2002; Schnell et al. 2008), geometric morphometrics (Abuzeineh 2006), singing behavior (Miller and Engstrom 2007), intra-specific niche modeling (Martínez-Gordillo et al. 2010), landscape genetics (Vargas et al. 2012), and ecotoxicology (Galván-Ramírez 2020). With respect to taxonomic relationships, analysis of the mitochondrial gene cytochrome b (CytB), detected two clades within B. musculus, one located in the Mexican states of Jalisco and Michoacán, and the other in Chiapas, Guerrero, Oaxaca, and Puebla (Amman and Bradley 2004). The genetic divergence between these two clades (genetic p-distance = 6.46 %) suggests that both units may be eligible for species status (Amman and Bradley 2004), however, the eight subspecies are still recognized (Pardiñas et al. 2017).
Our objective was to revisit the taxonomic status of these two monophyletic groups within B. musculus using additional genetic and morphological data. New CytB sequences were obtained from GenBank and others were generated herein, including individuals from the previously unanalyzed states of Colima, Morelos, and Veracruz, and the previously unsampled subspecies B. m. brunneus. The mitochondrial CytB gene was chosen because of its availability and its proven utility to clarify phylogenetic relationships in other Neotominae rodents (Edwards and Bradley 2002; Arellano et al. 2005; Bradley et al. 2007; Rogers et al. 2007; Vallejo and González-Cózatl 2012). Although more than 1,700 specimens of B. musculus have been analyzed in previous morphological studies (Osgood 1909; Hooper 1952; Packard 1960), and it was validated that differences in size and coloration among the eight subspecies exist, none of these morphological studies specifically attempted to detect morphometric evidence to confirm or reject the hypothesis of two genetic clades (Amman and Bradley 2004).
Materials and Methods
DNA sequence data. Mitochondrial sequences of the complete CytB gene (1,143 base pairs) were obtained from five specimens (four B. musculus and one B. taylori) housed in the mammal collection of the Museo de Zoología, Facultad de Ciencias, Universidad Nacional Autónoma de México, Ciudad de México, México (MZFC). A Qiagen DNEasy Blood & Tissue kit (Qiagen, Germantown, Maryland) was used to extract whole genomic DNA following the manufacturer’s recommended protocols. Polymerase chain reaction (PCR) was used to amplify this gene using the primers MVZ05 (Smith and Patton 1993) and H15915 (Irwin et al. 1991). Each PCR had a final reaction volume of 13 μL and contained 6.25 μL of GoTaq Green Master Mix (Promega, Madison, WI, U.S.A.), 4.75 μL of H20, 0.5 μL of each primer (10μM), and 1 μL of DNA stock. The PCR thermal profile included 2 minutes of initial denaturation at 95 °C, followed by 38 cycles of 30 seconds of denaturation at 95 °C, 30 seconds of annealing at 50 °C, and 68 seconds for extension at 72 °C. We included a 5-minute final extension step at 72 °C. PCR products (3 μL) were visualized using electrophoresis in 1 % agarose gels stained with SYBR Safe DNA Gel Stain (Life Technologies, Carlsbad, CA, U.S.A.). Each PCR product was purified with 1 μL of a 20% dilution of ExoSAP-IT (GE Healthcare Bio-Sciences Corp. Piscataway, NJ, U.S.A.), then incubated for 30 minutes at 37 °C followed by 15 minutes at 80 °C. Samples were cycle-sequenced using 6.1 μL of H20, 1.5 μL of 5x buffer, 1 μL of 10μM primer, 0.4 μL of ABI PRISM Big Dye v. 3.1 (Applied Biosystems, Foster City, CA, U.S.A.), and 1 μL of the purified template. The cycle-sequencing profile included 1 minute of initial denaturation at 96 °C, followed by 25 cycles of 10 seconds for denaturation at 96 °C, 5 seconds for annealing at 50 °C, and 4 minutes for extension at 60 °C. Cycle sequencing products were purified using an EtOH-EDTA precipitation protocol and were read with an ABI 3130xl genetic analyzer (Applied Biosystems, Foster City, CA, U.S.A.). DNA sequences were edited, aligned, and visually inspected using Mega X (Kumar et al. 2018) and FinchTV 1.4 (Patterson et al. 2004). Nineteen additional CytB sequences of B. musculus were recovered from GenBank (Amman and Bradley 2004; Miller and Engstrom 2008; Light et al. 2016), so in total we analyzed 23 individuals of B. musculus (representating five subspecies: B. m. brunneus, B. m. infernatis, B. m. musculus, B. m. nigriscens, and B. m. pallidus; Figure 1) and one B. taylori individual was used as the outgroup (Appendix I). With this new sampling, we almost doubled the genetic samples analyzed by Amman and Bradley (2004), including samples from new localities, states, and subspecies previously not analyzed (Figure 1).
Maximum likelihood (ML) and Bayesian inference (BI) were used to estimate phylogenetic relationships of B. musculus. Prior to phylogenetic analyses, the best model and partition scheme (maximally divided by codon position) among all available models in MrBayes 3.2 (Ronquist et al. 2012) was selected based on the Bayesian Information Criterion (BIC) in PartitionFinder 2 (Lanfear et al. 2016). The IQ-TREE 1.6.12 (Nguyen et al. 2015) was used to estimate the ML gene tree, with branch support estimated by 1,000 replicates of nonparametric bootstrap. In MrBayes 3.2, three hot chains and one cold chain were used in two independent runs of 10 million generations, sampling data every 1,000 iterations. Convergence of MCMC results was determined by examining trace plots and sample sizes in Tracer 1.7 (Rambaut et al. 2018). The final topology was obtained using a majority rule consensus tree and considering a burn-in of 25 % (with effective sample sizes > 200). To evaluate levels of genetic differentiation, p-distances were estimated in Mega X using the pairwise deletion option and the Kimura 2-parameter model (Kimura 1980). These setting were chosen to facilitate comparison with previous works (Bradley and Baker 2001; Baker and Bradley 2006).
Morphological analyses. Following the removal of sub-adult and damaged specimens, morphometric variation was analyzed in 47 specimens of B. musculus from three subspecies (B. m. brunneus, B. m. musculus, B. m. pallidus; Figure 1; Appendix II). Twelve cranial measurements as defined by Ávila-Valle et al. (2012) and Hurtado and Pacheco (2017) were obtained using a digital caliper (0.01 mm resolution) as follows: condyle-incisive length (CIL), braincase depth (BCD), braincase breadth (BCB), zygomatic breadth (ZB), interorbital constriction (IOC), rostral breadth (BR), maxillary toothrow length (MTL), breadth across M3-M3 (BMM), breadth of M1 (BM1), length of auditory bulla (LAB), dentary greatest length (DGL), and dentary height (DH). Age classes were assigned to the specimens following tooth eruption and wear patterns, and we only analyzed adult specimens. To determine if the molecular results were congruent with the morphological data, we specifically tested for morphological differences between the clades detected in the molecular analyses. Because we were interested in recognizing measurements useful to detect groups within B. musuculus, and sexual size dimorphism has not been supported in this species (Packard 1960; Abuzeineh 2006), females and males were analyzed together.
All univariate analyses and summary statistics were performed in R 3.6.2 (R Core Team 2014). QQ-plots and the Shapiro-Wilk test were used to analyze the normality of the data in each group (clades I and II) and the Levene test from the car 3.0-6 package (Fox and Weisberg 2019) to test for homogeneity of variances between groups. All variables fulfilled the normality assumption, and all variables except for IOC and MTL fulfilled the assumption of homogeneity of variance. A Student’s t-test was used to determine whether the two clades differed in each of the morphological measurements, using the Welch approximation to degrees of freedom to account for the heteroscedasticity for IOC and MTL (using var.equal = FALSE in the t.test function of R). A significance threshold (α) of 0.05 was implemented. Boxplots were plotted in ggplot2 (Wickham 2011) to better visualize the results.
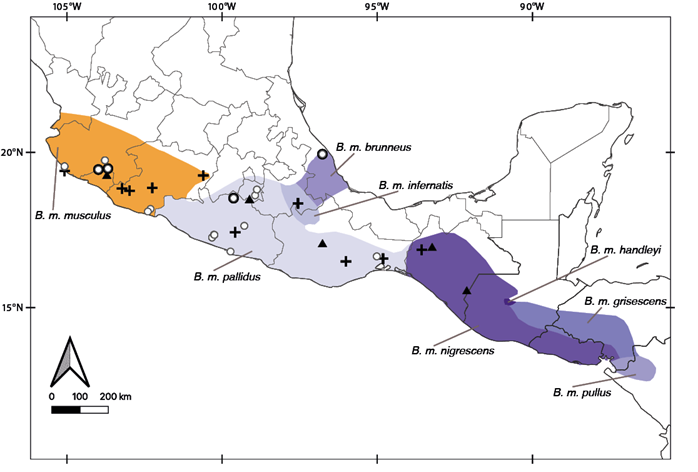
Figure 1 Geographic ranges of the eight recognized subspecies of Baiomys musculus, and specimens analyzed in this study. Individuals with cytochrome b sequences are represented by black crosses (sequences from Amman and Bradley 2004), black triangles (sequences from Miller and Engstrom 2008; Light et al. 2016), and black dots (this study). White dots represent individuals with morphological data (this study).
Results
DNA sequence data. The final alignment included 207 variable characters, 92 singleton sites, and 115 parsimony informative characters. The best evolutionary model schemes were K80+I, F81+I, and GTR+G applied to the first, second, and third codon positions, respectively. Topologies from ML and BI trees were almost identical, but nodal support values were higher in BI (Figure 2). As previously reported, two well-supported clades were recovered within B. musculus (Amman and Bradley 2004). These clades were geographically structured, with clade I including samples from western México (Colima, Jalisco and Michoacán), and clade II including the rest of the samples. Clade II contained two sub-clades, one from central México (Guerrero, Morelos, and Puebla; clade II.a), and the other from eastern México (Chiapas, Oaxaca, and Veracruz; clade II.b). The K2P genetic distances between B. taylori and the two clades within B. musculus were > 11 %, the distance between clades I and II was 6.69 %, and between clades II.a and II.b was 3.98 %.
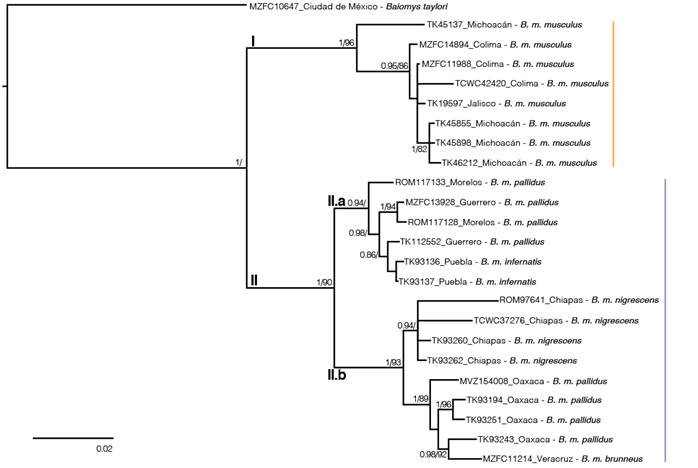
Figure 2 Majority rule consensus tree for Baiomys musculus, obtained from the Bayesian analysis of the mitochondrial cytochrome b sequences. Support values are shown as posterior probabilities followed by bootstrap values from a maximum likelihood analysis. Support values < 0.8/80 are not shown. Tip labels show the catalog number, the Mexican state of each sample and the taxa of each tip. Clade I is in orange and clade II in purple.
Morphological analyses. Based on molecular results, individuals were assigned to two a priori groups: clade I (Colima, Jalisco, and Michoacán; n = 26, 1 of them sequenced) and clade II (Guerrero, Morelos, Oaxaca, and Veracruz; n = 21, 2 of them sequenced; Appendix 2). Although some measurements overlapped between clades, individuals from clade I had significantly larger measurements than clade II in nine morphometric variables (Figure 3 and Table 1; all of the morphometric variables measured, except for BR, BMM, and LAB).
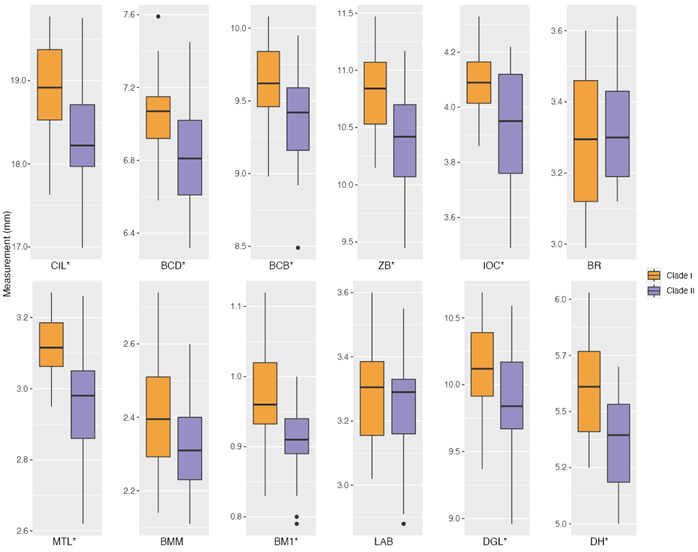
Figure 3 Boxplots summarizing the cranial and mandibular measurements of Baiomys musculus. Each plot represents a morphometric variable: condyle-incisive length (CIL), braincase depth (BCD), braincase breadth (BCB), zygomatic breadth (ZB), interorbital constriction (IOC), rostral breadth (BR), maxillary toothrow length (MTL), breadth across M3-M3 (BMM), breadth of M1 (BM1), length of auditory bulla (LAB), dentary greatest length (DGL), and dentary height (DH). P-values that were significant different (< 0.05) between clades are shown with an asterisk. Horizontal lines represent medians, boxes span the interval between the 25th and 75th percentiles, and the range of the vertical lines show the minimum and maximum values for each variable. Black dots show measurements that are farther from the mean than 1.5 times the interquartile range.
Table 1 Summary statistics and test statistics of morphological variables measured in B. musculus (condyle-incisive length, CIL; braincase depth, BCD; braincase breadth, BCB; zygomatic breadth, ZB; interorbital constriction, IOC; rostral breadth, BR; maxillary toothrow length, MTL; breadth across M3-M3, BMM; breadth of M1, BM1; length of auditory bulla, LAB; dentary greatest length, DGL; and dentary height, DH). Mean and standard deviation (sd) are shown for each clade, followed by the Student’s t statistic (t), degrees of freedom (df; estimated using the Welch approximation for IOC and MTL to account for heteroscedasticity), and the P-value (P). P-values that were significant (< 0.05) are shown in bold type.
| Clade I | Clade II | ||||||
|---|---|---|---|---|---|---|---|
| Mean | sd | Mean | sd | t | df | P | |
| CIL | 18.90 | 0.576 | 18.30 | 0.687 | 3.20 | 44.0 | 0.003 |
| BCD | 7.05 | 0.229 | 6.83 | 0.293 | 2.84 | 45.0 | 0.007 |
| BCB | 9.65 | 0.265 | 9.36 | 0.344 | 3.20 | 44.0 | 0.003 |
| ZB | 10.80 | 0.361 | 10.40 | 0.480 | 3.32 | 44.0 | 0.002 |
| IOC | 4.09 | 0.116 | 3.95 | 0.219 | 2.76 | 28.9 | 0.010 |
| BR | 3.30 | 0.185 | 3.32 | 0.163 | -0.35 | 45.0 | 0.729 |
| MTL | 3.12 | 0.088 | 2.97 | 0.155 | 3.92 | 30.2 | < 0.001 |
| BMM | 2.40 | 0.152 | 2.32 | 0.128 | 1.86 | 45.0 | 0.070 |
| BM1 | 0.98 | 0.072 | 0.91 | 0.056 | 3.84 | 45.0 | < 0.001 |
| LAB | 3.28 | 0.169 | 3.23 | 0.175 | 0.92 | 45.0 | 0.365 |
| DGL | 10.10 | 0.358 | 9.85 | 0.445 | 2.25 | 42.0 | 0.030 |
| DH | 5.60 | 0.226 | 5.37 | 0.217 | 3.33 | 40.0 | 0.002 |
Discussion
The two mitochondrial lineages within B. musculus previously detected by Amman and Bradley (2004; Figure 2) were recovered, because their clade C is equivalent to our clade I. In addition, the K2P genetic distance between clades I and II was similar to those observed in other recognized sister species in Neotominae, such as in the genus Megadontomys (Vallejo and González-Cózatl 2012), Neotoma (Hernández-Canchola et al. 2021), Peromyscus (Bradley et al. 2007), among others (Bradley and Baker 2001; Baker and Bradley 2006). These two clades seem to be allopatric, but more thorough sampling is needed to determine if there is a distinct boundary between them. The complex topography between the Sierra Madre del Sur and the Transmexican Volcanic Belt, in addition to the mouth of the Balsas River, could be acting as geographic barriers to gene flow between clades in the southern pygmy mouse (Amman and Bradley 2004; Figure 4), and this limit aligns well with boundaries between other cryptic sister mammal taxa such as the mouse opossums (Arcangeli et al. 2018) and the Osgood’s deermice (Ruiz-Vega et al. 2018). Additionally, multiple diversification events in western México generated many Mexican endemic mammal species, including other neotomine rodents (Osgoodomys banderanus, Xenomys nelsoni, Hodomys alleni, and Peromyscus perfulvus), in addition to the pygmy spotted skunk (Spilogale pygmaea), two species of mouse opossums (Tlacuatzin), the Mexican shrew (Megasorex gigas), and the banana bat (Musonycteris harrisoni), among others (Ceballos 2014; Arcangeli et al. 2018). This evidence suggests that the evolutionary history of clades I and II within B. musculus could have been influenced by the complex topography of western México, as in many other mammal taxa.
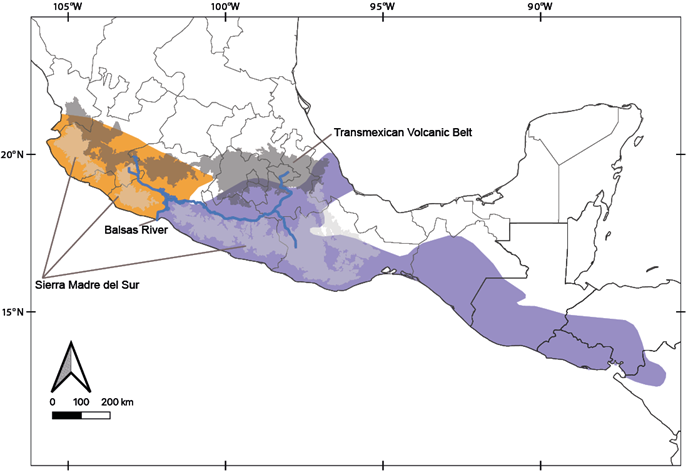
Figure 4 Revisited geographic ranges in the southern pigmy mice. Map colors show the preliminary suggested geographic ranges within Baiomys musculus of clade I (orange) and B. brunneus clade II (purple). The main biogeographic barriers discussed in this work also are shown.
Baiomys musculus from clade I are distributed in Colima, Jalisco, and Michoacán, and specimens from these Mexican states were the largest individuals examined. Although the sample size was relatively small, our results are consistent with previous morphological evaluations that analyzed larger numbers of specimens from Guatemala and México (n = 299, Osgood 1909), México (n = 351, Hooper 1952), and from El Salvador, Guatemala, Honduras, México, and Nicaragua (n = 1,748; Packard 1960). In these previous morphological reviews, individuals from western México (Nayarit, Jalisco, Colima, and Michoacán) were larger in external and cranial dimensions than other Mexican and Central American specimens. This morphological differentiation of the populations from western México has been recognized for many years, as evidenced by their recognition as the subspecies B. m. musculus (Osgood 1909; Hooper 1952; Packard 1960; Figure 1).
Packard (1960) also noted increasing size in B. musculus from south to north. This general trend follows Bergmann’s rule. However, B. m. musculus is the most distinct subspecies of the southern pygmy mouse, and it was proposed that its difference could be related to character displacement (Packard 1960) that could magnify the Bergmann’s rule, because in western México B. musculus and B. taylori are sympatric and they are more morphologically distinct than where they are allopatric (Hooper 1952; Packard 1960). Analyses of cranial geometric morphometrics rejected the character displacement hypothesis between B. musculus and B. taylori (Abuzeineh 2006), but this proposal has not been tested in postcranial structures, or with other methodologies, and deserves attention to understand the processes that originated sympatric populations of B. musculus clade I / B. taylori, and the allopatric populations of B. musculus clade II / B. taylori. Martínez-Gordillo et al. (2010) tested whether clades I and II had different ecological niches, and although clade I inhabits warmer and drier environments than clade II, the ecological models showed nesting of the niches of the two clades (ecological niche modeling of clade I recovered most of the distribution of clade II, and vice-versa). Interestingly, B. taylori, which inhabits from the United States of America to central México, also has two detected clades with a lower genetic divergence than B. musculus (2.82 %; Amman and Bradley 2004), but the ecological niches were different between the two (Martínez-Gordillo et al. 2010). These contrasting genetic and environmental results between the northern and southern pygmy mice could suggest that different evolutionary processes are acting in each taxon within Baiomys.
In addition to the high levels of mitochondrial divergence (Amman and Bradley 2004) and morphological differences (external size, coat color, and certain cranial measurements; see Packard 1960 for more details) between B. m. musculus and the remaining subspecies, a substantial subdivision between B. musculus samples from Jalisco and Colima (n = 9) versus Chiapas, Oaxaca, and Veracruz (n = 11) was reported using allozymes (Calhoun et al. 1989). In the present work, more than using our limited sampling to draw conclusions about the taxonomic status of B. m. musculus (Figures 2, 3, Table 1), we aim to integrate the multiple and impressive reviews that have analyzed the variation within B. musculus (Osgood 1909; Hooper 1952; Packard 1960; Calhoun et al. 1989; Amman and Bradley 2004).
Considering all of these data, collected independently over more than a century, it appears that clade I, the Mexican endemic pygmy mice that inhabits in Colima, Jalisco, Michoacán, and Nayarit, could be named as B. musculus (Merriam 1892), and that all other populations of the southern pygmy mouse (including the brunneus, grisescens, handleyi, infernatis, nigrescens, pallidus, and pullus populations) seem to merit specific status and, following taxonomic priority, could be referred to as B. brunneus (Allen and Chapman, 1897). However, studies of additional data sets, such as nuclear / genomic data or Central American populations, will be required to definitively confirm the taxonomic status of these specimens. The substructure detected within clade II (Figure 2) also deserves additional attention: clade II.a appears to be restricted to the Balsas Basin and clade II.b to southeastern México. This phylogeographic pattern also has been reported in other mammal species, such as the Mesoamerican yellow-shouldered bat (Hernández-Canchola and León-Paniagua 2017) and the nine-banded armadillo (Arteaga et al. 2012) and this genetic differentiation does not agree with the geographic boundaries between subspecies of B. musculus (Figures 1, 2), so future studies will be needed to verify their validity. Basic aspects of the neotomine rodents, such as the number of species that inhabit North and Central America, are still not clear (Miller and Engstrom 2008; Platt et al. 2015; Sullivan et al. 2017). This knowledge gap will likely continue to exist in taxa that are rare and/or have restricted distributions (Gardner and Carleton 2009; Fernández 2014), unless the use of Next Generation Sequencing methods allow DNA data to be obtained from ancient specimens hosted in mammal collections (Castañeda-Rico et al. 2020). However, in more common and abundant species, as B. musculus, it will be easier to obtain and analyze data to solve these taxonomic uncertainties, which will allow us to understand the processes that generate and maintain biodiversity (Upham et al. 2019).

