INTRODUCTION
On July 28, 2012, at the distance of 121.33 AU, and after traveling for 35 years, Voyager 1 crossed the heliopause, the boundary of our solar system, and entered the interstellar space (Burlaga & Ness 2014). Since then, the onboard detectors have been recording magnetic field, particle and wave data from the interstellar medium. Because of the plasma instrument onboard Voyager 1 is off from early 2007, there is not any observation on solar wind velocity in the vicinity of the heliopause.
Krimigis et al. (2011) calculated the anisotropies of low-energy particles observed by Voyager 1 in the heliosheath. From their results, these authors predicted that the spacecraft entered into a transition layer at the distance of ≈ 113 AU, where the radial component of the solar wind speed (VR) went down to zero, meaning that about 8 AU inside the heliosheath from the heliopause, the solar wind plasma became azimuthal. At the same time, the cosmic-ray instrument did not observe any abrupt change in the high-energy galactic cosmic-ray intensity (see for instance Webber et al. 2012; Burlaga & Ness 2014), which means that radial inward diffusion and outward convection processes were unaffected by the new solar wind conditions in the transition layer. Only a few days before Voyager 1 crossed the heliopause, galactic cosmic-ray intensity showed an abrupt increase to reach its heliosphere boundary value.
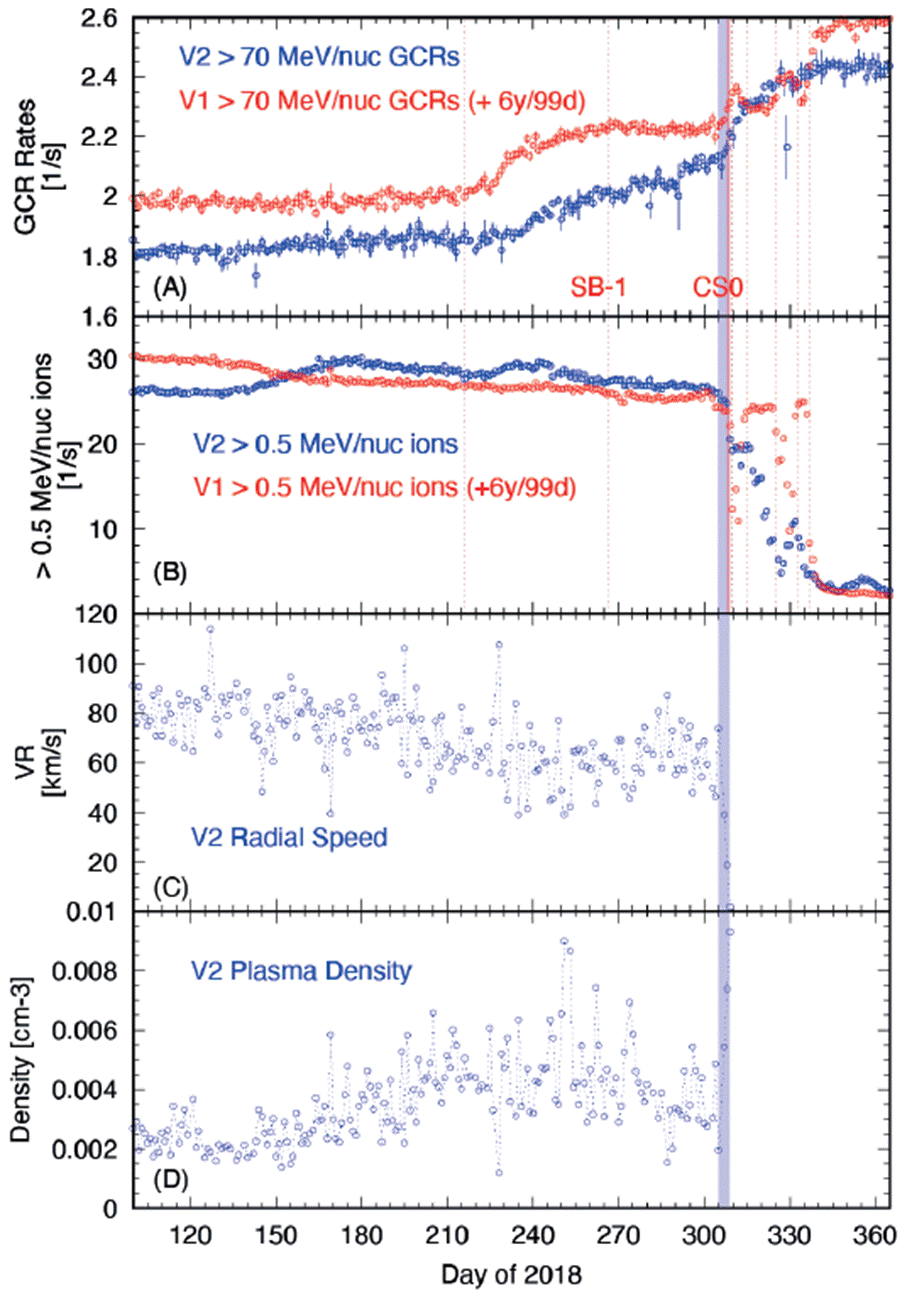
Cosmic Ray Subsystem (CRS) onboard Voyager 1 started to observe large increases in GCRs and significant decreases in low-energy heliospheric ions in July-August 2012 (Stone et al. 2013). Figure 1 shows (in red) these particles observations, shifted in time by six years and 99 days for easier comparison with Voyager 2 observations in 2018. The overall picture is that when Voyager 1 approached to the heliopause the radial intensity gradient for GCRs and heliospheric ions changed, and after the heliopause crossing (HPX) it eventually reached the interstellar level. Base on CRS observations, these authors concluded that the HPX for Voyager 1 was on August 25, 2012 (day 238). Before that day, GCR intensity had two temporary increases, that were simultaneous with decreases of low-energy ions. However, the analysis of magnetic field data made by Burlaga & Ness (2014) showed that from about a month early (July 28, day 210) Voyager 1 started to observe the interstellar magnetic field. These authors concluded that on the day 210, V1 crossed a current sheet having the structure of a tangential discontinuity. This current sheet (CS0) is represented in Figure 1 by the solid red vertical line. According to these authors, Voyager 1 observed a sector boundary before CS0 (shown by the second right dash line in panel A and B, called SB-1), where the magnetic field azimuthal angle change from “away” to “toward” polarity. At CS0 the azimuthal angle changed from “toward” to “away” polarity. The first right dash line was identified by Burlaga & Ness (2014) as a beginning of the first of two step increases in GCR intensity observed by Voyager 1 in 2012. The last five vertical lines after CS0 represent five particle boundaries, none of then associated with magnetic field polarity change. The final particle boundary occurred on August 25. Magnetic field observations after the first GCR step increase did not allow these authors to conclude about the nature of this region (heliosheath or interstellar origin). Their conclusion that Voyager 1 has been detecting the magnetic field of interstellar origin from CS0 crossing, is supported by the fact that magnetic field polarity has not changed since then.

Figure 1 Voyager 1 (in red) and Voyager 2 (in blue) observations. We show daily averages of (A) counting rate for high-energy GCRs, (B) low-energy ions, (C) V2 radial component of the solar wind speed, and (D) V2 plasma density. Vertical red lines are from Burlaga & Ness (2014) (see text for explanation). The blue rectangular band shows the region where the radial component of the solar wind speed abruptly dropped, and the plasma density rapidly increased, ending on November 5, 2018 (day 309). This behavior on radial speed and plasma density is an indication of the Heliopause crossing. Since then, Voyager 2 is outside of the Heliosphere
Burlaga & Ness (2014) also pointed out that the two temporal changes in galactic and heliospheric particles could be explained if we assume that in this region (after CS0) there were heliospheric tube flux connected to the interstellar medium as proposed by Opher & Drake (2013) and heliosheath particles may enter this tube and restore the intensity of low-energy ions. Following the results of Burlaga & Ness (2014), in this work, we will consider that the heliopause crossing was on July 28, 2012. Our qualitative analysis will not be affected by this assumption.
Observations made by plasma and cosmic-ray instruments on board Voyager 2 indicated that this spacecraft crossed the heliopause at the distance of ≈ 119 AU. Figure 1 shows Voyager 2 plasma observations (in blue): plasma density (panel D) and the radial component of the solar wind speed (panel C) from day 100 to day 309 of 2018. These data reveal, for the first time in the space era, the plasma parameters at the heliopause, on November 5, 2018 (day 309). In the interval of five days (from November 1 to November 5) plasma density jumped from about 0.002 cm−3 to 0.0093 cm−3 (4.65 times), and the radial component of solar speed went from about 74 km/s to zero. Since then, plasma data disappeared from the three sunward pointed detectors. This fact is a clear indication that the Voyager 2 crossed the heliopause and entered the new region in front of the heliosphere. During these five days, the cosmic-ray detector on Voyager 2 observed that the counting rate of > 70 MeV galactic protons (panel A) showed a very high gradient of about 100%/AU, and the counting rate of low-energy heliospheric ions (panel B) started dropped to a level below the detector background.
These simultaneous observations of plasma and galactic cosmic rays indicate that once VR went to zero, meaning that radial convection and radial diffusion are also zero, the solar modulation of cosmic rays vanished. Therefore, just in this thin layer of the heliosphere (we call it “skin of the heliosphere”) with a thickness of about 0.04 AU, the cosmic-ray intensity must increase to reach its value at the heliopause. This work aims to show a simple qualitatively explanation of the Voyager 2 observations in the vicinity of the heliopause and show a possible scenario for radial solar wind profile when Voyager 1 crossed the heliopause in 2012.
Cosmic-Ray Modulation in the Vicinity of the Heliopause
The cosmic-ray transport equation was first derived by Parker (1965), and the details of this and subsequent derivations, and its various solutions were reviewed by Moraal (2013). The lowest-order approximation is the so-called Convection-Diffusion formalism (CD) which assumes spherical symmetry of the heliosphere, ignores adiabatic energy changes and assumes a steady-state, so that the transport equation, for the omnidirectional distribution function, f (r, p) is reduced to:
where r is the radial position, p is the particle momentum (energy), V is the radial solar wind speed, and ( is the diffusion coefficient.
The CD model is a good approximation of the transport equation for high-energy cosmic rays and close to the modulation boundary (see for instance Caballero-Lopez & Moraal 2004). The reason is:
1) energy change is an accumulative modulation effect, and therefore it is bigger in the inner than in the outer heliosphere), 2) high-energy particles are less affected by energy changes and 3) in the outer heliosphere drift in the radial direction plays little role. CD model is also the simplest model for solar modulation.
The solution of the Eq. 1 is
where,
The modulation parameter M describes the level of reduction of cosmic-ray intensity from the LIS value (M = 0 at the heliopause). In this model, if the radial component of the solar wind speed is zero, M vanishes, and therefore the intensity reaches its interstellar value. However, the quantity that determines the modulation parameter is the ratio V/κ, and it is challenging to know which is the appropriate value for the diffusion coefficient, from the available observations. For our analysis, we consider the diffusion coefficient in the form κ = βPκo(r) (P is the particle rigidity, ( the ratio of particle velocity to the spped of light). We point out that we will only use this model to qualitatively describe the last months of Voyager observations inside the heliosphere (about 1 AU from the helio-pause, see Table 1). In this region, the radial transport of the galactic cosmic rays plays the relevant role on the intensity variations observed by the spacecraft. We must notice that the cosmic rays in this layer have just entered the overall modulation region.
Table 1 Diffusion coefficient, κo(r), normalized to its value at the boundary: κo(rb)V2 = 7.2 × 1019cm2s−1GV−1; κo(rb)V1 = 2.7 × 1018cm2s−1GV−1.
| Voyager 2 Day of 2018 | Distance (AU) | κo/κo(rb) | Voyager 1 Day of 2012 | Distance (AU) | κo/κo(rb) |
|---|---|---|---|---|---|
| 180-190 | 117.90-117.99 | 62.5 | 100-117 | 120.29-120.44 | 222.2 |
| 190-230 | 117.99-118.34 | 56.3 | 117-167 | 120.44-120.93 | 26.4 |
| 230-305 | 118.34-118.99 | 10.8 | 167-206 | 120.93-121.30 | 444.4 |
| 305-309 | 118.99-119.03 | 1 | 206-210 | 121.30-121.33 | 1 |
Finally, in our analysis, we use the interstellar spectrum observed by Voyager 1 and described in Vos & Potgieter (2015). For our study, this spectrum is sufficient because we are looking at the qualitative picture of the cosmic-ray modulation in the thin region close to the heliopause.
Results and Discussion
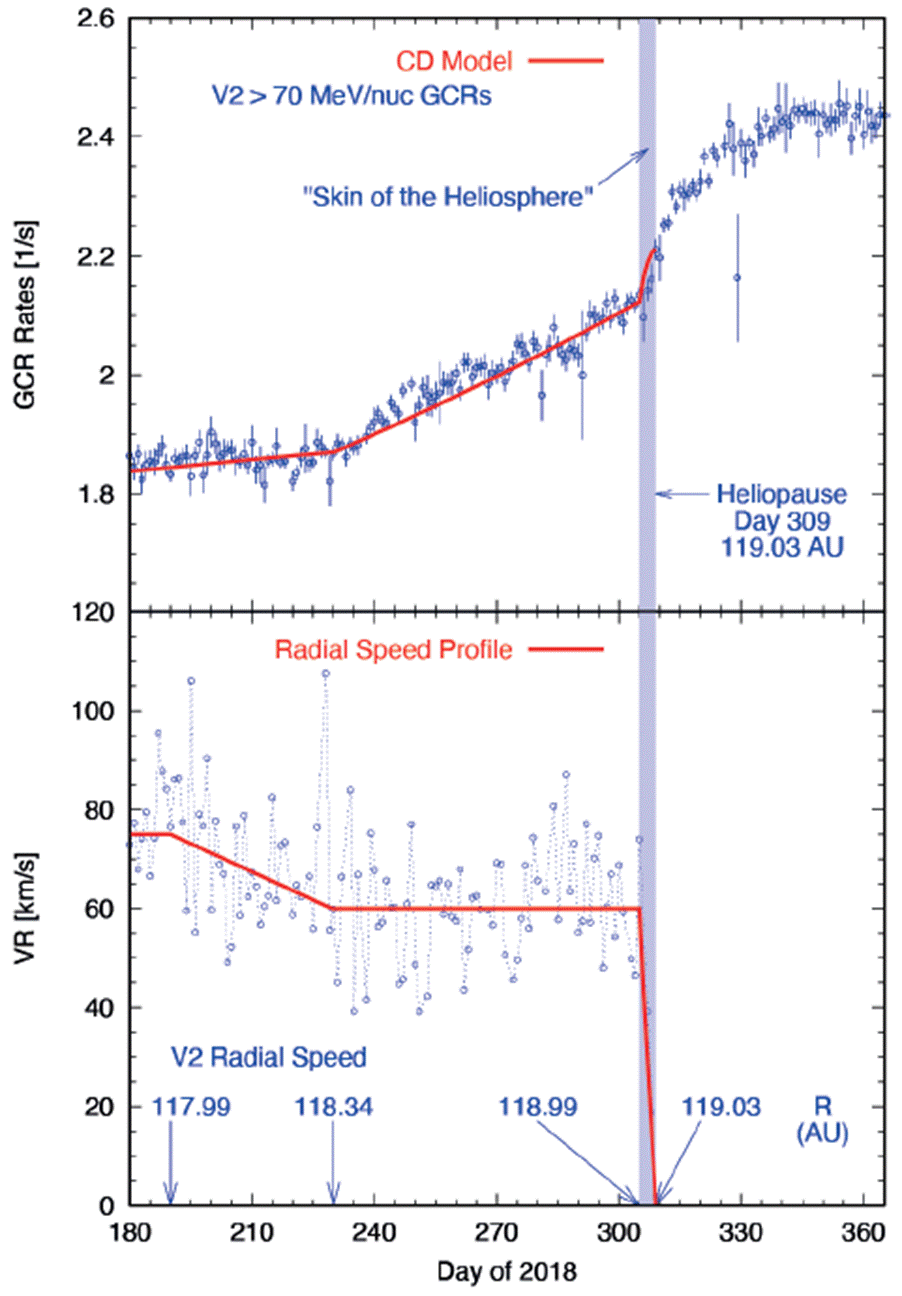
In Figure 2 we present the results of our analysis for Voyager 2 observations. From ≈ 118 AU, VR (blue line in bottom panel) started to decrease at approximately a constant rate from 75 km/s to 60 km/s at ≈ 118.3 AU, and kept this value for 2.5 months until V2 reached the distance of 118.99 AU, where VR dropped to zero on the day 309 of 2018 (November 5) at 119.03 AU. On the other hand, cosmic-ray detector observed an increase in the intensity gradient of the > 70 MeV protons from 118 AU (≈ 3%/AU), when VR was decreasing from 75 to 60 km/s (see top panel of Figure 2). At about 118.34 AU, the cosmic-ray intensity gradient increased at a constant rate of ≈ 22%/AU until the day 305 at the radial distance of 118.99 AU. When VR abruptly went to zero in the next five days, the intensity rapidly increased by ≈ 100%/AU. Although this happened in a very short radial distance, this gradient of GCR is much larger than those previously observed by Voyager 1&2 in the heliosheath (see for instance Webber et al. 2012).

Figure 2 Voyager 2 observations in the vicinity to the heliopause. The top panel shows the daily average counting rate for galactic cosmic-ray protons, > 70 MeV (in blue), red line is the result of the modulation, explained in the text. In the bottom panel we present the radial component of the solar wind speed (in blue). The red line is a qualitative representation for speed.
To apply the CD model to these observations, we use a VR profile, shown in red (bottom panel of Figure 2). Using Eq. 1, we compute the distribution function, f. Then, taking into account the relationship between f and the observed intensity (j) as j ∝ P2f, we obtained the counting rate for GCR protons, and therefore the radial intensity gradient is calculated by the expression:
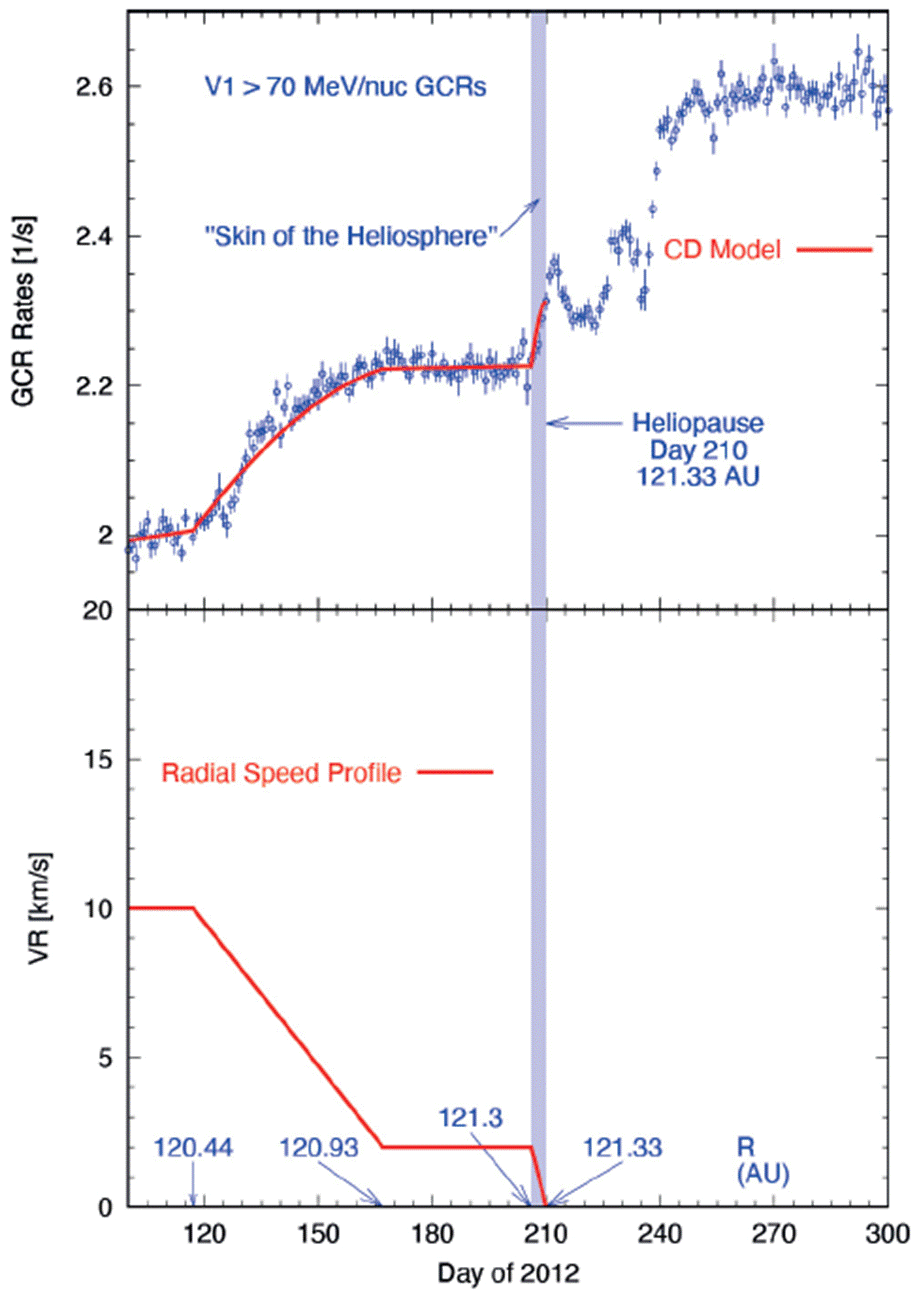
These Voyager 2 plasma observations motivated us to describe a possible scenario for solar wind speed when Voyager 1 crossed the heliopause on July 28, 2012. Counting rate of GCR protons observed by Voyager 1 shows the following features. 1) From day 100 (≈ 120.3 AU) to day 117 (≈ 120.44 AU) the radial gradient was ≈ 6%/AU. 2) Then, when the first step increase began, the radial gradient increased to ≈ 23%/AU until it reached a plateau when Voyager 1 crossed the sector boundary SB-1 on about the day 167 (≈ 120.93 AU). 3) From day 167 to day 206 (≈ 121.3 AU) the radial gradient was small, ≈ 2%/AU. And 4) in the next five days until Voyager 1 crossed the heliopause on the day 210 (≈ 121.33 AU) the radial gradient jumped to ≈ 93%/AU. These changes in the radial gradient are the results of spatial variations in the magnetic turbulence that affect the diffusion of cosmic rays. However, there is a lack in the understanding of the turbulence regime in this region of the heliosphere. Despite the plateau region between SB-1 and CS0, the counting rate at V1 is similar to that observed at V2 just before the HPX.
As we mentioned early, Voyager 1 plasma instrument was off at that time, so we did not have solar wind speed data during the heliopause crossing. Decker et al. (2012) estimated the radial component of the solar wind from the analysis of the low-energy charged particle observations on board Voyager 1. According to Figure 3 (panel j) of that paper, VR at the beginning of 2012 is very low, about 10 km/s. We use this VR value and assume a similar radial dependence as for Voyager 2 to apply the CD model to GCR rate at Voyager 1. This dependence of VR is shown in the bottom panel of Figure 3. The result is shown with a red line in the top panel of Figure 3. In bottom panel, we present the radial solar wind speed profile, similar to that of Voyager 2 in Figure 2. For the CD model, the diffusion coefficient has the same energy dependence, but its level is different, as suggested by different radial gradient mentioned above. In Table 1 we can see that the diffusion coefficient applied to V1 observations follows the V2 diffusion coefficient radial dependence: increased from the heliopause (except for the plateau region where perhaps the turbulence was very low). It is important to note that, the diffusion coefficients used in this work depend on the assumptions of the radial component of the solar wind, and therefore, they only give an indication of the relative level of the turbulence in each region. The “skin of the heliosphere” at the Voyager 1 location was the same as that observed by Voyager 2, about 0.03 AU. This “skin” is a remarkable picture of the heliosphere boundary.

Figure 3 Voyager 1 observations close to the heliopause. Top panel: counting rate daily averages for galactic cosmic-ray protons, > 70 MeV (in blue), the red line is the result of the modulation, explained in the text. The bottom panel shows the assuming radial profile of the solar wind speed, similar to the observed at Voyager 2.
Conclusions
This work presented the recent plasma and cosmic-ray observations made by Voyager 2 in the vicinity of the heliopause. The simple convection-diffusion modulation model supported the analysis. We propose the existence of a thin layer on the heliosphere boundary, called here “skin of the helio-sphere”, with a thickness of about 0.04 AU. This “skin” has four features: 1) the radial component of the solar wind speed vanishes, 2) rapidly increase in the plasma density, 3) rapidly increase in GCR intensity to reach the outside spectrum, and 4) low-energy heliospheric ion intensity start to drop to a very low level outside of the heliosphere.
Another important conclusion is that the observed “skin” during Voyager 2 heliopause crossing could also be during Voyager 1 crossing in 2012. Therefore, it may be a global layer along the helio-pause. The similarity in the observed galactic cosmic-ray intensity by Voyager 1&2 in the vicinity of the heliopause, suggests that radial component of the solar wind speed was different from zero (but very small, ≤ 10 km/s) up to the Voyager 1 entered this “skin” just four days before the heliopause crossing.


 nueva página del texto (beta)


