1.Introduction
The admixture of various chemical elements such as group III-V and group II-VI is used to control different physical properties of semiconductors, primarily the lattice constant, the amplitude of the bandgap, and, consequently, the optoelectronic properties, to fulfill the requirement for a specific function of semiconductor compounds. Such possibilities are reached thanks to the development of ternary alloys, but the researchers want to refine and expand their applications, thanks to the development of ternary alloys such perspectives are achieved, but the researchers want to refine and extend their applications, this perspective has been realized by the formation of four elements (quaternary alloy). The ability of quaternary alloys formation accesses further research lines and performs an improved technique to better change distinct semiconductor physical properties. Group IIIA-VA semiconductors including GaAs, AlP, GaN, GaSb, InP, InAs, and InSb are popular binary alloys for microelectronic and optoelectronic use. The application of quaternary layers based on these binary alloys to the material design again gives greater versatility to adjust the band distance and band offsets of matched InP or GaAs lattice heterostructures 1-4. Many theoretical and experimental studies on quaternary alloys for use in various fields have recently been carried out. Hosni and colleagues have presented a comparative analysis and found that the large optical gain and wavelength for fiber optic communications can be obtained by applying AlGaInAs quaternary nanowires 5. Another research carried out by Yingxin et al. indicates the positive growth of In1-xGaxAs1-yBiy in the metal-organic vapor phase epitaxy (MOVPE) on the InP substrate 6. The surface morphology of InAs1-x-ySbxPy epilayers grown by liquid phase epitaxy has been studied. The study shows that globules and hillocks have no effects on the crystalline quality and compositional uniformity of InAs1-x-ySbxPy epilayers 7. Our research theory is based on predicting the structural, electronic and optical properties of alloys with various N concentrations x (0.125, 0.25, 0.75, and 0.875) in Al0.50Ga0.50NxSb1-x. We have employed in this prediction the full-potential linearized augmented plane wave (FP-LAPW) method within density functional theory (DFT) 8. We studied the effect of the quaternary Al0.50Ga0.50NxSb1-x concentration of nitrogen atoms on the structural, electronic, and optical properties. Following our library search and according to our knowledge, there is neither theoretical nor experimental data about Al0.50Ga0.50NxSb1-x for comparison.
This article is structured as follows, after the abstract and introduction. In Sec. 2 of this paper establish a short description of the computational method used in this study. A detailed description of the acquired results and their interpretation related to structural, electronic and optical properties of Al0.50Ga0.50NxSb1-x alloys are presented in Sec. 3.
2.Calculation details
The WIEN2k code 9-11 has been used to explore first-principles investigations. In this paper, the effect of exchange-correlation in the GGA was evaluated within Perdew-Burke-Ernzerhof (PBE) 12 potential. It is acknowledged that the standard semi-local GGA undervalues band gaps; for that reason, we have completed the exchange and correlation effects of self-consistency by using the modified Becke-Johnson (mBJ) potential 13. This approximation is a modified version of the Becke-Johnson potential employed to ameliorate band gaps obtained by the conventional density functional theory (DFT) based methods. The mBJ exchange-correlation potential has importantly improved band gap results for wide bandgap insulators and doped semiconductor structures 13-21.
In this work, we have selected the following calculation parameters: the muffin-tin
radii (MT) for Al, Ga, N, and Sb to be 2.0, 2.20, 1.8, and 2.50 atomic units (a.u.),
respectively. The
To predict the structural, electronic, and optical properties of the Al0.50Ga0.50NxSb1-x quaternary alloys, we have employed a (2 x2 x 2) supercell with 16 atoms, 8 atoms for the group III (Aluminum (Al) and Gallium (Ga)), and 8 atoms for group VI (Azote (N) and Antimonide (Sb)). We have chosen 4 atoms for Aluminum and 4 atoms for Gallium to create the structure Al0.50Ga0.50NxSb1-x. To build the structure Al0.50Ga0.50N0.125Sb0.875, Al0.50Ga0.50N0.25Sb0.75, Al0.50Ga0.50N0.75Sb0.25, and Al0.50Ga0.50N0.875Sb0.125, we have chosen 1, 2, 6, and 7 atoms for N, respectively. We note that all structures have a cubic structure in space group F-43m (no.216) (zincblende). The electronic configurations of Al, Ga, N, and Sb are Al: [Ne] 3s23p1, Ga: [Ar] 3d104s24p1, N: [He] 2s22p3 and Sb: [Kr] 4d105s25p3.
3.Results and discussions
3.1Structural properties
To predict the ground state properties such as the equilibrium lattice constant a, the bulk modulus B0 and the bulk modulus pressure derivative B´, we have optimized all structures Al0.50Ga0.50NxSb1-x with (x = 0.125, 0.25, 0.75, 0.875), and we have calculated the total energies, according to the unit cell volumes and fitted to the Birch-Murnaghan’s equation of state (EOS) 22 and it’s based necessarily on two parameters: the compressibility B0 and its first derivative B0’ with respect to the pressure. These two constants are resolved by adapting the energy versus the volume; the isothermal compressibility modulus B is related to the curvature of the function E(V) by the following relation:
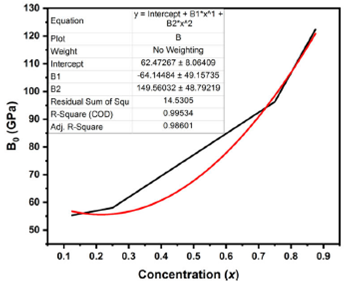
With V0, E0, B0 and B0´ are the volume, total energy, compressibility modulus, and its first derivative, respectively. The studied structural parameters of Al0.50Ga0.50NxSb1-x for various concentrations are resumed in Table I, together with the available theoretical and experimental data. Figure 1 exhibit the variation of parameter lattice a as a function of the composition (x) for Al0.50Ga0.50NxSb1-x, the linear liaison between the parameter lattice and Nitrogen (N) concentration x is calculated by Vegard’s law 23 as follows:
Table I Calculated lattice constant (a), bulk modulus (B) for Al 0.50Ga 0.50N x Sb 1−x at concentrations x = 0.125, 0.25, 0.75,and 0.875.
| Compound | a(Å) | B(GPa) |
| Al0.50Ga0.50N0.25Sb0.875 | 6.00895 | 55.2963 |
| Al0.50Ga0.50N0.25Sb0.75 | 5.89050 | 58.0267 |
| Al0.50Ga0.50N0.75Sb0.25 | 5.12800 | 96.2490 |
| Al0.50Ga0.50N0.875Sb0.125 | 4.83195 | 122.3482 |
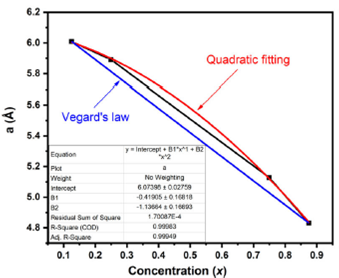
Figure 1 Calculated lattice constant a of Al ..50 Ga 0.50 N x Sb1 -x as a function of concentration (x).
Generally, the relation between the parameter lattice and concentration is not always linear, for that we have to use the quadratic relationship obtained by fitting:
Equation (4) represents the quadratic relation of bulk modulus as a function of the concentration x.
Figure 2 exhibit the calculated bulk modus as a function of concentration x.
3.2.Electronic properties
In this part, to predict and know the nature of the bandgap, we have calculated
the electronic band structure for
Al0.50Ga0.50NxSb1-x with
different concentration x(x = 0.125, 0.25, 0.75, 0.875) using GGA-PBEsol 12 jointed with (TB-mBJ) of
Tran-Blaha modified Becke-Johnson approximation. The band structure is an
indispensable aspect to explore the electronic properties of solids. An
important element of details given by the band structure is the width of the
energy bandgap (Eg), which is the energy separating the valence band top to the
conduction band bottom. The calculated structures along the high symmetry
directions of Al0.50Ga0.50NxSb1-x
alloys for x = 0.125, 0.25, 0.75 and 0.875 are given in Fig. 3, 4, 5, and 6, respectively. The top of the valence
band and the bottom of the conduction band are located at
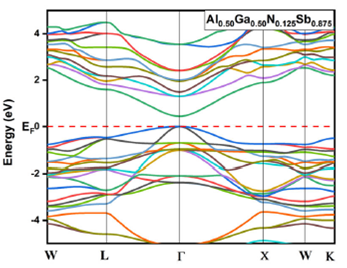
Figure 3 Electronic band structures for Al 0.50 Ga 0.50 N 0.125 Sb 0.875 using GGA-PBEsol and TB-mBJ approximation.
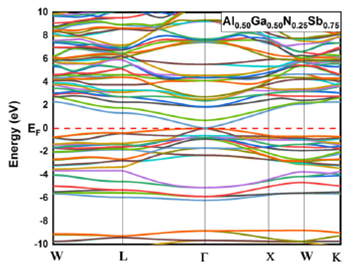
Figure 4 Electronic band structures for Al 0.50 Ga 0.50 N0.25Sb 0.75 using GGA-PBEsol and TB-mBJ approximation.
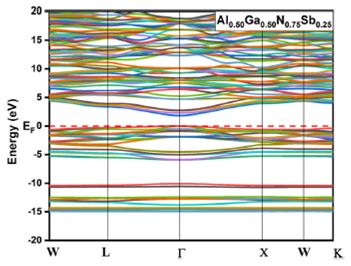
Figure 5 Electronic band structures for Al 0.50 Ga 0.50 N 0.75 Sb 0.25 using GGA-PBEsol and TB-mBJ approximation.
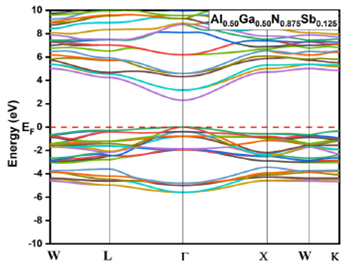
Figure 6 Electronic band structures for Al 0.50 Ga 0.50 N0.875Sb 0.125 using GGA-PBEsol and TB-mBJ approximation.
3.3.Optical properties
The study done by Ehrenreich and Cohen will allow us to describe the dielectric function as a complex function as:
where
where ω is the frequency of the light, e is the electric charge is the vector
defining the polarization of the incident electric field, Ω is the unit cell
volume,
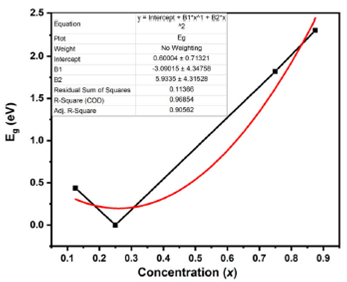
Table II Calculated values of the direct band gap of Al 0.50Ga 0.50N x Sb 1−x alloys obtained within GGA-PBEsol+mBJ approximation in comparison with experimental data and other the- oretical values
| Compound | Eg(eV) |
| Al0.50Ga0.50N0.125Sb0.875 | 0.43872 |
| Al0.50Ga0.50N0.25Sb0.75 | 0.00000 |
| Al0.50Ga0.50N0.75Sb0.25 | 1.81838 |
| Al0.50Ga0.50N0.875Sb0.125 | 2.30677 |
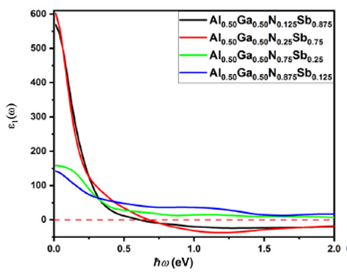
Figure 8 shows the real part of the
dielectric function for
Al0.50Ga0.50NxSb1-x. It is
evident that the zero frequency limits
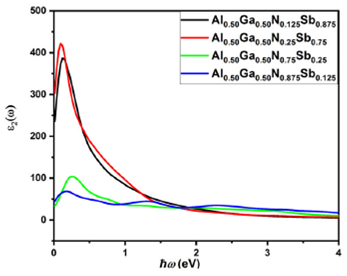
Figure 9 Calculated imaginary parts of the dielectric function of Al 0.50 Ga 0.50 N x Sb 1-x structures.
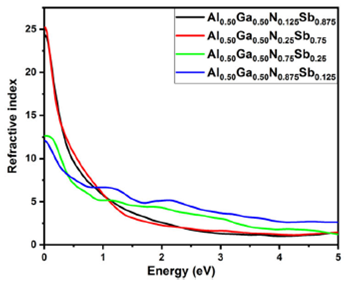
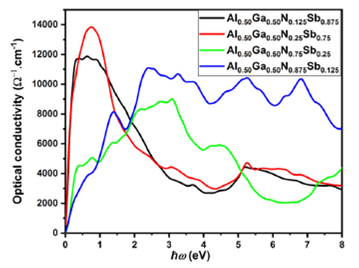
The refractive index is a fundamental optical constant. It can present data about the comportment of light in materials; when light passes through the different structures, its velocity decreases by increasing the refractive index of these structures 32. Figure 10 represents the refractive index versus light energy (spectral radiations). The maximum refractive index for Al0.50Ga0.50NxSb1-x for all concentrations is situated at zero frequency limits, the static refractive index n(0) for x = 0.125, 0.25, 0.75, and 0.875 are around 24.3361, 25.2517, 12.6392 and 12.0682 eV, respectively, and is decreased as a function of energy. The extinction coefficients of Al0.50Ga0.50NxSb1-x for different concentrations are presented in Fig. 11. We remark that the extinction coefficient increases and decreases after attaining a peak for all concentrations except for x = 0.875 composition. The peaks located at 0.25851, 0.14966, and 0.34014 eV for x = 0.125, 0.25, and 0.75, respectively, and several peaks for x = 0.875 situated at 0.23130, 1.40139 and 2.46263 eV. The plots of the optical conductivity σ(x) within the GGA-PBEsol approach are displayed in Fig. 12. Various peaks are presented in the feature of σ(x) curves, which are vary in agreement with the energy bandgap.
4.Conclusion
We have presented a theoretical study of the structural, electronic, and optical
properties of Al0.50Ga0.50NxSb1-x alloys
in the zincblende structure (B3) employing the FP-LAPW approach with the GGA-PBEsol
and TB-mBJ approximation. We have found that all structures have a direct bandgap
located at


 nueva página del texto (beta)

