


 nueva página del texto (beta)
 Inglés (pdf)
 Artículo en XML
 Referencias del artículo
 Enviar artículo por email
 Citado por SciELO
  Similares en
SciELO
Similares en
SciELO 
 Permalink
1 Introduction
The fascinating water repellents of many biological surfaces, in particular, plant leaves such as Lotus leaf, in the feathers of birds, such as peacock, and also in cuticle of insects, whose self-cleaning surface has a contact angle approaching 180 inspire us to imitate such functionality in numerous industrial applications. Indeed, such properties are ensured by the presence of a special structure and morphology, [1,2] or by the presence of a thin layer of material by deposition or etching [3,4] that provides the desired functionality. As with the lotus leaf, the rose petal has a hydrophobic wax layer, Dragonflies, with a very thin stable and super-hydrophobic wings and self-cleaning has recently attracted great interest for fundamental research as well as practical applications, such as self-cleaning, impermeability, anti-icing [5-7], waterproof clothes, corrosion prevention, anti-fouling, microelectronics, and biomedical applications [8-12]. The first attempt to understand the relationship between wettability and roughness dates back to (1936) Wenzel [13], he noted that the hydrophobic character of a material is improved by the presence of a special surface textures. He attributed this behavior to the increase in the effective surface, because the liquid perfectly matches the contours of the roughness. The morphology of the coating surface can be modified and the hydrophobic properties can be improved by the introduction of several materials such as silicone, titanium oxide and other materials [14-16]. To obtain micro-structured surfaces several methods can be used [17] including etching, vapor deposition, phase separation, nanoparticle filling, etc... To modify surface morphology, Hsieh [17] introduced TiO2 nanoparticles in a perfluoroalkyl methacrylate copolymer to produce a rough surface. Thies et al. [18] added activated SiO2 nanoparticles (with a diameter of (10-15 nm) to methyltrimethoxy silane CH3Si(OCH3)3, and obtained coatings with good hydrophobic and mechanical properties. In this article, we have prepared different surface microstructures by surface treatment using CH4 plasma; the effect of treatment time as well as surface morphology and microstructure on surface hydrophobicity have been investigated.
2 Experimental setup
In this work thin hydrogenated carbon (a — C: H) layers were deposited on the 20 × 20 mm paper substrate by PECVD technique., The discharge was ignited by RF (13.56 MHz) power. After the introduction of the substrates, an Ar plasma cleaning operation was followed for 5 min at a gas pressure of 2 × 10⁻² mbar and a Vdc bias of 450 V in order to remove any contaminants on the surface and to activate the surface, and then the methane gas was introduced into the reaction chamber. The main part of the experimental installation is illustrated in Fig. 1 (a,b) and details can be found elsewhere in [19,20]. It consists of an electrode system made up of flat 10 cm diameter parallel discs, the distance between electrodes is 12 cm, the hollow upper electrode is connected to the RF generator (13.56 MHz) and the lower electrode is grounded once. The gas flow has been changed via the mass flow controller and maintained at 8 × 10⁻² mbar inside the chamber deposition, while the deposition time is varied between 5 min, 10, 15 and 20 min. The input power was maintained at constant value of 100 W and a self-bias voltage (Vdc ) of 170 V at the upper electrode. The experimental parameters are summarized in Table I.

Table I Experimental parameters of surface paper treatment.
| Sample | E1 | E2 | E3 | E4 |
|---|---|---|---|---|
| Time (min) | 5 | 10 | 15 | 20 |
| Pressure (mbar) | 8 × 10⁻² | 8 × 10⁻² | 8 × 10⁻² | 8 × 10⁻² |
| Power (W) | 100 | 100 | 100 | 100 |
| Bias Voltage, Vdc (V) | 170 | 170 | 170 | 170 |
In order to investigate the film’s characteristic, the surface morphology of the as deposited thin films was analyzed by means of scanning electron microscope (SEM, JEOLJSM-6360LV) while surface topography and roughness of the films were evaluated by AFM in contact mode by a Nanosurf Flex-AFM system equipped with a 10 × 10 μm high-resolution scanner. AFM images were recorded with a resolution of 256 × 256 pixels over scanning areas of 2 × 2 μm, and the Gwyddion software was used for image processing and surface roughness calculations [21]. To characterize the bonding structure of the deposited films an FTIR (Bruker, EQUTNOX 55 model) spectrophotometer with wavenumber range of 400 — 400 cm-1 was employed. The water contact angles of the films measurements were determined by GBX “Digidrop” optical contact angle measurer instrument.
3 Results and discussion
3.1 SEM image of untreated paper
The micrographs obtained by scanning electron microscopy (SEM) of the untreated paper sheets are shown in Fig. 2. Surface micrographs show a homogeneous and relatively regular coating, with cellulose fibers which fills the pores appear on the surface. It should be noted that the surface display single fibers which constitutes the matrix of the organic material. These fibers are arranged in an unordered manner and appear structured like those of polymeric materials. The white parts in the figure are supposed to be lignin that goes into paper making.

3.2 Roughness measurement
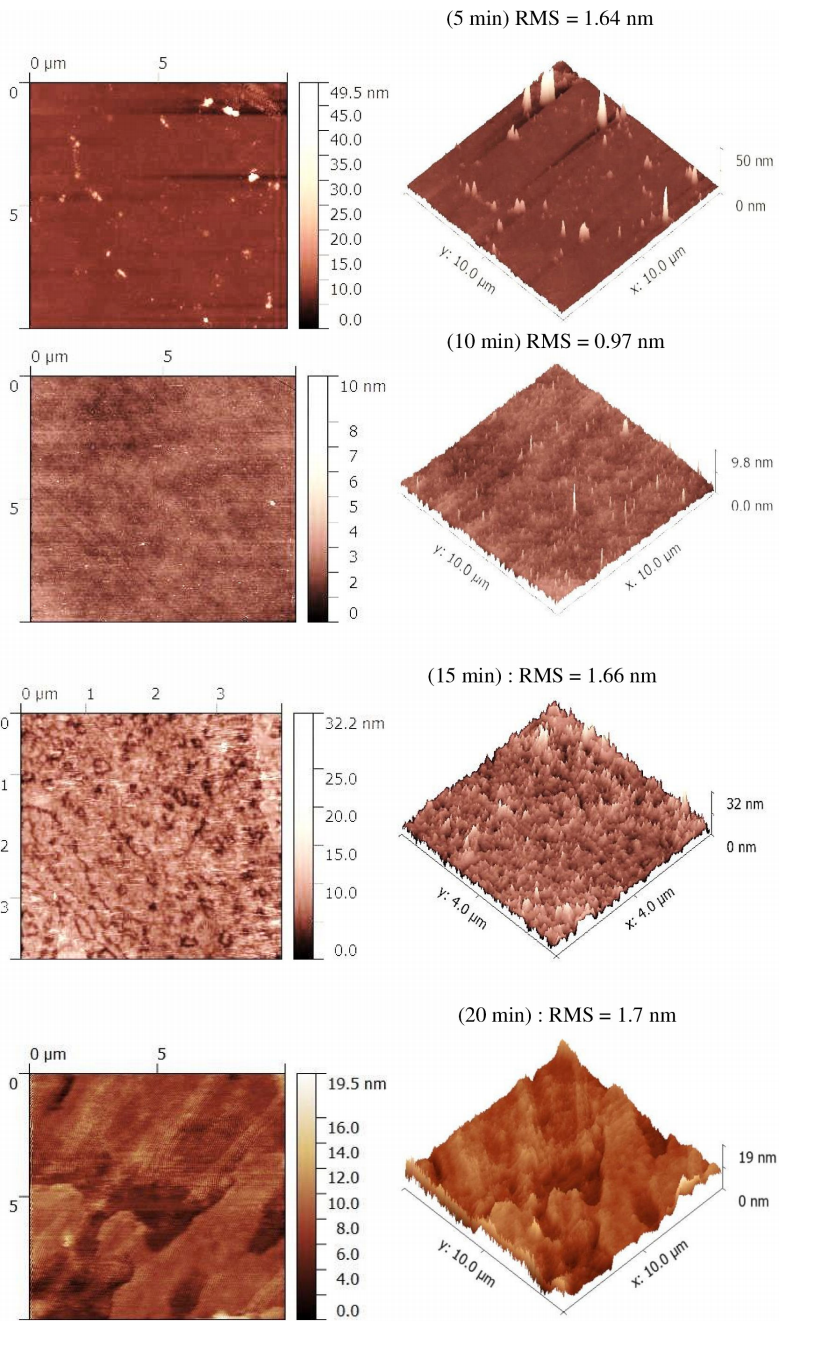
To measure the roughness of the treated surfaces, atomic force microscopy (AFM) analysis was performed on paper samples treated with CH4 plasma at different time. As known, surface roughness is most often described by amplitude parameters, such as mean square deviation, and standard deviation. To analyze and compare the surface roughness of the deposited thin films for each surface treatment we measured the roughness in particular; the root mean square (RMS) as depicted by Fig. 3. The registered values are summarized in the Table II and illustrated by Fig. 3 in 2D and 3D images. As can be seen from Table II, surface roughness decreases from 1.64 to 0.97 nm, and then increases to 1.66 nm and 1.7 for more deposition time. This variation of RMS can be explained by; initially, the surface paper is more rough and as we start the treatment the surface texture is modified by filling up irregularities and pockets resulting in roughness decreasing giving up to a value of 1.64 nm. By continuing the deposit, these pockets and irregularities become more filled to give rise a smooth surface with 0.97 nm of roughness with almost total disappearance of irregularities as shown in Fig. 3. However, surprisingly as the growth process continues for longer time the roughness does not continue to take low values but increases towards 1.66 nm and 1.7 nm with the reappearance of a uniform texture on top surface paper. This means that the top surface paper is covered by a thin layer of hydrogenated carbon film that is consisted by a mixture of sp2 and sp3 carbon hybridization. Some authors [21-23] in their studies attributed the increase of surface roughness to the increase in growth of sp2 carbon bonds and the increase in clusters size, and vice versa. On the other hand, Pandey et al. [24] reported that the higher the sp3 fraction is, the smoother is the surface. K. N. Pandiyaraj et al. [25] have attributed the difference in RMS with sp3 fraction by changing the values of bias potential of the substrate holder, which is not the case in our experiments surface treatment. Consequently, the sp3 fraction in our thin films does not change since the substrate holder is grounded for all treatments. However, the sp2 fraction in DLC films can change with film thickness as reported by Scharf and Singer [26] in their study of diamond-like carbon films by Raman spectroscopy. This finding leads us to suppose that the increase in roughness can be attributed to the clustering of sp2 bonds as mentioned before.
3.3 Contact angle measurement
The effect of CH4 plasma on the wettability was investigated by measuring the contact angle of the sessile water droplet on the paper surface. Figure 4 presents the images of the water contact angle variation as a function of deposition time. One can observe that all the coating surfaces have become super-hydrophobic, except the coating deposited for 10 min which is exhibiting a hydrophobic behavior. In Fig. 5, the variation of the contact angle and roughness versus deposition time is illustrated; the samples treated for 5 min exhibits a hydrophobic character with a contact angle equal 153.8° and Rrms equal to 1.64 nm. Increasing the time treatment to 10 min the Rrms decrease to the 0.97 nm, consequently the contact angle decreases to 137.7°, then Rrms increase to 1.66 nm and 1.7 nm for a treatment at 15 min and 20 min respectively, which leads to an increase in the contact angle to 149.2° and 156°, respectively. Generally, hydrophobicity and hydrophilicity of surfaces are influenced by surface roughness, and surface energy, a rough surface and a low surface energy gives a superhydrophobic surface [27] the surface energy [28] includes two important components, dispersion and polar components. Polar components represent the surface interactions, which are related to dipoles, while dispersive component represents the surface interactions, which are based on temporary variation in the electron density. Bhushan and Jung [29] reported that two main requirements for a super-hydrophobic surface are that the surface should be rough and has a low surface energy with a special focus on roughness which is usually a more critical property than the low surface energy. Such assumption is confirmed by Fig. 5 where contact angle and roughness are plotted together as a function of deposition time. At first glance, one can conclude that CA and RMS exhibit a same behavior and there will be a relationship between the two parameters as reported above. On one side, the roughness of the surface serve to trap enough air, which prevents the water drops from being in perfect contact with the surface, which facilitates the sliding of the water drops. On the other side, the presence of CHx radicals has an important influence on the surface hydrophobicity. N. Sooryun et al. [30], indicate that the alkane group has an intrinsic critical surface tension, the contact angle can show a certain value if the whole surface is covered by the functional group layer such as C — H stretch, CH2 bend and CH3 bend, which proves the hydrophobicity formation by the plasmas.


3.4 FTIR Studies of chemical bands
Now let us determine the presence of functional groups on the surface of the treated paper by using FTIR analysis. Figure 6 shows the FTIR spectra of all treated surface paper. As one can see for all samples, an absorption band occurs between 737 and 613 cm-1. This bond is decomposed into three strong peaks assigned to C — H out of plane vibrations. A strong peak appears at 1104 cm-1 for samples deposited at 5 min, and then disappears for samples deposited at 10 min. The same peak appears again shifted towards the weaker frequencies for samples deposited at 15 min and 20 min. This peak is attributed to the stretching vibration of C—O as reported by N. V. Farinella Van. P. D. et al. [31] who found a peak at 1110 cm-1 of C—O in the lignin structure. Also, the absorption peak appearing at 1293 cm-1 is assigned to stretching bands in C—O [32], which shifts towards high frequencies for samples treated during 20 mn. The band at 1512 is attributed to C=C aromatic stretching modes [33] while at appearing at 2917 cm-1 is assigned to antisymmetric stretching sp3—C—H n as confirmed by some other authors [23,34,35]. A weak peak is observed at 2324 cm-1 attributed to the C—C bends, and becomes strong with deposition time. Such variation in the relative intensity suggests a removal and incorporation of species i.e. groups are reincorporated in the same proportion as they are removed. The peaks at 3325 cm-1, 3330 cm-1 and 3732 cm-1 corresponds to O—H stretching bands [36,37] and the peak at 3732 cm-1 are assigned to O—H stretching while the same peak around 3600—3800 cm-1 is identified by [38] and attributed to an isolated -OH stretching vibration. All CHx molecules are the result of methane molecule (CH4) dissociation, giving rise to radicals such as CH3, CH2, C2H5, C2H6 etc. while the oxygen entering in the OH bond formation comes from the residual vacuum generally equal to 2 × 10⁻⁵ mbar. The presence of functional groups (non-polar such as CHx) will prevent the entry of water molecules in the polar bonds in most of the surface of the paper, thus contributing to the improvement of the hydrophobic properties of the surface of the glass [39], thus contributing to the improvement of the hydrophobic properties of the paper surface.

4 Conclusion
The study we carried out concerns the treatment of paper surface plasma enhanced chemical vapor deposition (PECVD) technique by using CH4 gas. Paper samples in contact with the plasma leads to the deposition of a thin layer of hydrogenated carbon, the thickness of which was varied with the deposition time while other experimental parameters were kept constant during all manipulations. In summary, the presented results on hydrophobicity of surface paper have been discussed according to AFM, contact angle and FTIR measurements. The concluding remarks that can be drawn are as follows:
• After a contact with CH4 plasma in a PECVD reactor a thin layer of hydrogenated carbon material is deposited,
• Surface paper roughness is in the order of approximately 1 nm to 1.7 nm after a surface treatment ranging from 5 min to 20 min.
• The deposition of a thin layer of hydrogenated carbon on surface paper gives hydrophobicity and even super-hydrophobicity to its surface,
• The FTIR spectroscopy confirms the presence of non-polar groups on the surface that enhance hydrophobicity,
• The presented results confirm the existence of a relationship between hydrophobicity and roughness promoted by a clustering of sp2 hybridization with film thickness,
In conclusion, the encouraging results promise the efficient application of hydrogenated carbon to surface paper modification, thus protecting and giving it a long life with minimal damage upon contact with water.

