1. Introduction
The notion that acoustic wave or sound vibration (SV) affects the leaf or other parts of a plant in general is not new. This focus of study has been conducted for more than 30 years. An example of this study is sonic bloom, which is a plant growth enhancer that uses sound exposure and spray fertilizer [1]. Sonic bloom has been applied to many plants, such as Tagetes erecta L. [2], Mung bean [3], Cluster bean [4], and Rosa chinensis [5]. Another interesting aspect of plant acoustic that is still an open problem to date is the mechanism in which SV affects the plants. There are three physical events on SV attenuation by a plant, i.e. sound is reflected, scattered, and absorbed by the steam, branch, and leaf [6]. The Doppler laser is also used to show the difference of SV speeds in air (5 × 10 -3 m/s) and leaf (3 × 10 -4 m/s) when identical sound source passed them [7,8].
Stomata play an important role in plants. They are the entrance of carbon dioxide (CO2) and oxygen (O2), which are the materials for and results of photosynthesis, respectively. Physically, the work mechanism of the stomata depends on the pressure of the guard cells [9]. Presently, there are two main components that cause the stomata movement, namely potassium (K+) and sucrose. The potassium content of guard cells is much higher than that of epidermal cells around the time the stomata open [10,11]. Sucrose plays an important role in the osmoregulation of the guard cells [12]. The process of stomata pore movement (opening and closing) is strongly influenced by external factors, such as light [13], CO2 [14], temperature [15], mineral nutrition [16], and humidity [17]. In addition, internal factors in the form of organelles in the guard cells also play a role in the movement of stomata. Hence, stomata are very sensitive, so that any study on stomata requires careful technique. Suryadarma et al. (2020) has studied the increase of stomata pore area of corn plant stimulated by insect sound using a microscope and NIS Elements Viewer program based on an elliptical equation [18]. It is concluded that sound exposure causes the increase of stomata pore area [19,20]. The wider the stomata opens, the higher the amount of CO2 may enter, such that the photosynthesis rate increases [21]. Other parts of plants may also be affected by SV, such as the root [22], plant tissue [23], plant enzyme metabolism [24], and genes [25].
Hence, there are many studies that have proven the effect of SV towards plants. However, the conclusion is still unclear, especially for stomata, because the experiment, observation, and analysis used in previous studies were done unsatisfactorily and inappropriately. There are four reasons that had caused previous studies to be less convincing. First, stomata observations were done by cutting the leaves [18]. This technique is not appropriate because the leaves are detached from the life cycle and response of the plant. Second, different stomata were observed before, during, and after the SV treatment [26] producing an inconsistency in the stomata pore area results. Third, the use of adhesive materials or chemicals attached to the leaves in order to observe traces of stomata [27] that damaged the stomata and interfered with the stomata movement because stomata are very sensitive [28]. Lastly, the technique of analyzing the area of stomata pore relies heavily only on simple length (diameter) measurements of the guard cells [29].
There are many explanations why SV can affect stomata movement. Sound exposure can affect the movement of leaf particle that dominantly contains water. The movement can change the transition temperature of the cell wall in the inner structure of the leaf [30], which was corroborated by Jeong et al. (2014) using ThermaCam to show the temperature change of Oryza sativa leaf. The result shows that sound increases the leaf temperature from 24.2 to 25.2 º C [31]. A higher temperature increases the respiration, so the CO2 also increases [32]. Hence, the stomata is closed for some (temporary) time.
Edge detection is a method utilized to determine the edges of an object. This method is utilized in image processing for object recognition [33], segmentation [34], and classification [35]. A notable application of edge detection method is the enhancement of brain cancer detection [35,36]. So far, the use of digital image processing has been carried out to measure the stomata pore area [37]. Therefore, the combined utilization of image processing, edge detection analysis, and direct observation of stomata has never been done before.
This study provides for the first time a novel technique of stomata pore area observation and analysis with more accuracy, which improves previous techniques. In this study, the abaxial stomata of Rhoeo discolor plant is directly observed using a microscope where the leaves are still attached to the live plant. This preserves the leaves without detaching them from the main plant, hence, making this essentially a non-destructive measurement method. Moreover, the observations before, during, and after the SV treatments focus only on particular stomata without damaging it, hence, providing a direct comparison of the effect of SV towards the stomata. The stomata pore area analysis utilizes the microscope to capture the images of the stomata. The image is then processed using edge detector of the Canny operator software to show the boundary between the stomata pore and the guard cells. The result is a chain of pixel values that forms the stomata pore pattern of the Rhoeo discolor plant. Therefore, we can calculate the area of stomata pore in pixel unit giving an accurate measurement of the pore area. Thus, this study aims to determine the influence of sound on stomata pore movements via image processing using the edge detection analysis.
2. Research method
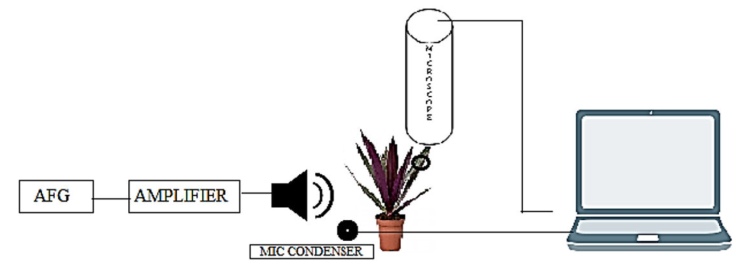
This research was conducted for seven months from the month of June to December 2020. There were two steps of image capture and image analysis that were done alternately in the Vibration and Wave laboratory in Physics Education Department, Universitas Negeri Yogyakarta. The object of this study was the abaxial leaves of Rhoeo discolor plant. The image capture was done using Dino-lite AM4515T series 20x-220x microscope and Dinocapture 2.0 software. The SV was produced by a set of CSi-Speco SS-1 Audio Frequency Generator (AFG), Uchida TA-2MS Amplifier, a loudspeaker, Philips mic condenser, and SpectraPLUS 5.0. The image analysis used a laptop, which has Matlab R2008a, Origin 8.0, Microsoft Excel 2010, and Microsoft Word 2010. In this study, the population used was three Rhoeo discolor plants. All three plants came from the same parent plant. Moreover, the sample was one leaf from each of the plant.
In this study, the independent variable was the sound frequency, ranging from 1 to 7 kHz, with an interval of 1 kHz. Moreover, the dependent variables were the stomata pore area during and after the SV exposures in pixel unit. The control variables were the room temperature (28ºC), observation time (at 10.00 AM to 2.00 PM in dry season), microscope position, water availability for the plant, stomata pore area before exposure, and light and sound intensities. The light intensity was controlled by having the same and constant light sources in a closed room, which came from a room lamp and the microscope. The room temperature and the humidity were controlled by conducting the experiment in the same room and at the same time for several days in the dry season. Moreover, before the experiment was conducted the plants were watered and left alone for several hours to ensure the availability of water for the plants.
The experimental setup may be observed in Fig. 1. Sound (SV) was produced by an AFG that was amplified with an amplifier and connected to a speaker (left part of Fig. 1). The SV with a single frequency was exposed to the plant (middle part of Fig. 1). Between the speaker and the plant, a mic condenser was placed and connected to the laptop. Finally, the microscope was positioned above the plant and connected to the laptop as well (right part of Fig. 1).
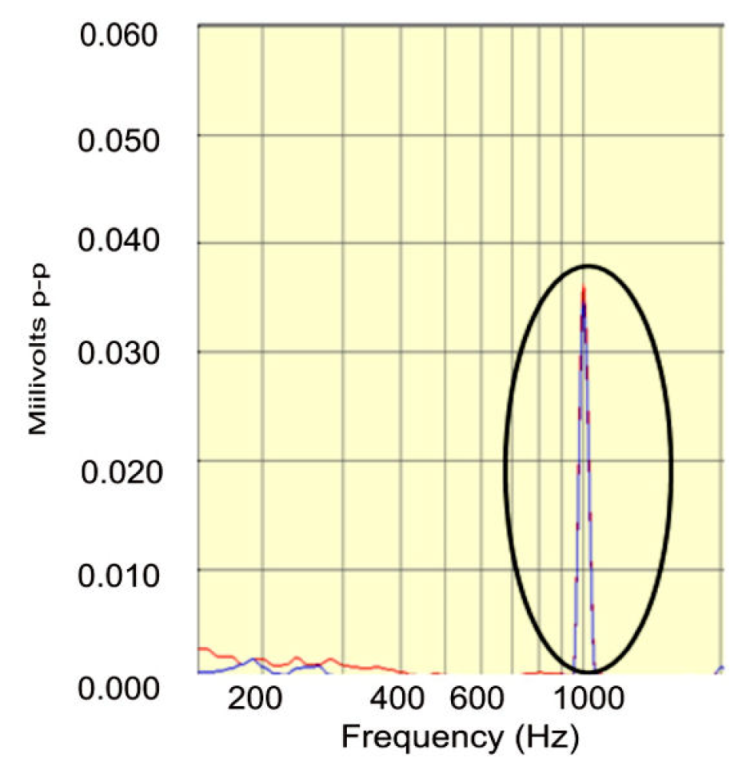
The image capture process was initially conducted by determining the SV frequency exposed to the plant. The frequency setting was conducted using SpectraPLUS 5.0. The SV exposed to the leaf had intensity and frequency ranges of approximately 0.10 to 0.45 mV and 1000 to 7000 Hz, respectively. An example of a single frequency of 1000 Hz can be observed in Fig. 2. The single frequency was in the form of as a sharp peak or a pulse. The next step was observing the stomata pore area using the Dino-lite AM4515T series: 20x-220x microscope. Before the SV exposure, the stomata were observed for 5 minutes to adapt with the condition. After that, the SV was exposed to the stomata for 5 minutes. Finally, after the SV exposure, the stomata were observed for further 5 minutes. Hence, the entire recording of the stomata was 15 minutes. The images were taken (from the recording) every 1.5 minutes; so 10 images of data were obtained consisting of 3 data before and during the SV exposures, and 4 data after the SV exposure. The observation and image capture process above were conducted upon one stomata on one leaf of each plant. This was because once one of the leaves was already observed for one of its stomata, then other leaves will already be affected by the observation. Hence, repeated measurement cannot be conducted upon the same plant.
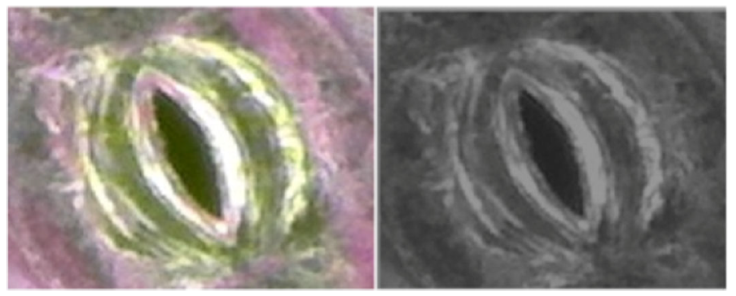
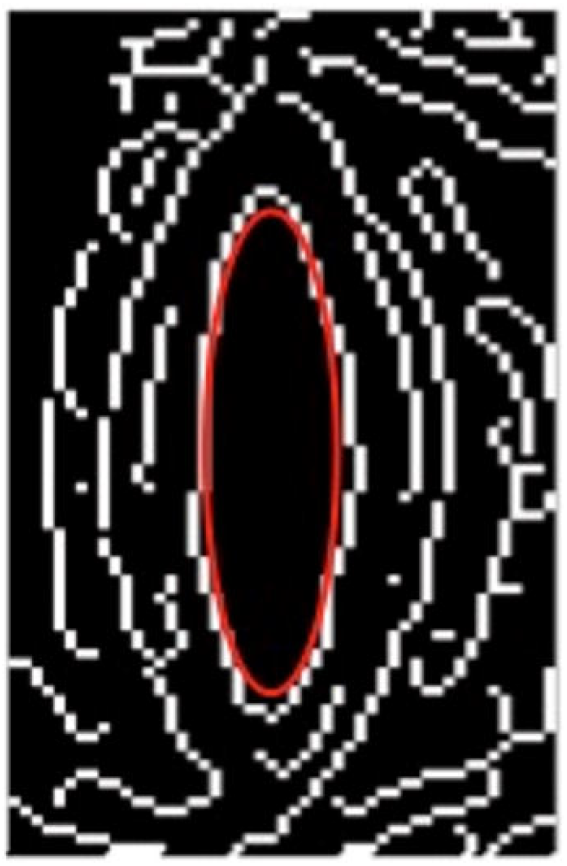
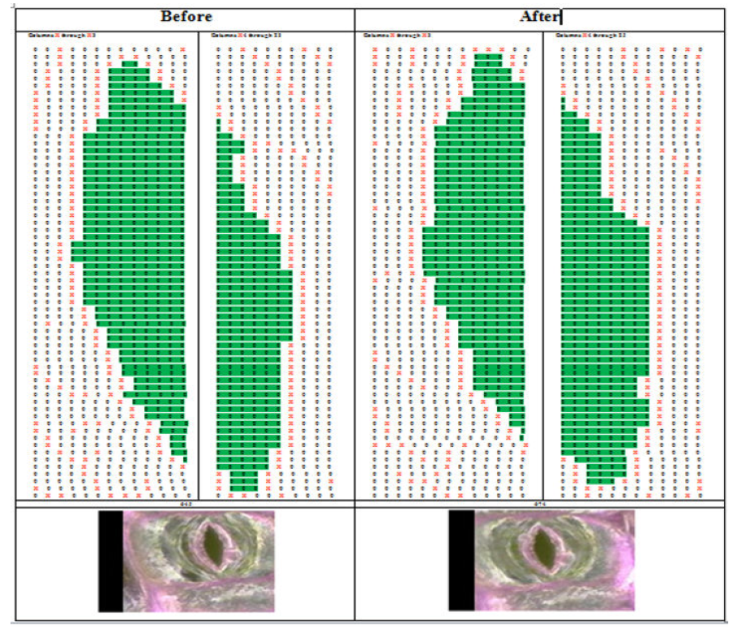
Furthermore, the area of stomata pore was determined using MatlabR2008a, Microsoft Word 2010, and Origin 8.0. This consisted of five steps. First, image cropping was conducted by cutting the images obtained from the microscope. This was aimed to narrow the observation field (see Fig. 3). The size of the image being cropped was the same for all pictures, i.e. 150 × 150 pixels. Second, the Red Green Blue (RGB) image format, which originated from the microscope, was converted to the Grey Scale (GS) format. This conversion was required for the edge detection analysis. The conversion used MatlabR2008a. The result of this process may be observed in Fig. 4. Third, the GS image was analyzed via the edge detector of the Canny operator to show the edge pattern of the stomata pore that had been observed. Hence, we could observe the pattern of the stomata in black and white patterns. The observation was convenient because the pixel value was only 1 (white) or 0 (black). The next step was to decide the coordinate of the stomata pore. This was aimed to show the value of the whole stomata that would be calculated. Finally, the last step was to calculate the area of stomata pore in the pixel unit. This was conducted by summing the number of pixels valued at 0 surrounded by pixels of 1.
We also represented the data in the form of the increase (or decrease) of the stomata pore area with respect to the frequency of the SV exposure. This was obtained by averaging the stomata pore area before, during, and after the SV exposures for all frequencies. Then, the averaged values of the stomata pore area during and after the SV exposures were substractred with the averaged value of the stomata pore area before sound exposure. This was then presented in the form of graphs.
3. Results and analysis
The stomata observation results are given in Fig. 5 for the SV exposure frequency of 6000 Hz. As explained in the method section, the stomata images are taken for a total of 15 minutes with an interval of 1.5 minutes, i.e. images of Figs. 5a)-c) (a total of 4.5 minutes before exposure); Figs. 5d)-f) (a total of 4.5 minutes during exposure); and Figs. 5g)-j) (a total of 6 minutes after exposure). The pore area of the stomata may be observed as the dark-oval region around the guard cells (oval-pink region). It may be qualitatively observed that during and after the SV exposures, the stomata pore area is larger compared to the stomata pore area before the SV exposure. Before the SV exposure, the stomata are already opened due to the light that comes from the microscope. Hence, it is expected that during and after the SV exposures, the stomata pore area is increased. Now, just by observing Figs. 5a)-j), we might not see any difference in the stomata pore areas. Even calculating the stomata pore area using simple length measurement apparatuses, such as a ruler, may give inaccurate results. Therefore a more accurate measurement method via edge detection is applied.
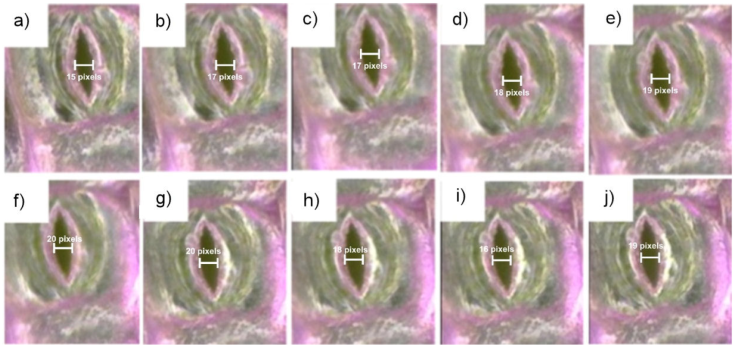
Figure 5 Stomata observation before a)-c), during d)-f), and after g)-j) the sound exposure, with 1.5 minutes time interval.
The main results obtained in this study are the edge detection images of the abaxial leaves of Rhoeo discolor plant stomata, which are given in Fig. 6. The images are obtained by transforming the RGB recorded stomata images (Fig. 5) via a coding in the Matlab software. The images consist of edges represented by the white contour lines. Moreover, the images of Figs. 6a) to e) were obtained from the first order edge detection of Robert [38], Sobel [39], Prewitt [40], Laplacian of Gaussian (LoG-second order) [41], and Canny [40] operators. It is clearly shown that the Canny operator (Fig. 6e)) provides the best image compared to other images (Figs. 6a)-d)). Hence, the Canny operator gives the best edge result. Moreover, the Canny operator has a better accuracy compared to Prewitt operator [39]. The former performs better than Sobel and Robert operators in detecting brain tumor resulted from MRI [42,43], gives better edge intensity [44], and better result for colored image [45]. Moreover, the Canny operator is suitable for object recognition and image pattern adjustment with large noise [46]. Hence, further image processing is conducted upon the images resulted from the Canny operator, which is given in Fig. 7. The area inside the red oval line (dark region) shows an example of the stomata pore area that is being observed and calculated. The white oval-like profile adjacent to the red oval line is the edges between the stomata pore and the guard cells. The dark region between two adjacent white oval-like profiles closest to the red oval line are the guard cells.
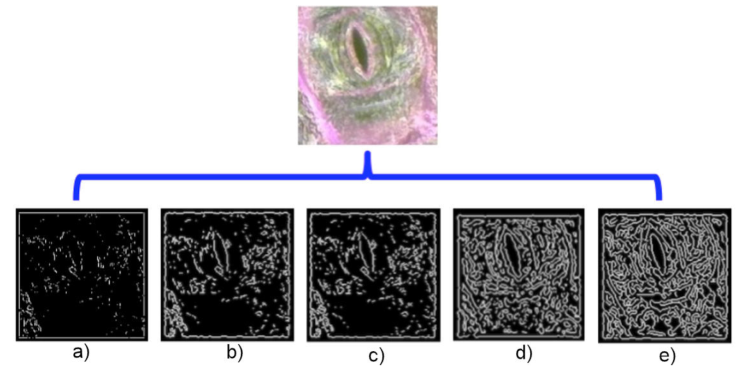
Figure 6 Various edge detection operator results of the abaxial leaves of Rhoeo discolor plant stomata, i.e. a) Roberts, b) Sobel, c) Prewitt, d) LoG, and e) Canny operators.
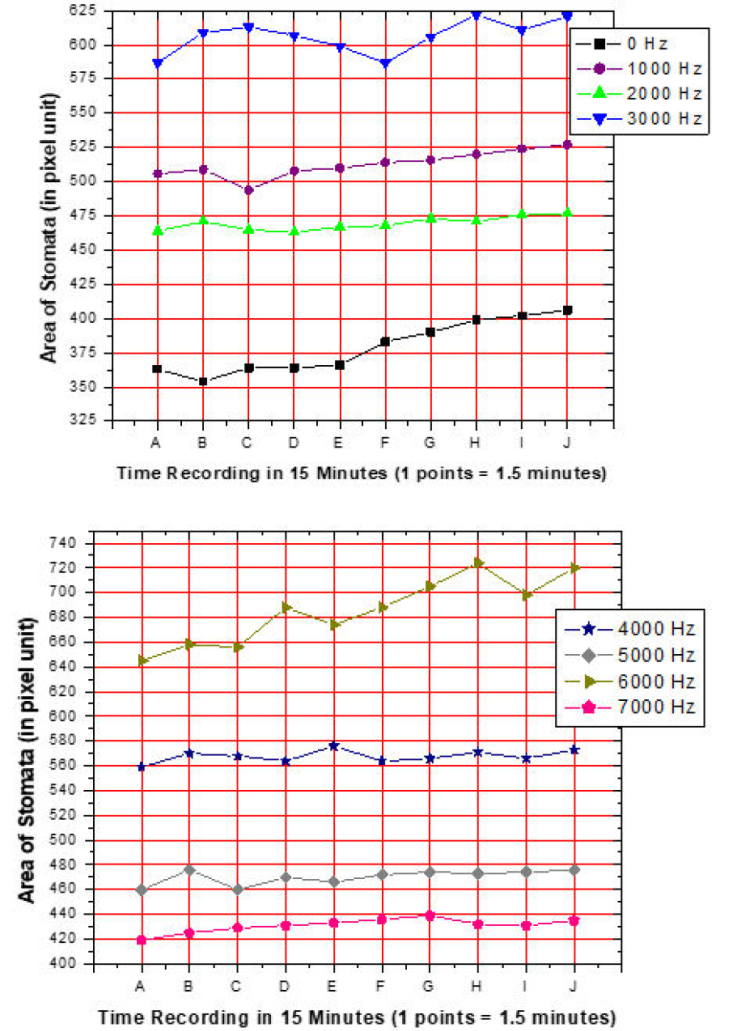
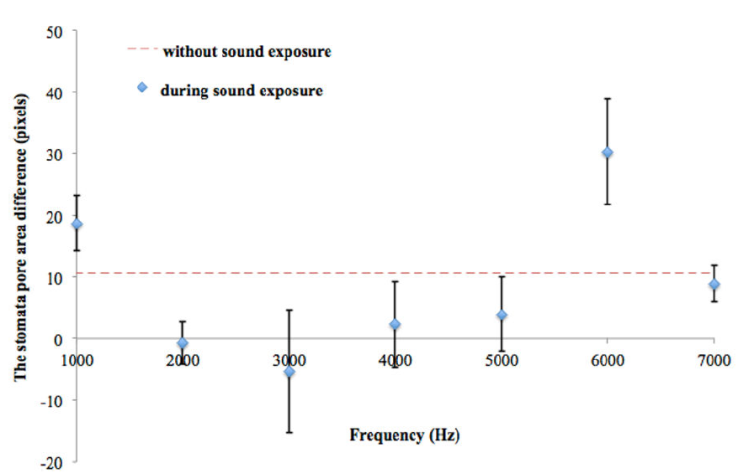
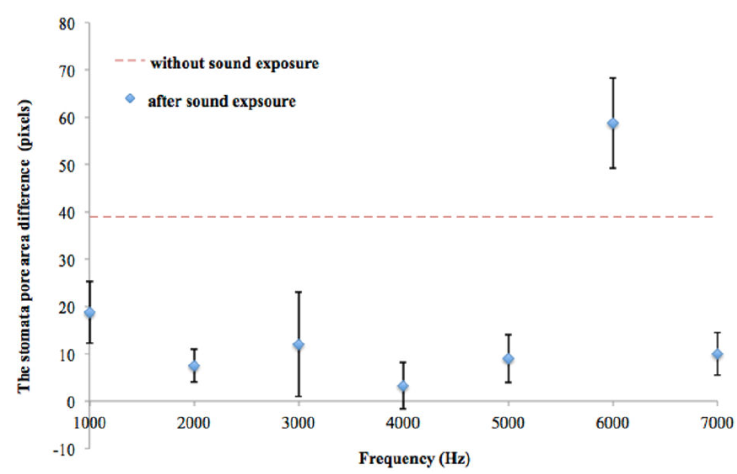
The obervation results of the stomata pore areas before (a-c), during (d-f), and after (g-j) SV exposures for various frequencies may be oberved in Fig. 9. The numerical results of the stomata pore areas are given in Table I. It may be observed that for frequencies of 0 Hz to 3000 Hz, the stomata pore areas tend to increase as time increases, i.e. before, during, and after the SV exposures. The best increase of the stomata pore area during and after SV exposures is obtained for the frequency of 6000 Hz. On the other hand, for the frequencies of 4000 Hz, 5000 Hz, and 7000 Hz, the stomata pore areas seem to be relatively flat, which indicate small or no effect of SV exposures toward the pore area of stomata. This finding further indicates that not all frequencies affect the stomata movement. In fact, only a single frequency that clearly increases the pore area of the stomata. This is seen from the increase (and decrease) of the stomata pore area during and after SV exposures given in Figs. 10 and 11, respectively. The numerical data are given in Tables II and III.
Table I The stomata pore area before, during, and after SV with frequencies of 0 - 7000 Hz.
| points | 0 Hz | 1000 Hz | 2000 Hz | 3000 Hz | 4000 Hz | 5000 Hz | 6000 Hz | 7000 Hz | ||||||||||||||
|---|---|---|---|---|---|---|---|---|---|---|---|---|---|---|---|---|---|---|---|---|---|---|
| A | 363 | 506 | 464 | 587 | 559 | 460 | 645 | 419 | ||||||||||||||
| B | 354 | 509 | 471 | 609 | 570 | 476 | 658 | 425 | ||||||||||||||
| C | 364 | 494 | 465 | 613 | 568 | 460 | 656 | 429 | ||||||||||||||
| D | 364 | 508 | 463 | 607 | 564 | 470 | 688 | 431 | ||||||||||||||
| E | 366 | 510 | 467 | 599 | 576 | 466 | 674 | 433 | ||||||||||||||
| F | 383 | 514 | 468 | 587 | 564 | 472 | 688 | 436 | ||||||||||||||
| G | 390 | 516 | 473 | 606 | 566 | 474 | 705 | 439 | ||||||||||||||
| H | 399 | 520 | 471 | 622 | 571 | 473 | 724 | 432 | ||||||||||||||
| I | 402 | 524 | 476 | 611 | 566 | 474 | 698 | 431 | ||||||||||||||
| J | 406 | 527 | 477 | 621 | 573 | 476 | 720 | 435 | ||||||||||||||
Points A-C (red): Before sound exposure. Points D-F (yellow): During sound exposure. Points G-J (green): After sound exposure.
Table II The numerical data of stomata pore area increase (or decrease) during the SV exposure.
| Frequency (Hz) | Stomata pore area before SV exposure (cm) | Stomata pore area during SV exposure (cm) | Stomata pore area difference (cm) |
|---|---|---|---|
| 0 | 360.3 | 371.0 | 10.7 |
| 1000 | 503.0 | 510.7 | 18.8 |
| 2000 | 466.7 | 466.0 | -0.7 |
| 3000 | 603.0 | 597.7 | -5.3 |
| 4000 | 565.7 | 568.0 | 2.3 |
| 5000 | 465.3 | 469.3 | 4.0 |
| 6000 | 653.0 | 683.3 | 30.3 |
| 7000 | 424.3 | 433.3 | 9.0 |
Table III The numerical data of stomata pore area increase (or decrease) after the SV exposure.
| Frequency (Hz) | Stomata pore area before SV exposure (cm) | Stomata pore area after SV exposure (cm) | Stomata pore area difference (cm) |
|---|---|---|---|
| 0 | 360.3 | 399.3 | 38.9 |
| 1000 | 503.0 | 521.8 | 18.8 |
| 2000 | 466.7 | 474.3 | 7.6 |
| 3000 | 603.0 | 615.0 | 12.0 |
| 4000 | 565.7 | 569.0 | 3.3 |
| 5000 | 465.3 | 474.3 | 8.9 |
| 6000 | 653.0 | 711.8 | 58.8 |
| 7000 | 424.3 | 434.3 | 9.9 |
Now, we may observe the difference of the stomata pore area with respect to the frequency during and after SV exposures. The dashed-red lines in Figs. 10 and 11 are the averaged values of the stomata pore area difference without SV exposures. It may be observed that Figs. 10 and 11 are quite similar in their profiles. This means that the stomata pore area differences during and after SV exposures behave in a similar manner. During SV exposure (Fig. 10), the decrease of the stomata pore area is obtained at frequencies of 2000 and 3000 Hz. The increase of stomata pore area but smaller than the increase of the stomata pore area without sound exposure is obtained at frequencies of 4000 and 5000 Hz. Finally, the highest increase of the stomata pore area is obtained at a frequency of 6000 Hz. These characteristics are similar to Fig. 11, except that no decrease of the stomata pore area is observed and only at the frequency of 6000 Hz that the stomata pore area is higher than the stomata opening area without SV exposure.
From the results above, the edge detection method shows once again that SV, especially its frequency, affects plants, especially the pore area of stomata. A further inspection via the edge detection method indicates that a single frequency can optimally open the stomata, especially for Rhoeo discolor plant. This supports the application of single frequency exposure of SV towards plants as extensively discussed in Ref. [47]. Moreover, it is also stated in Ref. [47] that plants respond to SV by adjusting their behaviour at the physiological and morphological levels an thus may have ecological effects. This is in accordance with this study where the movement of the stomata is considered as physiological behaviour and thus Rhoeo discolor plant percevies the SV by opening and/or closing its stomata. Moreover, according to a study in Ref. [48], the various reasons of the stomata opening caused by SV are i) the activation of certian genes in the cells; ii) resonance of the stomata pore; and iii) cavitation by producing microbubbles. However, there is still no consensus on which of the reasons best provides an explanation for the effect. On the other hand, lower frequencies of SV tend to have non or even negative effects on the stomata, i.e. the closing of the stomata. This is, in fact, in accordance to a study in Ref. [49] where the effect of SV towards the amount of flavonoid produced by sprouts is studied. A low frequency of 0.25 kHz gives a negative impact on the amount of flavonoid in the sprouts.
Finally, we may also compare the effect of SV and light sources upon the stomata. We deduce that the effect of SV is weaker than the effect of the light source from the microscope upon the stomata of Rhoeo dicolor plant. Without SV, i.e. only the light source from the microscope, the stomata show a tendency to always open. However, using SV, the stomata may be opened or closed. Hence, the wavelength and intensity of light are dominant in influencing the movement of stomata. This is because inside the stomata there are many light receptors that affect the movement of the stomata. On the other hand, this is still unclear for SV.
4. Conclusion
This study has used a direct observation focused on the lower (abaxial) stomata of Rhoeo discolor plant. The analysis of stomata pore area uses the edge detection. The edge detection analysis provides more accurate and convincing results than the analytical techniques from previous studies. This technique is able to answer doubts about the relationship between SV exposure and stomata pore area. The edge detection analysis only uses a microscope that captures images without damaging or using chemicals on the stomata. The Canny edge detection operator determines the stomata edge pattern by removing noise without destroying the original shape of the captured image. Edge detection analysis is also able to determine the entire area of the stomata opening area in pixel unit, where previous studies still focused on the diameter of the stomata opening area and the elliptic approach. The results of the analysis show that the frequencies of 2000 and 3000 Hz have the effect of decreasing the stomata pore area. On the other hand, the frequency of 6000 Hz gives the greatest effect on the stomata pore area. Therefore, it can be concluded that SV does effect the stomata pore movement but only at a specific frequency. Moreover, there is no simple linearity between the SV exposure and the area of the stomata pore. Further study with variations in stomata types is encouraged. Moreover, further study may display the scale in length unit, e.g. cm, mm, or micron, rather than in pixel unit using some conversion method.


 nueva página del texto (beta)

