1. Introduction
Over the recent past, our team has systematically performed CCD photometry of selected globular clusters aimed to update the variable star census and to use the light curves of the RR Lyrae stars to estimate the mean distance and metallicity of the cluster in a homogeneous scale, and to investigate the dependence of the luminosity of the horizontal branch (HB) on the metallicity of the stellar system. A summary of the results for a group of some 26 globular clusters has been presented by Arellano Ferro, Bramich & Giridhar (2017). In the present paper we report the results of the analysis of the variable star population of the globular cluster NGC 6934 (C2031+072 in the IAU nomenclature) (α=20h34m11.4S, δ=+07°24´16.1´´, J2000; l = 52.10°, b = −18.89°) based on time-series CCD photometry. Despite its richness in variable stars, the first variables in this cluster were discovered rather late in the 20th century. The first 51 variables were reported by Sawyer Hogg (1938). These stars were further studied and classified by Sawyer Hogg & Wehlau (1980); fifty turned out to be RR Lyrae stars and one (V15) was recognized as a possible irregular variable. Sixty three years passed without the variables in this cluster receiving further attention in the literature. Kaluzny, Olech & Stanek (2001) (hereafter KOS01) performed a time-series CCD photometric study of the cluster and discovered 35 new variables; 29 RR Lyrae stars, two eclipsing binaries or EW’s, two long-period semi-regular variables or L-SR, one SX Phe and one unclassified (V85). The identifications of all these stars can be found in the original chart of Sawyer Hogg (1938) and the small image cutouts published by KOS01. Their equatorial coordinates are listed in the Catalogue of Variable Stars in Globular Clusters (CVSGC) of Clement et al. (2001).
In this paper we describe our observations and data reductions as well as the transformation to the Johnson-Kron-Cousins photometric system (§ 2); we perform the identification of known variables and report discovery of a few new ones (§ 3); we calculate the physical parameters via the Fourier decomposition for RR Lyrae stars (§ 4); highlight the properties of the SX Phe stars (§ 5); estimate the distance to the cluster via several methods based on different families of variable stars (§ 6); discuss the structure of the Horizontal Branch (§ 7); and summarize our results (§ 8). Finally, in Appendix A we discuss the properties and classification of a number of variables that require further analysis to characterize them.
2. Observations and reductions
2.1. Observations
The Johnson-Kron-Cousins V and I observations used in the present work were obtained between August 2011 and October 2016 with the 2.0 m telescope at the Indian Astronomical Observatory (IAO), Hanle, India, located at 4500 m above sea level in the Himalaya. The detector used in HFOSC is 4K × 2K CCD using a SITe002 chip with a pixel size of 15μ2, an imaging area limited to 2048 × 2048 pixels and an image scale of 0.296 arsec/pixel, translating to a field of view (FoV) of approximately 10.1×10.1 arcmin2. Our data consist of 198 V and 201 I images. Table 1 gives an overall summary of our observations and the seeing conditions.
Table 1 The distribution of observations of NGC 6934.*
| Date | NV | tV (s) | NI | tI (s) | Avg seeing (”) |
|---|---|---|---|---|---|
| 2011-08-05 | 16 | 120-140 | 16 | 20-35 | 1.7 |
| 2011-08-06 | 20 | 110-170 | 22 | 20-45 | 1.6 |
| 2011-08-07 | 6 | 100-200 | 5 | 25-60 | 1.9 |
| 2012-10-20 | 20 | 100-200 | 20 | 20-80 | 3.1 |
| 2012-10-21 | 40 | 60-80 | 43 | 15-70 | 2.0 |
| 2014-08-03 | 4 | 90 | 3 | 30 | 1.7 |
| 2014-08-05 | 20 | 70 | 20 | 30 | 1.7 |
| 2016-10-02 | 34 | 30 | 36 | 10 | 2.0 |
| 2016-10-03 | 38 | 30 | 36 | 10 | 2.1 |
| Total: | 198 | 201 |
*Columns NV and NI give the number of images taken with the V and I filters respectively. Columns tV and tI provide the exposure time, or range of exposure times. In the last column the average seeing is listed.
2.2. Difference Image Analysis
Image data were calibrated using bias and flatfield correction procedures. We used the Difference Image Analysis (DIA) to extract high-precision timeseries photometry in the FoV of NGC 6934. We used the DanDIA3pipeline for the data reduction process (Bramich et al. 2013), which includes an algorithm that models the convolution kernel matching the PSF of a pair of images of the same field as a discrete pixel array (Bramich 2008). A detailed description of the procedure is available in the paper by Bramich et al. (2011), to which the interested reader is referred for the relevant details.
We also used the methodology developed by Bramich & Freudling (2012) to solve for the magnitude offset that may be introduced into the photometry by the error in the fitted value of the photometric scale factor corresponding to each image. The magnitude offset due to this error was small, of the order of ≈ 2−5 mmag.
2.3. Transformation to the VI Standard System
While in the season of 2011 the cluster was centered in the CCD, in 2012, 2014 and 2016 we observed the cluster slightly off center in the CCD in order to avoid the very bright star to the west of the cluster. We shall refer to these two setting as A and B. We have treated these setting as independent, each with its own set of standard stars and transformation equations to the standard system.
From the standard stars of Stetson (2000) 4in the field of NGC 6934, we identified 58 and 80 standard stars in the FoV of our settings A and B respectively, with V in the range 13.9-20.6 mag and V − I within −0.17-2.37 mag. These stars were used to transform our instrumental system to the Johnson-KronCousins photometric system (Landolt 1992). The standard minus the instrumental magnitude differences show a mild dependence on the colour as displayed in Figure 1 for both settings. The transformation equations are of the form:
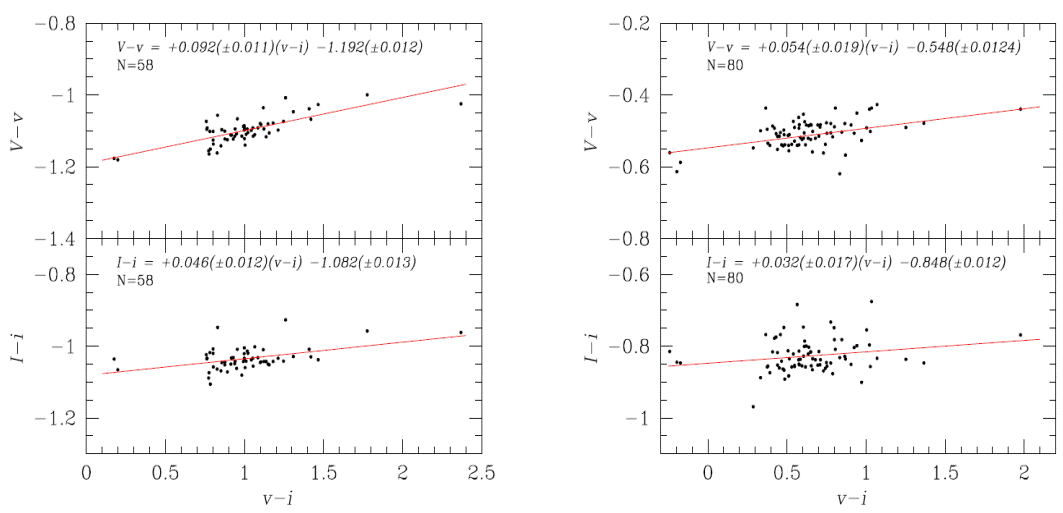
Fig. 1 The transformation relationship between the instrumental and standard photometric systems using a set of standards of Stetson (2000) in the FoV of our images of NGC 6934 for settings A (left panel) and B (right panel).
For setting A;
For setting B;, in 2012, 2014 and 2016 we observed the cluster slightly off center in the CCD.
We note the zero point differences in the above transformation equations for each of the two settings, for both filters. This is in spite having used a large number of standard stars in common. The reason for this is that, for each setting a different reference image was used, each with is town quality. The zero point offsets indicate that one of the reference images was built from images taken under different transparency conditions, thus producing two independent instrumental magnitude systems. Once the instrumental magnitudes of each setting are converted into the standard system, the light curve matching between the two settings is very good, as can be seen in Figures 2 and 3.
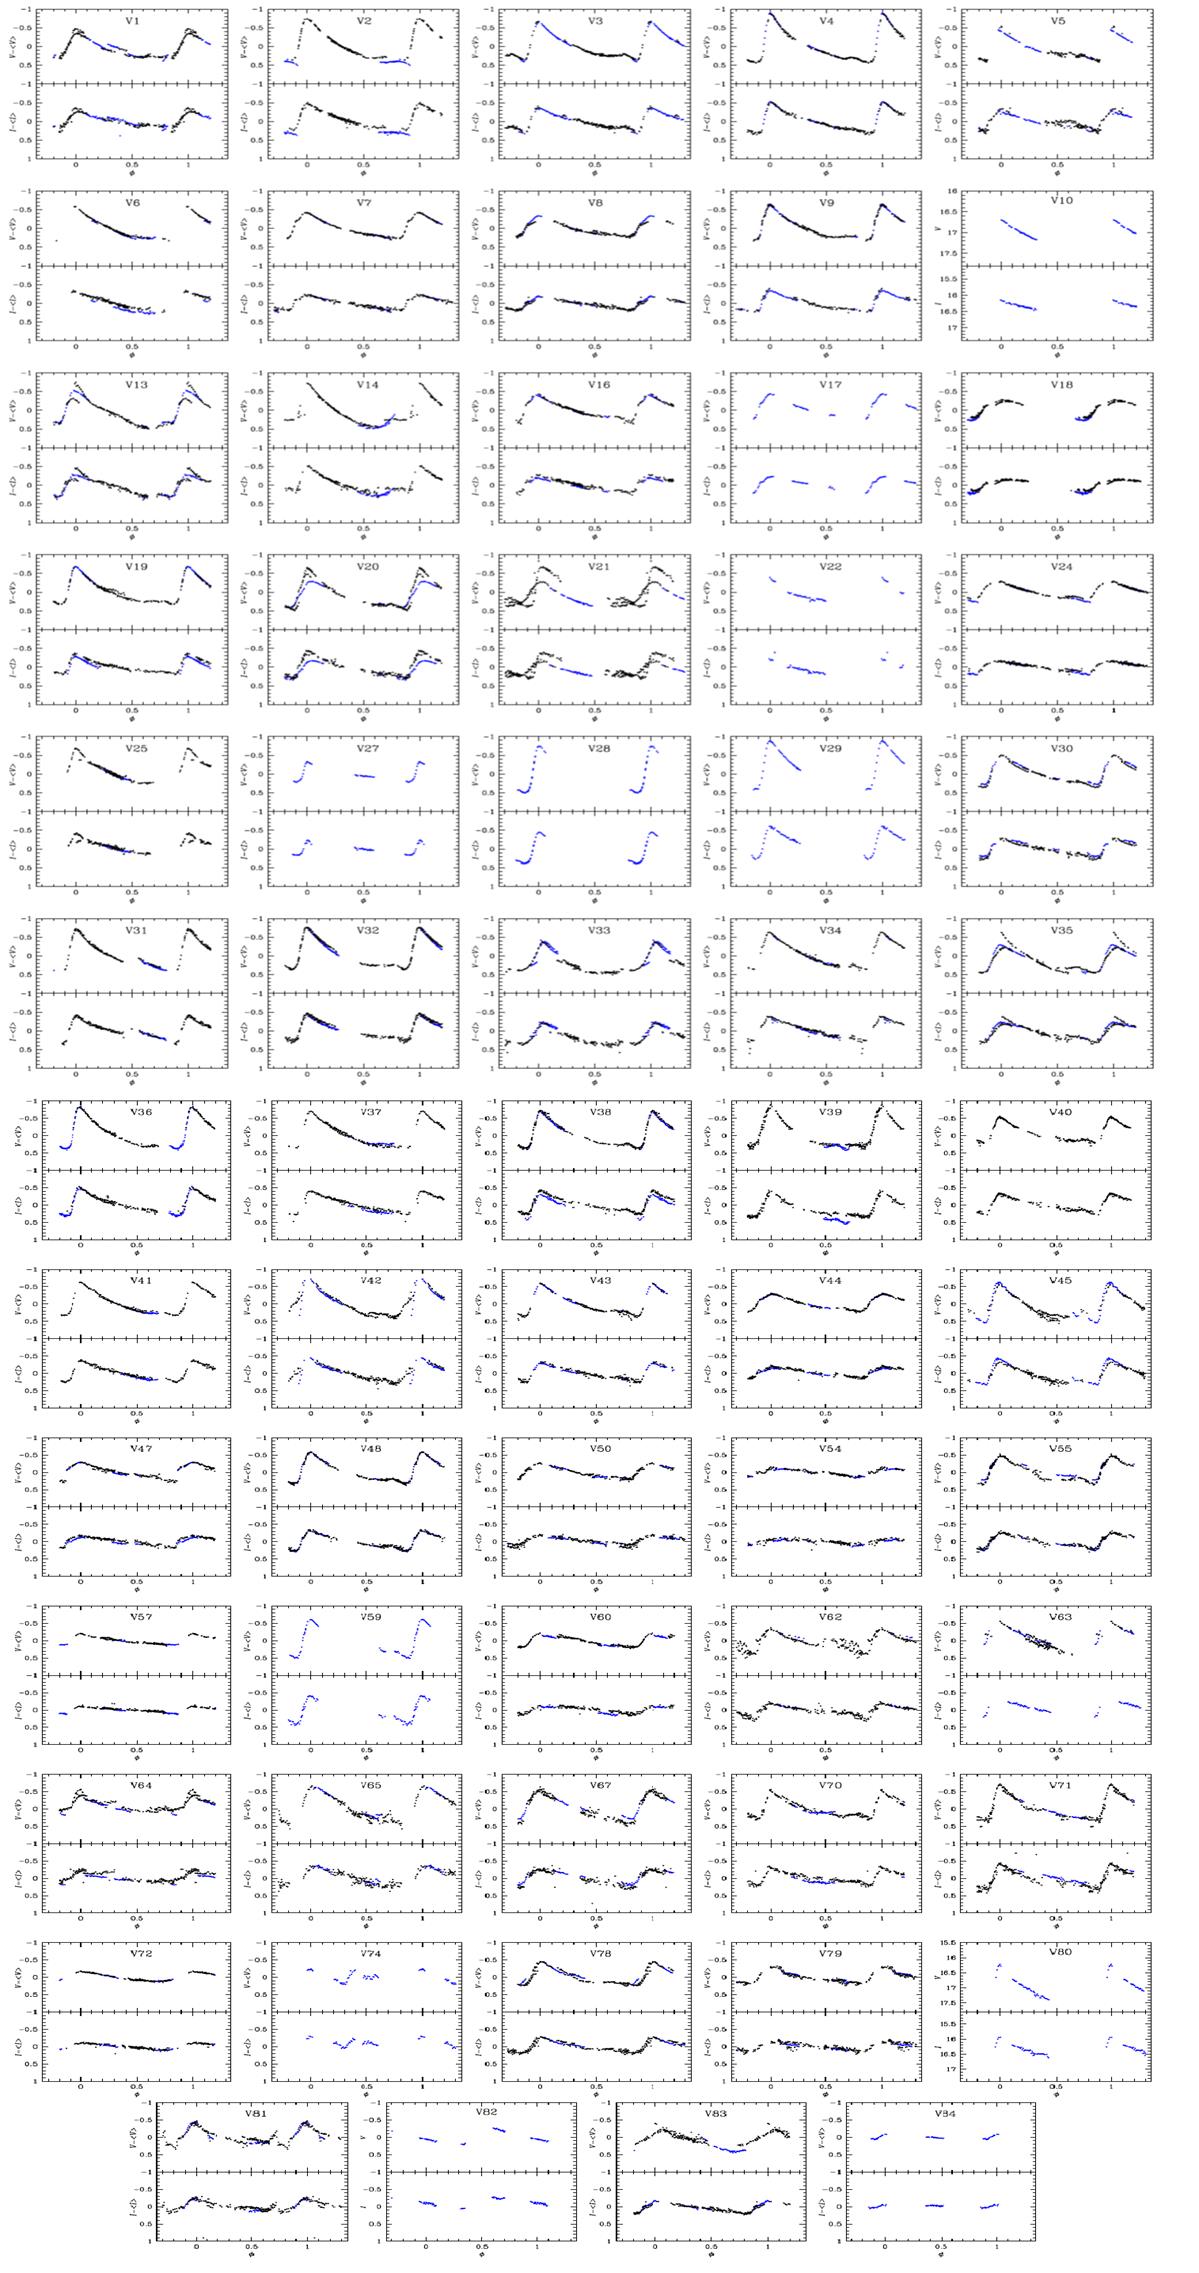
Fig. 2 Light curves of the RRab stars in our FoV phased with the periods listed in Table 2. In order to appreciate the amplitude differences from star to star, the vertical axis displays V − < V > and I− < I >. The intensity-weighted means are listed in Table 2. Blue symbols correspond to data from setting A and black to data from setting B. See text in Appendix A for a discussion of some individual stars. The color figure can be viewed online.
3. Variable stars in NGC 6934
The variable stars in our FoV are listed in Table 2 along with their mean magnitudes, amplitudes, and periods derived from our photometry. The coordinates listed in Columns 10 and 11 were taken from the CVSGC, and were calculated by KOS01. For comparison we include in Column 7, the periods as listed by KOS01, and it should be noted that in some cases the periods are significantly different from the ones found from our data. For stars with light curves poorly covered by our photometry we have adopted the period of KOS01. The light curves of the RR Lyrae stars are shown in Figures 2 and 3. Unfortunately, due to poor seeing conditions in some nights of setting B, we were not able to calculate an accurate reference flux, hence we could not recover the magnitudes scale light curve for some variables with particularly bad blending conditions.
Table 2 General data for all of the confirmed variables in ngc 6934 in the fov of our images.*
| Variable Star ID | Variable Type | < V > (mag) | < I > (mag) | AV (mag) | AI (mag) | P (KOS01) (d) | HJDmax (+2 450 000) | P (this work) (d) | RA (J2000.0) | Dec (J2000.0) |
|---|---|---|---|---|---|---|---|---|---|---|
| V1 | RRab Bl | 16.80 | 16.28 | 0.805 | 0.638 | 0.56751 | 6875.4072 | 0.600391 | 20:34:08.4 | 07:23:39 |
| V2 | RRab | 16.952 | 16.398 | 1.093 | 0.726 | 0.481947 | 7665.0944 | 0.481992 | 20:34:08.6 | 07:24:02 |
| V3 | RRab | 16.912 | 16.320 | 1.072 | 0.715 | 0.539806 | 7664.2940 | 0.539806 | 20:34:11.4 | 07:25:15 |
| V4 | RRab | 16.775 | 16.167 | 1.325 | 0.862 | 0.616422 | 5780.3908 | 0.616415 | 20:34:13.9 | 07:25:15 |
| V5 | RRab | 16.90 | 16.27 | 0.910 | 0.600 | 0.564560 | 7664.2520 | 0.559514 | 20:34:15.2 | 07:27:58 |
| V6 | RRab | 16.985 | 16.289 | 0.932 | 0.611 | 0.555866 | 6222.0656 | 0.555847 | 20:34:09.5 | 07:23:45 |
| V7 | RRab | 16.872 | 16.212 | 0.700 | 0.439 | 0.644049 | 6221.1532 | 0.644047 | 20:34:17.4 | 07:25:16 |
| V8 | RRab Bl | 16.893 | 16.222 | 0.576 | 0.385 | 0.623984 | 5780.4479 | 0.620522 | 20:34:18.0 | 07:25:08 |
| V9 | RRab | 16.965 | 16.320 | 0.967 | 0.6338 | 0.549156 | 6875.4291 | 0.549157 | 20:34:15.6 | 07:24:36 |
| V10 | RRab | - | - | - | - | 0.519959 | 5781.3595 | 0.518391 | 20:34:02.2 | 07:25:28 |
| V11 | RRc | 16.912 | 16.434 | 0.553 | 0.345 | 0.30867 | 7664.1126 | 0.308679 | 20:34:12.5 | 07:24:46 |
| V12 | RRab | 16.5 | - | 0.978 | - | 0.464215 | 7665.2551 | 0.894809 | 20:34:13.2 | 07:23:34 |
| V13 | RRab Bl | 16.87 | 16.26 | 1.227 | 0.778 | 0.551334 | 6222.1033 | 0.551333 | 20:34:08.1 | 07:24:42 |
| V14 | RRab | 16.80 | 16.309 | 1.162 | 0.785 | 0.521990 | 6222.0980 | 0.519406 | 20:34:10.9 | 07:22:47 |
| V15 | SR? | 13.773 | 12.068 | - | - | - | - | - | 20:34:11.9 | 07:23:25 |
| V16 | RRab | 16.896 | 16.264 | 0.768 | 0.462 | 0.604853 | 6873.3918 | 0.604866 | 20:34:13.7 | 07:24:36 |
| V17 | RRab | 16.927 | 16.270 | 0.766 | 0.443 | 0.598272 | 5780.4430 | - | 20:34:06.5 | 07:22:30 |
| V18 | CWB | 16.551 | 15.844 | 0.547 | 0.358 | 0.956070 | 6875.3521 | - | 20:34:14.6 | 07:24:09 |
| V19 | RRab | 16.645 | 15.95 | 1.014 | 0.557 | 0.480550 | 5780.3621 | 0.480569 | 20:34:13.2 | 07:24:19 |
| V20 | RRab Bl | 16.85 | 16.30 | 1.128 | 0.764 | 0.54833 | 7665.2570 | 0.548224 | 20:34:09.6 | 07:24:34 |
| V21 | RRab Bl | 16.95 | 16.31 | 1.051 | 0.650 | 0.526829 | 6873.4211 | - | 20:34:08.9 | 07:24:15 |
| V22 | RRab | 16.93 | 16.30 | - | - | 0.574280 | 5781.3595 | 0.545104 | 20:33:55.3 | 07:21:24 |
| V23 | RRc | 16.878 | 16.409 | 0.560 | 0.368 | 0.28643 | 6221.1657 | 0.286431 | 20:34:09.3 | 07:24:00 |
| V24 | RRab | 16.949 | 16.254 | 0.492 | 0.312 | 0.641670 | 7665.1914 | 0.641673 | 20:34:13.8 | 07:23:24 |
| V25 | RRab | 16.893 | 16.31 | 1.000 | 0.741 | 0.509086 | 7664.0792 | 0.509014 | 20:34:14.7 | 07:24:54 |
| V26 | RRc | 16.943 | 16.547 | 0.431 | 0.273 | 0.259318 | 7664.0931 | 0.259318 | 20:34:13.4 | 07:21:02 |
| V27 | RRab | 16.994 | 16.30 | 0.549 | 0.403 | 0.592204 | 5781.3595 | 0.637029 | 20:34:01.4 | 07:27:39 |
| V28 | RRab | 16.80 | 16.28 | 1.260 | 0.844 | 0.485151 | 5780.4334 | 0.485202 | 20:33:55.6 | 07:25:56 |
| V29 | RRab | 17.04 | 16.56 | 1.297 | 0.890 | 0.454818 | 5779.4387 | 0.455798 | 20:34:05.7 | 07:21:14 |
| V30 | RRab | 16.916 | 16.265 | 0.871 | 0.585 | 0.589853 | 7665.0688 | 0.589853 | 20:34:22.1 | 07:26:26 |
| V31 | RRab | 16.920 | 16.320 | 1.172 | 0.749 | 0.505070 | 7665.0944 | 0.505780 | 20:34:21.1 | 07:22:37 |
| V32 | RRab | 16.942 | 16.349 | 1.135 | 0.733 | 0.511948 | 6222.1420 | 0.511950 | 20:34:10.6 | 07:25:08 |
| V33 | RRab | 16.91 | 16.34 | 0.874 | 0.674 | 0.518445 | 6221.1771 | 0.507833 | 20:34:13.8 | 07:24:29 |
| V34 | RRab | 16.991 | 16.332 | 1.003 | 0.673 | 0.560103 | 6222.1441 | 0.560099 | 20:34:09.9 | 07:24:30 |
| V35 | RRab Bl | 16.75 | 16.25 | 1.104 | 0.707 | 0.544222 | 7665.0587 | 0.544220 | 20:34:21.9 | 07:21:56 |
| V36 | RRab | 16.884 | 16.301 | 1.181 | 0.833 | 0.495659 | 6875.3708 | 0.495660 | 20:34:12.1 | 07:23:41 |
| V37 | RRab | 17.009 | 16.336 | 1.056 | 0.671 | 0.533186 | 6222.1268 | 0.533188 | 20:34:12.9 | 07:24:28 |
| V38 | RRab | 16.907 | 16.266 | 1.126 | 0.707 | 0.523562 | 7665.1914 | 0.523559 | 20:34:12.2 | 07:23:59 |
| V39 | RRab | 16.983 | 16.26 | 1.212 | 0.777 | 0.502578 | 7665.2055 | 0.504174 | 20:34:11.9 | 07:24:00 |
| V40 | RRab | 16.616 | 16.166 | 0.813 | 0.616 | 0.560755 | 7664.0931 | 0.560781 | 20:34:10.7 | 07:24:44 |
| V41 | RRab | 16.980 | 16.348 | 0.957 | 0.649 | 0.520404 | 7664.1458 | 0.520446 | 20:34:13.3 | 07:23:38 |
| V42 | RRab | 16.869 | 16.304 | 1.149 | 0.790 | 0.524235 | 5780.3575 | 0.528068 | 20:34:15.0 | 07:24:39 |
| V43 | RRab | 16.969 | 16.285 | 0.965 | 0.573 | 0.563218 | 7664.2337 | 0.563183 | 20:34:12.8 | 07:24:45 |
| V44 | RRab | 16.941 | 16.280 | 0.505 | 0.354 | 0.630384 | 6875.3908 | 0.630383 | 20:34:08.5 | 07:23:48 |
| V45 | RRab | 16.80 | 16.30 | 1.178 | 0.761 | 0.53660 | 5779.3870 | 0.540324 | 20:34:09.2 | 07:24:08 |
| V46 | RRc | 16.933 | 16.455 | 0.441 | 0.303 | 0.328557 | 6222.1441 | 0.328557 | 20:34:12.3 | 07:23:53 |
| V47 | RRab | 16.921 | 16.229 | 0.422 | 0.316 | 0.640938 | 6222.0580 | 0.620252 | 20:34:12.0 | 07:23:52 |
| V48 | RRab | 16.922 | 16.275 | 0.895 | 0.626 | 0.561299 | 6222.2406 | 0.561319 | 20:34:13.5 | 07:25:08 |
| V49 | RRc | 16.98 | 16.5 | - | - | 0.285460 | 6222.1215 | 0.399840 | 20:34:12.2 | 07:23:22 |
| V50 | RRab | 16.984 | 16.32 | 0.507 | 0.368 | 0.634510 | 7664.1753 | 0.614237 | 20:34:12.4 | 07:23:41 |
| V51 | RRab | - | - | - | - | 0.564769 | 6875.4456 | 0.516442 | 20:34:11.8 | 07:24:52 |
| V52 | SX Phe | 18.943 | 18.482 | 0.471 | 0.330 | 0.05976 | 6875.4396 | 0.063563 | 20:34:18.3 | 07:22:14 |
| V53 | RRc | 16.973 | 16.489 | 0.600 | 0.333 | 0.28235 | 7665.1038 | 0.282377 | 20:34:13.6 | 07:24:00 |
| V54 | RRab | 16.750 | 16.051 | 0.282 | 0.210 | 0.59020 | 6873.4027 | 0.764917 | 20:34:12.6 | 07:24:35 |
| V55 | RRab | 16.998 | 16.276 | 0.824 | 0.508 | 0.77828 | 7664.1439 | 0.590251 | 20:34:13.3 | 07:24:27 |
| V56 | RRc Bl | 16.972 | 16.467 | 0.597 | 0.322 | 0.29104 | 5780.3667 | 0.291054 | 20:34:12.5 | 07:24:18 |
| V57 | CWB? | 15.839 | 15.000 | 0.331 | 0.224 | 0.68712 | 7664.0931 | 0.687174 | 20:34:12.4 | 07:24:10 |
| V58 | RRc | 16.757 | 16.205 | 0.452 | 0.264 | 0.40082 | 6221.2010 | 0.398628 | 20:34:12.1 | 07:25:05 |
| V59 | RRab | 16.928 | 16.441 | 1.125 | 0.831 | 0.53855 | 5779.4104 | 0.538044 | 20:34:12.0 | 07:24:15 |
| V60 | RRab | 16.895 | 16.22 | 0.397 | 0.25 | 0.66040 | 7664.29398 | 0.654264 | 20:34:12.0 | 07:24:56 |
| V61 | RRc | 16.890 | 16.305 | 0.544 | 0.284 | 0.528 | 5780.3574 | 0.355146 | 20:34:11.9 | 07:23:10 |
| V62 | RRab | 16.896 | 16.264 | 0.715 | 0.452 | 0.53067 | 6873.4210 | 0.530633 | 20:34:11.7 | 07:24:26 |
| V63 | RRab | 16.942 | 16.23 | 1.095 | 0.45 | 0.57564 | 7665.0587 | 0.562610 | 20:34:11.6 | 07:24:26 |
| V64 | RRab Bl | 16.555 | 15.90 | 0.641 | 0.433 | 0.57102 | 7664.2847 | 0.567969 | 20:34:11.4 | 07:24:18 |
| V65 | RRab | 16.988 | 16.346 | 1.156 | 0.606 | 0.65905 | 6221.2514 | 0.640858 | 20:34:11.4 | 07:24:15 |
| V66 | RRab? | - | - | - | - | 0.54078 | 5781.3805 | - | 20:34:11.1 | 07:24:16 |
| V67 | RRab | 17.223 | 16.468 | 0.935 | 0.525 | 0.61333 | 6222.1595 | 0.613381 | 20:34:10.9 | 07:23:55 |
| V68 | RRc | 16.432 | 15.48 | 0.520 | - | 0.33534 | 7665.0778 | 0.335344 | 20:34:10.9 | 07:24:00 |
| V69 | RRc ? | 16.925 | 16.502 | 0.41 | 0.12 | 0.24700 | 6221.2010 | 0.245633 | 20:34:10.8 | 07:23:15 |
| V70 | RRab | 16.773 | 16.088 | 0.845 | 0.557 | 0.53935 | 7665.1291 | 0.528880 | 20:34:10.7 | 07:24:06 |
| V71 | RRab | 16.953 | 16.373 | 1.041 | 0.769 | 0.57269 | 6222.1595 | 0.563084 | 20:34:10.7 | 07:23:54 |
| V72 | RRab | 16.885 | 16.208 | 0.277 | 0.206 | 0.66785 | 7664.0914 | 0.672084 | 20:34:10.5 | 07:25:20 |
| V73 | RRd | 17.01 | 16.43 | 0.431 | 0.284 | 0.50621 | 7665.2983 | - | 20:34:09.8 | 07:24:47 |
| V74 | RRab | 17.0 | 16.5 | 0.46 | 0.33 | 0.56813 | 6873.4210 | - | 20:34:09.3 | 07:24:08 |
| V75 | EW | 16.91 | 16.17 | 0.27 | 0.23 | 0.28207 | 5780.4004 | - | 20:34:02.8 | 07:19:35 |
| V76 | EW | 17.94 | 17.62 | 0.34 | 0.22 | 0.33649 | 5779.4387 | - | 20:33:54.6 | 07:19:50 |
| V77 | L | - | - | - | - | - | - | - | 20:34:10.5 | 07:24:24 |
| V78 | RRab | 16.492 | 16.022 | 0.694 | 0.484 | 0.54230 | 6222.1846 | 0.557881 | 20:34:12.1 | 07:24:38 |
| V79 | RRab | 16.843 | 16.130 | 0.503 | 0.298 | 0.62187 | 7664.2355 | 0.638841 | 20:34:10.5 | 07:24:24 |
| V80 | RRab | - | - | - | - | 0.54427 | 5781.3805 | 0.542778 | 20:34:11.7 | 07:24:07 |
| V81 | RRab | 16.92 | 16.19 | 0.69 | 0.40 | 0.57262 | 6875.4456 | 0.617816 | 20:34:11.2 | 07:24:23 |
| V82 | RRab | 16.9 | 16.3 | - | - | 0.73113 | 7665.2486 | 0.73113 | 20:34:10.7 | 07:24:17 |
| V83 | RRab | 16.70 | 16.20 | 0.662 | 0.399 | 0.54055 | 6222.0580 | 0.529951 | 20:34:11.2 | 07:24:26 |
| V84 | RRab | 16.535 | 15.79 | 0.142 | 0.105 | 0.66535 | 5779.4387 | 0.672084 | 20:34:12.1 | 07:24:28 |
| V85 | ? | 17.316 | 16.293 | 0.096 | 0.081 | 1.622 | 7664.2817 | 1.6429 | 20:34:31.0 | 07:21:5 |
| V86 | SR | 13.78 | 12.08 | - | - | ≈49. | - | - | 20 34 19.5 | 07 22 50 |
| V87a | CWB | 14.474 | 13.332 | 0.115 | 0.066 | - | 6221.1684 | 0.574663 | 20:34:12.6 | 07:24:12 |
| V88a | RRab | 16.746 | 16.367 | 1.095 | 0.781 | - | 7664.0652 | 0.519621 | 20:34:11.4 | 07:24:10 |
| V89a | RRab | 17.122 | 16.385 | 0.999 | 0.768 | - | 5779.3729 | 0.525269 | 20:34:11.3 | 07:24:11 |
| V90a | CWB | 17.005 | 16.302 | 0.090 | 0.05 | - | 7664.0914 | 1.056153 | 20:34:12.4 | 07:20:53 |
| V91a | RRab | 16.90 | 16.35 | 0.912 | 0.453 | - | 5780.4143 | 0.547098 | 20:34:11.8 | 07:24:11 |
| V92a | SX Phe | 19.403 | 18.96 | 0.12 | 0.09 | - | 5779.3963 | 0.045858 | 20:34:05.0 | 07:25:27 |
| V93a | SX Phe | 18.638 | - | 0.141 | - | - | 5779.42926 | 0.099016 | 20:34:10.1 | 07:24:11 |
| V94a | RRab | 15.80 | 15.28 | 0.43 | 0.30 | - | 5781.3595 | 0.573329 | 20:34:11.8 | 07:24:16 |
| V95a | SX Phe | 19.827 | 19.308 | - | - | - | 5780.4631 | 0.0243125 | 20:34:00.9 | 07:19:58 |
| V96a | SR | 13.814 | 12.694 | 0.18 | 0.1 | - | 7664.0774 | 9.54 | 20:34:22.2 | 07:20:10 |
| V97a | SR | 14.079 | 12.948 | 0.07 | - | - | - | - | 20:34:16.9 | 07:20:45 |
| V98a | SR | 13.782 | 12.566 | 0.06 | - | - | - | - | 20:34:23.9 | 07:27:40 |
| C1a | RRab? | 17.76 | 16.65 | 0.20 | 0.35: | - | 6222.1595 | 0.523307 | 20:34:42.3 | 07:28:29 |
| C2a | SX Phe | 19.96 | 19.51 | 0.09 | 0.18 | - | 5780.4479 | 0.06961 | 20:34:13.3 | 07:23:32 |
| C3a | SX Phe | 19.968 | 19.6 | 0.18 | 0.15: | - | 5779.4293 | 0.061280 | 20:34:10.1 | 07:24:55 |
| C4a | SX Phe | 19.936 | 19.566 | - | - | - | 5780.4631 | 0.03953 | 20:34:03.8 | 07:24:35 |
| 0.06951 | ||||||||||
| C5a | SX Phe | 20.053 | 19.494 | - | - | - | 5781.3595 | 0.052579 | 20:34:15.5 | 07:27:50 |
*Previous period estimates for each variable from KOS01 are listed in Column 7 for comparison with our periods reported in Column 9.
aNewly found in this work. See Appendix A for a discussion.
3.1. Search for New Variables
We were able to isolate 4274 light curves in V and 4273 in I of individual star in the FoV of our images for setting A. A search for new variables was conducted using three different strategies. First we used the string-length method (Burke, Rolland & Boy 1970; Dworetsky 1983), in which each light curve was phased with periods between 0.02 and 1.7 d and a normalized string-length statistic SQ was calculated for each trial period. A plot of the minimum values of SQ versus the X-coordinate for each star is shown in Figure 4. All known variables are naturally near the bottom of the distribution. We have drawn an arbitrary threshold at 0.172, below which we find all the known variables. The light curve of every star below the threshold was explored for variability.
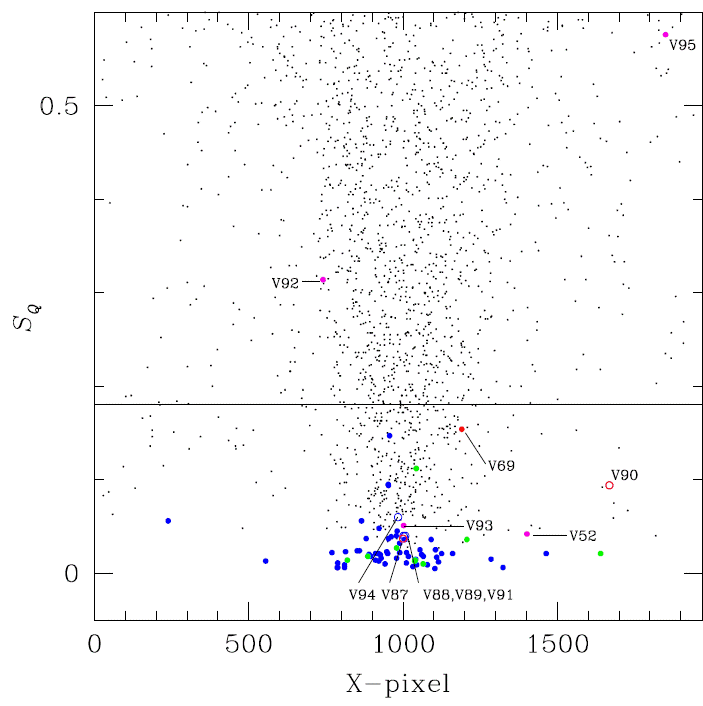
Fig. 4 Minimum value of the string-length parameter SQ calculated for the 2113 stars with a light curve in our V reference image, versus the CCD X-coordinate. Colours are: blue RRab, green for RRc, pink for SX Phe and red circles for CWB stars. The horizontal line is an arbitrarily defined threshold 0.172, below which all known variables are located. The color figure can be viewed online.
A second approach to the search of new variables consisted in blinking all residual images. Variable stars are evident by their variation from image to image. A third approach was to separate the light curves of stars in a given region of the CMD where variables are expected, e.g. HB, the blue stragglers region, the upper instability strip and the tip of RGB. A further detailed inspection of the light curves of stars in these regions may prove the variability of some stars.
A combination of the three methods described above allowed us to identify all previously known variables in the FoV of our images and reveal the existence of twelve new ones, labeled as V87-V98 and their general properties are listed in Table 2. Four of these are RRab stars (V88, V89, V91, and V94), two are CWB (V87, V90) whose light curves are shown in Figure 5, three are SX Phe stars (V92, V93 and V95) that shall be further discussed in § 5 and three are SR or semi-regular variables (V96, V97 and V98).
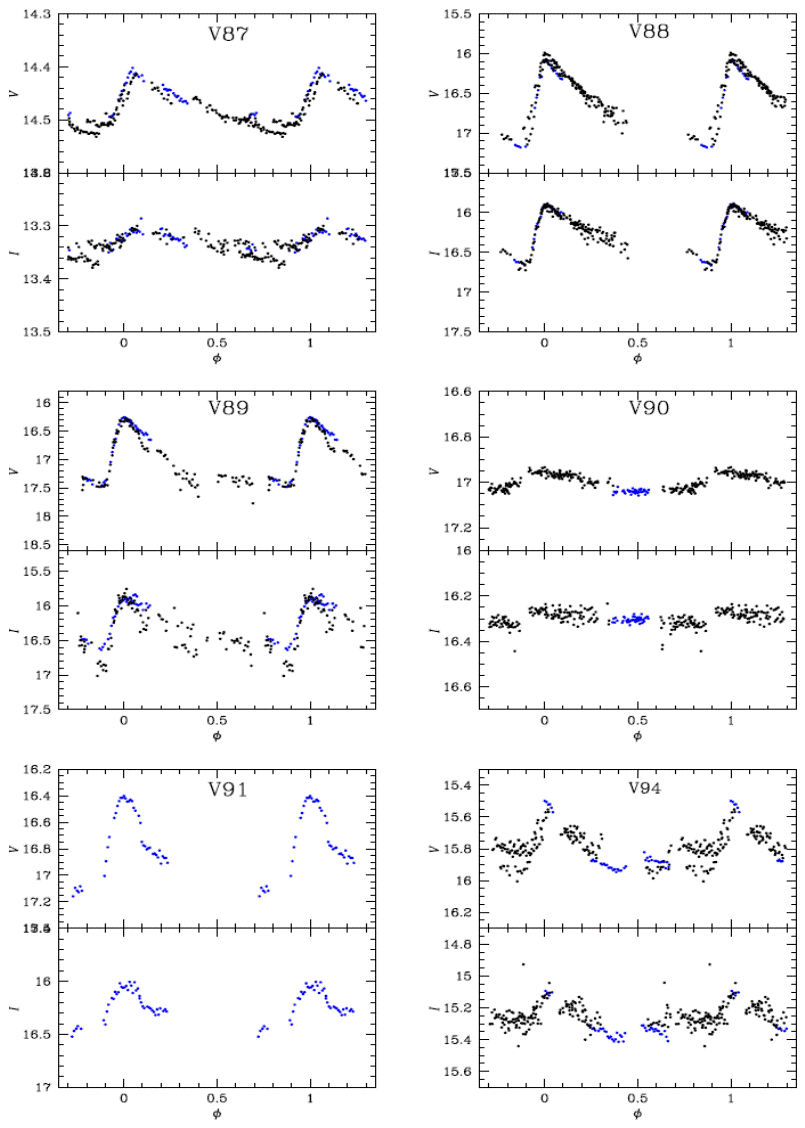
Fig. 5 Newly discovered RR Lyrae stars and one CW (V90). For an individual discussion on these stars see Appendix A.
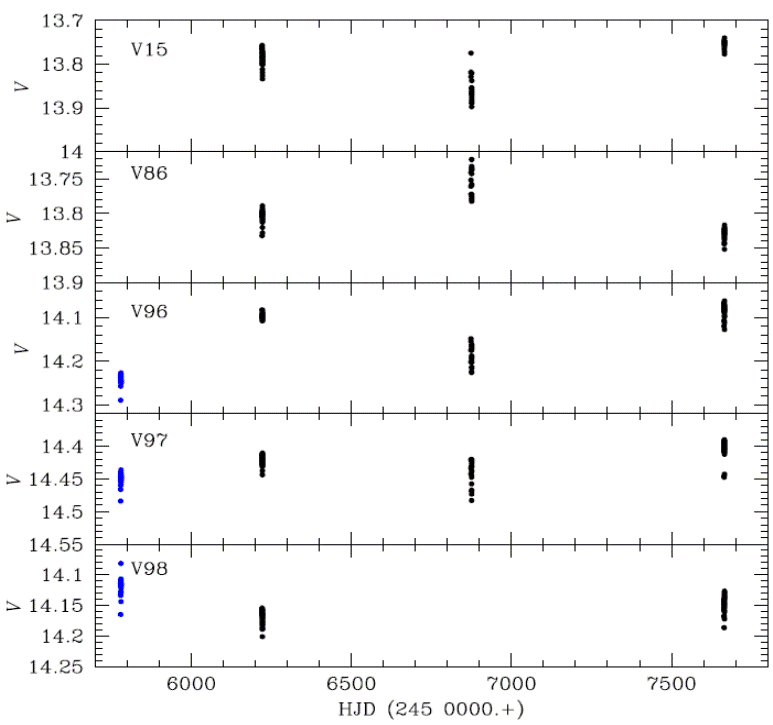
Fig. 6 Semi-regular (SR) variables near the tip of the Red Giant Branch. While the variability of V15 and V84 has been reported in the past, V96, V97 and V98 are new discoveries in this paper. For an individual discussion on these stars see Appendix A.
We have also identified five stars that seem to be variable but given their position in a crowded region and/or being part of blends their light curves are dubious and need further confirmation. We have not assigned a variable number to these candidates but their general properties are included at the bottom of Table 2, their light curves are shown in Figure 7 and they are also discussed in Appendix A.
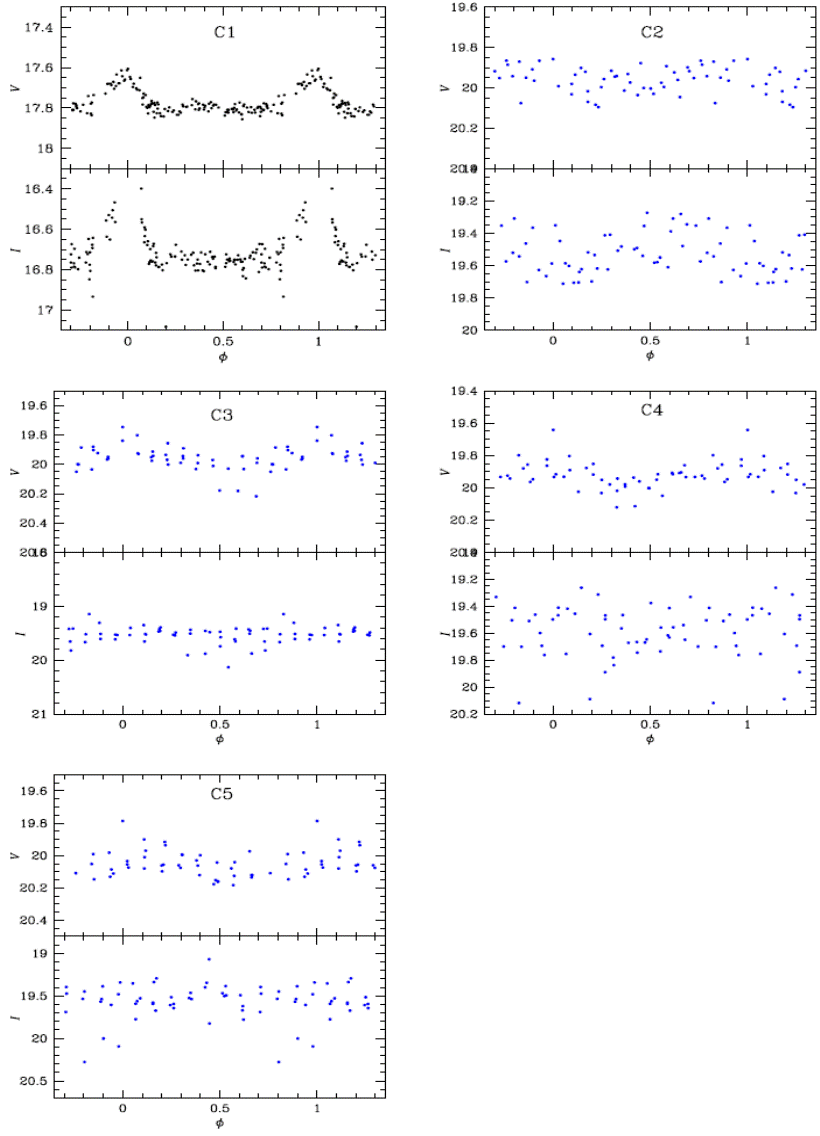
Fig. 7 Variables whose nature and classification are to be confirmed, phased with the periods listed in Table 2. C4 is likely a double mode SX Phe with periods of 0.03953 d and 0.06951 d.
3.2. The Color-Magnitude Diagram
The CMD of the cluster is shown in Figure 8, where the location of the known and the newly discovered variables is marked. All variable stars are plotted using their intensity-weighted means < V > and corresponding colour < V > − < I >. The finding chart of all variables in Table 2 is shown in Figure 9 for the peripheral and the core regions.
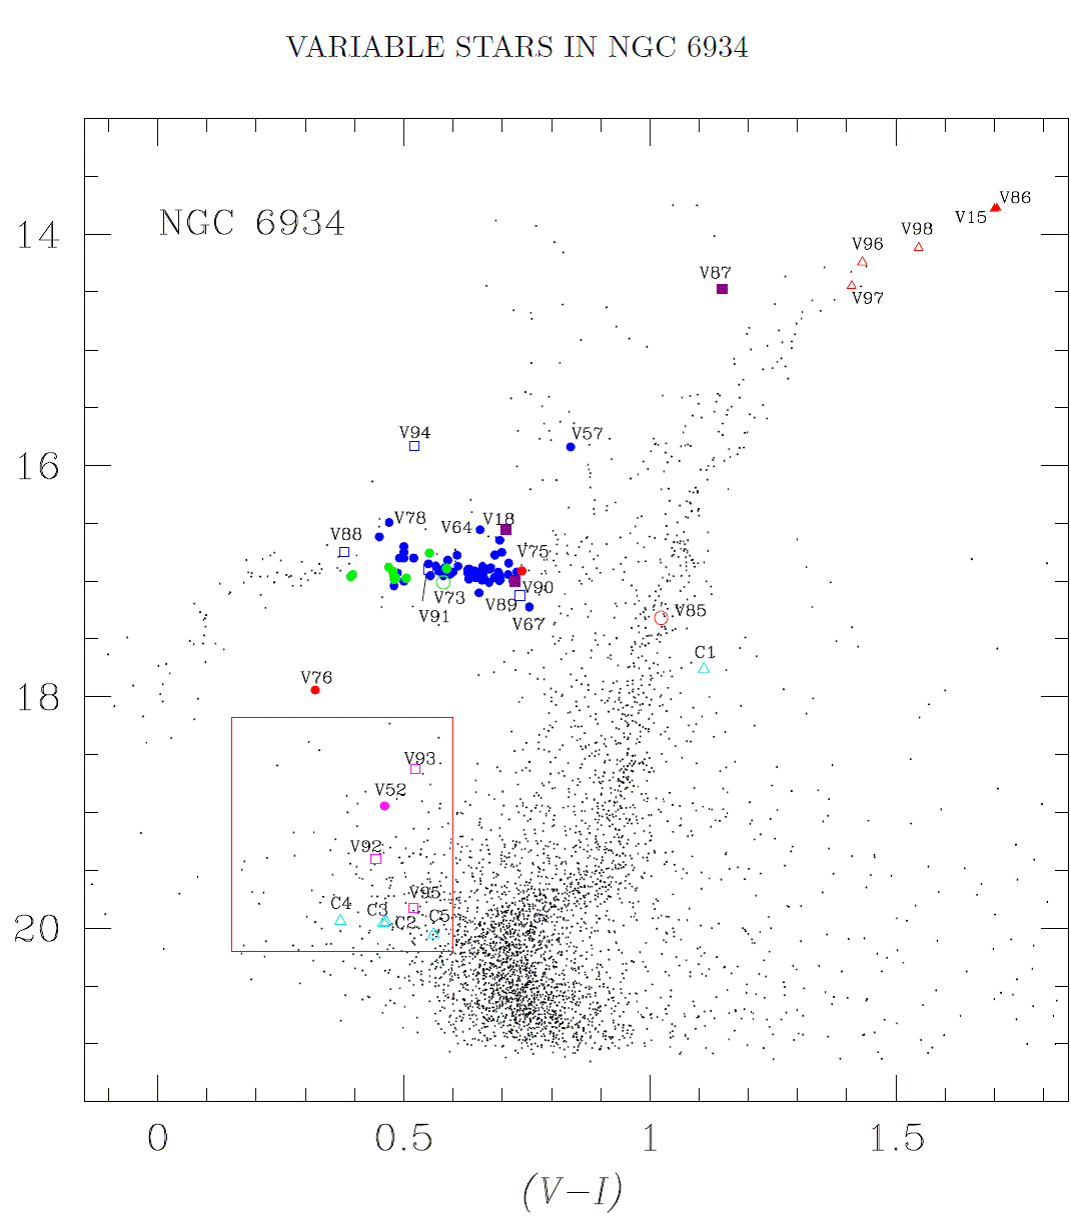
Fig. 8 CMD of NGC 6934 (setting A). The plotted magnitudes and colors for all non-variable stars are magnitudeweighted means of their light curves. Variables are plotted using their intensity-weighted means < V > and < V > − < I >. Symbols and colors are: blue and green circles RRab and RRc stars respectively; cyan symbols are confirmed SX Phe stars, turquoise triangles are for candidate SX Phe stars; red circles EW binaries; purple squares are possible CWB stars (V18, V87, V90); the open green circle is the double mode or RRd star (V73); red triangles are SR variables. Newly discovered variables are those labeled from V87 to V95 and plotted with open symbols. The red rectangle is the region where the search for variability among the blue stragglers was conducted. The color figure can be viewed online.
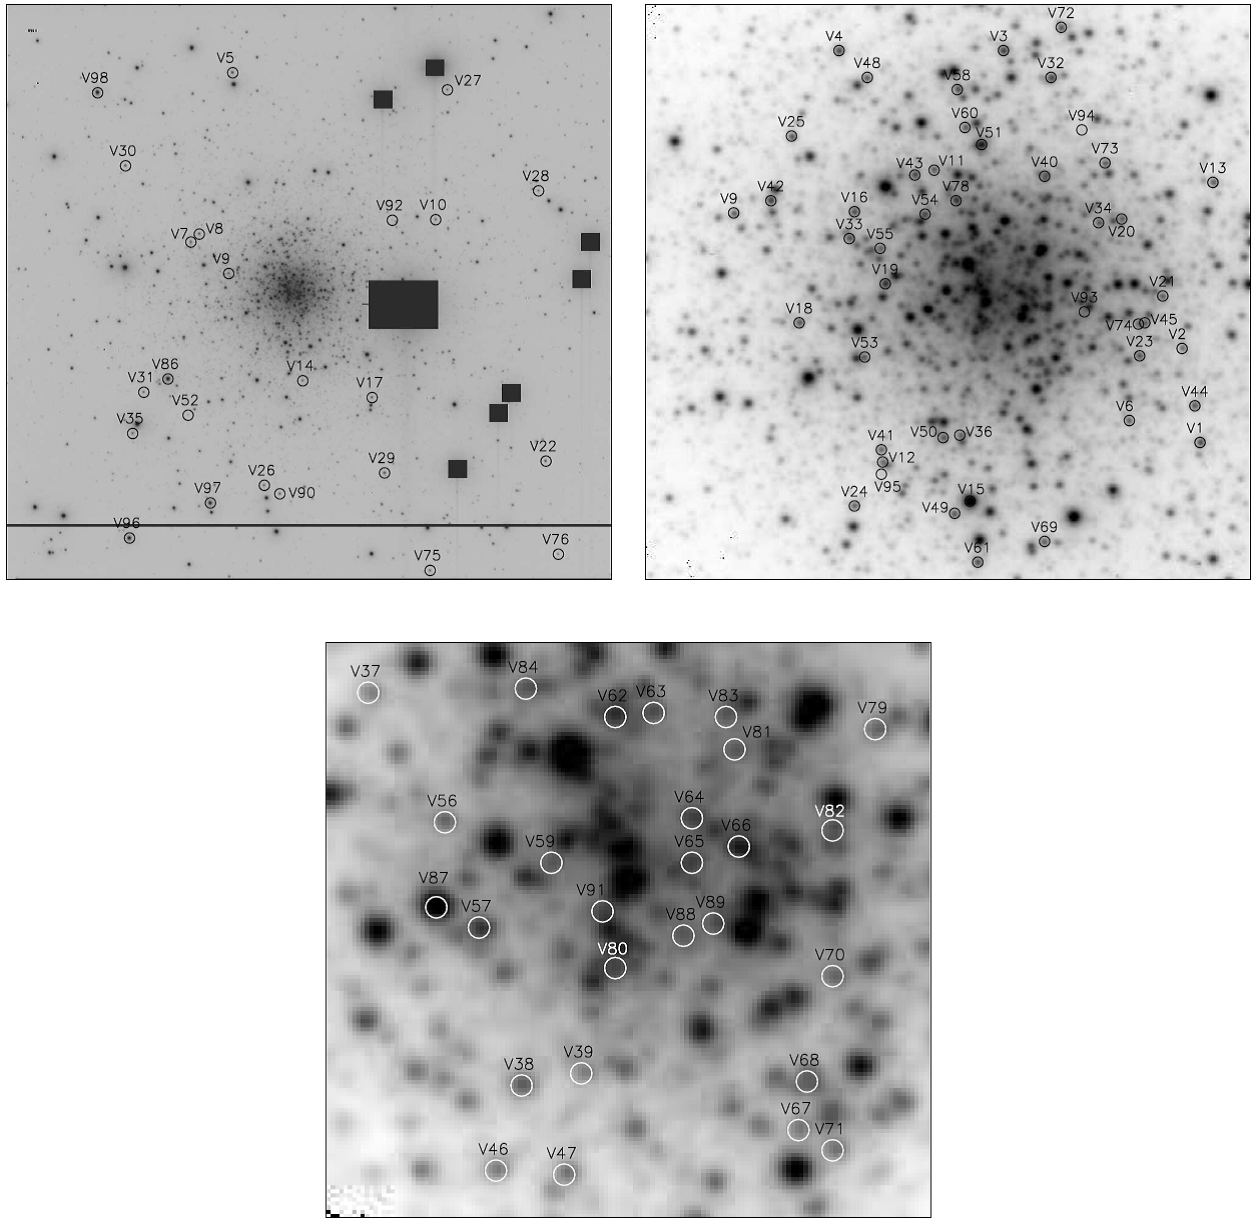
Fig. 9 Finding chart constructed from 5 of our best V images in setting A. The top left panel display the complete FoV of our images and it is about 9.6 × 9.6 arcmin2. The top right panel displays the central region of the cluster and it is about 2.3 × 2.3 arcmin2. The bottom panel displays the core region of the cluster and the field is 0.7 × 0.7 arcmin2. All stars listed in Table 2 are identified in at least one of the panels. In all panels North is up and East is left.
4. Physical parameters of RR lyrae stars
It has been a commonly adopted procedure to calculate [Fe/H], log(L/L⊙), and log Teff for individual RR Lyrae stars by means of the Fourier decomposition of their light curves, and to employ ad-hoc semi-empirical calibrations that correlate the Fourier parameters with the physical quantities. The readers are referred to the work published by Arellano Ferro et al. (2016b; 2017) and the references therein for a recent example and a summary.
The form of the Fourier representation of a given light curve is:
where m(t) is the magnitude at time t, P is the period, and E is the epoch. A linear minimization routine is used to derive the best fit values of the amplitudes A k and phases ϕ k of the sinusoidal components. From the amplitudes and phases of the harmonics in equation 5, the Fourier parameters, defined as ϕ ij =jϕ i−iϕ j, and Rij =Ai/Aj, are computed.
We have argued in previous papers in favour of the calibrations developed by Jurcsik & Kovács (1996) and Kovács & Walker (2001) for the iron abundance and absolute magnitude of RRab stars, and those of Morgan, Wahl & Wieckhorts (2007) and Kovács (1998) for RRc stars. The effective temperature Teff was estimated using the calibration of Jurcsik (1998). These calibrations and their zero points have been discussed in detail in Arellano Ferro et al. (2013) and we do not explicitly repeat them here.
The value of A0 and the Fourier light-curve fitting parameters for 16 RRab and 9 RRc stars with no apparent signs of amplitude modulations are given in Table 3. These Fourier parameters and the above mentioned calibrations were used in turn to calculate the physical parameters listed in Table 4. The absolute magnitude MV was converted into luminosity with log(L/L⊙)=−0.4(MV −M⊙ bol+BC). The bol bolometric correction was calculated using the formula BC = 0.06 [Fe/H]ZW + 0.06 given by Sandage & Cacciari (1990). We adopted M⊙ bol = 4.75 mag. For the distance calculation, we have adopted E(B-V )=0.1 (Harris 1995) given that there are no signs of differential reddening.
Table 3 Fourier coefficients of RRab and RRc stars in ngc 6934.*
| Variable ID | A0 (V mag) | A1 (V mag) | A2 (V mag) | A3(V mag) | A4 (V mag) | φ21 | φ31 | φ41 | N | Dm |
|---|---|---|---|---|---|---|---|---|---|---|
| RRab | ||||||||||
| V2 | 16.952(2) | 0.407(3) | 0.170(3) | 0.136(3) | 0.089(3) | 3.741(23) | 7.698(30) | 5.601(44) | 8 | 1.9 |
| V3 | 16.912(1) | 0.339(2) | 0.160(2) | 0.127(2) | 0.084(2) | 3.893(16) | 7.996(22) | 5.944(32) | 9 | 2.0 |
| V4 | 16.775(2) | 0.414(2) | 0.216(2) | 0.161(2) | 0.119(2) | 4.098(16) | 8.223(40) | 6.207(31) | 8 | 2.7 |
| V6 | 16.985(9) | 0.345(1) | 0.143(5) | 0.104(4) | 0.061(7) | 3.911(86) | 8.102(117) | 5.988(145) | 9 | 1.9 |
| V7 | 16.872(2) | 0.262(2) | 0.128(2) | 0.072(3) | 0.032(2) | 4.181(27) | 8.468(40) | 6.714(79) | 7 | 1.9 |
| V9 | 16.965(3) | 0.321(3) | 0.141(3) | 0.118(4) | 0.073(3) | 3.733(33) | 7.829(42) | 5.660(70) | 9 | 4.8 |
| V16 | 16.896(2) | 0.250(3) | 0.003(3) | 0.121(3) | 0.003(3) | 4.067(34) | 8.530(48) | 6.720(100) | 9 | 1.6 |
| V30 | 16.916(3) | 0.286(4) | 0.142(4) | 0.096(4) | 0.061(4) | 4.088(39) | 8.430(60) | 6.465(90) | 9 | 1.5 |
| V34 | 16.991(2) | 0.362(3) | 0.157(3) | 0.107(4) | 0.071(3) | 4.003(28) | 8.212(37) | 6.318(55) | 7 | 2.2 |
| V36 | 16.884(2) | 0.418(5) | 0.198(6) | 0.155(4) | 0.102(6) | 3.774(40) | 7.840(63) | 5.770(69) | 9 | 2.2 |
| V37 | 17.009(2) | 0.382(4) | 0.177(4) | 0.125(4) | 0.078(4) | 3.907(30) | 8.116(45) | 6.087(78) | 9 | 1.1 |
| V38 | 16.907(6) | 0.347(8) | 0.176(8) | 0.138(9) | 0.088(8) | 3.984(70) | 8.054(88) | 5.974(13) | 9 | 2.6 |
| V41 | 16.980(2) | 0.350(2) | 0.164(3) | 0.108(3) | 0.067(3) | 3.925(20) | 8.058(32) | 6.157(48) | 9 | 1.5 |
| V43 | 16.969(3) | 0.314(4) | 0.157(4) | 0.124(4) | 0.070(4) | 3.994(35) | 8.379(47) | 6.345(75) | 9 | 2.1 |
| V48 | 16.922(2) | 0.301(3) | 0.159(3) | 0.112(3) | 0.066(3) | 3.900(26) | 7.982(39) | 6.119(58) | 9 | 3.6 |
| V50 | 16.984(2) | 0.190(3) | 0.071(3) | 0.038(3) | 0.018(3) | 4.150(54) | 8.707(94) | 6.805(173) | 7 | 9.7 |
| RRc | ||||||||||
| V11 | 16.912(2) | 0.269(3) | 0.048(2) | 0.027(3) | 0.012 (2) | 4.600 (54) | 2.911 (94) | 1.713 (204) | 4 | |
| V23 | 16.878(1) | 0.258(2) | 0.053(2) | 0.014(2) | 0.014 (2) | 4.664 (34) | 2.799 (122) | 1.263 (120) | 4 | |
| V26 | 16.943(2) | 0.178(3) | 0.035(3) | 0.008(3) | 0.006 (3) | 4.640 (75) | 2.167 (336) | 1.398 (418) | 4 | |
| V53 | 16.973(3) | 0.279(3) | 0.060(4) | 0.026(4) | 0.018 (4) | 4.853 (63) | 2.916 (140) | 1.579 (198) | 4 | |
| V56 | 16.972(3) | 0.276(5) | 0.069(5) | 0.025(5) | 0.006 (5) | 4.679 (75) | 2.865 (190) | 0.771 (826) | 4 | |
*The numbers in parentheses indicate the uncertainty on the last decimal place. Also listed are the number of harmonics N used to fit the light curve of each variable and the deviation parameter Dm.
Table 4 Physical parameters of the RRab and RRc stars.*
| Star | [Fe/H]ZW | [Fe/H]UV ES | MV | log Teff | log(L/L⊙) | D (kpc) | M/M⊙ | R/R⊙ |
|---|---|---|---|---|---|---|---|---|
| RRab | ||||||||
| V2 | -1.670(28) | -1.623(34) | 0.645(4) | 3.815(8) | 1.642(1) | 15.83(3) | 0.75(8) | 5.21(1) |
| V3 | -1.608(21) | -1.542(24) | 0.624(3) | 3.810(8) | 1.650(1) | 15.69(2) | 0.69(6) | 5.38(1) |
| V4 | -1.683(38) | -1.640(45) | 0.457(3) | 3.806(8) | 1.717(1) | 15.90(2) | 0.72(7) | 5.92(9) |
| V6 | -1.569(110) | -1.493(124) | 0.574(3) | 3.810(18) | 1.670(1) | 16.61(2) | 0.70(15) | 5.50(1) |
| V7 | -1.557(38) | -1.478(42) | 0.524(3) | 3.800(11) | 1.690(1) | 16.13(3) | 0.67(9) | 5.91(1) |
| V9 | -1.800(39) | -1.800(51) | 0.623(5) | 3.807(10) | 1.651(2) | 16.09(4) | 0.70(9) | 5.47(12) |
| V16 | -1.351(45) | -1.238(44) | 0.629(4) | 3.806(13) | 1.648(2) | 15.54(3) | 0.61(10) | 5.48(1) |
| V30 | -1.388(56) | -1.280(56) | 0.588(6) | 3.808(12) | 1.665(2) | 15.99(4) | 0.65(9) | 5.52(1) |
| V34 | -1.481(35) | -1.387(37) | 0.551(5) | 3.810(9) | 1.680(2) | 16.83(4) | 0.71(8) | 5.56(12) |
| V36 | -1.588(59) | -1.517(67) | 0.625(7) | 3.816(10) | 1.650(3) | 15.48(5) | 0.73(9) | 5.24(2) |
| V37 | -1.470(42) | -1.373(45) | 0.583(6) | 3.814(11) | 1.667(2) | 16.72(4) | 0.71(9) | 5.39(1) |
| V38 | -1.492(83) | -1.399(89) | 0.649(12) | 3.813(7) | 1.640(5) | 15.47(8) | 0.68(9) | 5.24(3) |
| V41 | -1.476(30) | -1.381(32) | 0.626(3) | 3.813(9) | 1.650(1) | 16.18(3) | 0.71(7) | 5.32(1) |
| V43 | -1.336(44) | -1.222(42) | 0.616(6) | 3.812(11) | 1.654(2) | 16.16(4) | 0.64(8) | 5.36(1) |
| V48 | -1.702(37) | -1.665(45) | 0.624(4) | 3.805(9) | 1.651(2) | 15.76(3) | 0.70(8) | 5.52(1) |
| V50 | -1.220(88)a | -1.102(78)a | 0.618(4) | 3.806(21) | 1.653(2) | 16.26(3) | 0.61(15) | 5.50(1) |
| Weighted mean | −1.571(9) | −1.477(10) | 0.584(1) | 3.810(2) | 1.666(1) | 16.03(1) | 0.69(2) | 5.51(1) |
| σ | ±0.137 | ±0.137 | ±0.052 | ±0.004 | ±0.020 | ±0.42 | ±0.04 | ±0.21 |
| RRc | ||||||||
| V11 | -1.66(17) | -1.62(20) | 0.578(9) | 3.865(1) | 1.669(4) | 16.03(7) | 0.56(1) | 4.27(2) |
| V23 | -1.48(21) | -1.38(22) | 0.587(9) | 3.869 (1) | 1.665(44) | 15.71(7) | 0.59(1) | 4.17(2) |
| V26 | -1.46(53) | -1.37(55) | 0.650(14) | 3.872(2) | 1.640(5) | 15.72(10) | 0.62(2) | 4.00(3) |
| V53 | -1.364(24) | -1.25(24) | 0.565(18) | 3.871(1) | 1.674(7) | 16.58(14) | 0.61(1) | 4.18(4) |
| V56 | -1.50(33) | -1.41(36) | 0.618(22) | 3.868(1) | 1.653(9) | 16.17(17) | 0.56(2) | 4.13(4) |
| Weighted mean | −1.53(11) | −1.43(11) | 0.593(3) | 3.867(1) | 1.662(2) | 15.91(04) | 0.58(1) | 4.17(4) |
| σ | ±0.11 | ±0.11 | ±0.010 | ±0.004 | ±0.035±0.09 | ±0.39 | ±0.27 | |
*The numbers in parentheses indicate the uncertainty in the last decimal places and have been calculated as described in the text.
aValue not considered in the weighted mean.
Before the iron calibration of Jurcsik & Kovács (1996) for RRab stars can be applied to the light curves, a “compatibility condition parameter” D m should be calculated. These authors have made clear that their calibration is only applicable to light curves of RRab variables that are similar to the light curves that were used to derive the calibration. Jurcsik & Kovács (1996) and Kovács & Kanbur (1998) defined a deviation parameter D m describing the deviation of a light curve from the calibrating light curves, based on the Fourier parameter interrelations. These authors advise to consider only light curves for which D m < 3.0. The values of Dm for each of the RRab stars are also listed in Table 3. Most of them fulfill the D m criterion. However, in order to attain a reasonable size for our sample, we relaxed the criterion and accepted stars with D m < 5.0 which allowed us to include stars V9 and V48. V50 was hence not included in the iron abundance calculation.
The resulting physical parameters of the RR Lyrae stars are summarized in Table 4. The mean values given at the bottom of the table are weighted by the statistical uncertainties. The iron abundance is given in the scale of Zinn & West (1984) and in the scale of Carretta et al. (2009). The transformation between these two scales is of the form:
Also listed are the corresponding distances. Given the period, luminosity, and temperature for each RR Lyrae star, its mass and radius can be estimated from the equations: log M/M⊙ = 16.907 − 1.47 log PF + 1.24 log (L/L⊙) − 5.12 log Teff (van Albada & Baker 1971), and L=4πR2σT4, respectively. The masses and radii given in Table 4 are expressed in solar units.
4.1. Bailey diagram and Oosterhoff type
The period versus amplitude plane for RR Lyrae stars is known as the Bailey diagram. It is a useful tool to separate the RRab and the RRc stars as they occupy markedly different regions in the diagram. The distribution of RRab stars also offers insight on the Oosterhoff type of a globular cluster i.e. OoI or OoII, the second group having RR Lyrae stars with a slightly longer period and being systematically more metal poor. The Bailey diagram of M3 is usually used as a reference for OoI clusters (see Figure 4 of Cacciari et al. 2005). Figure 10 displays the corresponding distribution of the RR Lyrae stars in NGC 6934 with a good light curve coverage. The continuous and segmented lines in the top diagram represent, respectively, the mean distributions of non-evolved and evolved stars in M3 according to Cacciari et al. (2005). For the RRc stars distribution, the black parabola was calculated by Kunder et al. (2013) from 14 OoII clusters while the red parabolas were calculated by Arellano Ferro et al. (2015) for a sample of RRc stars in five OoI clusters and avoiding Blazhko variables. It is clear from this figure that except for a few outlier RRc stars (V49, V58 and V61), the RRab and RRc stars in NGC 6934 follow the trends for an OoI type cluster, which identifies NGC 6934 as being of the type OoI. For OoII clusters the RRab distribution is shifted toward longer periods and/or larger amplitudes and do follow the segmented line in Figure 10 which is, according to Cacciari et al. (2005), the locus of stars advanced in their evolution toward the AGB; see for example the diagrams of the OoII cluster NGC 5024 (Arellano Ferro et al. 2011 Figure 7); NGC 6333 (Arellano Ferro et al. 2013, Figure 17), and NGC 7099 (Kains et al. 2013, Figure 10).
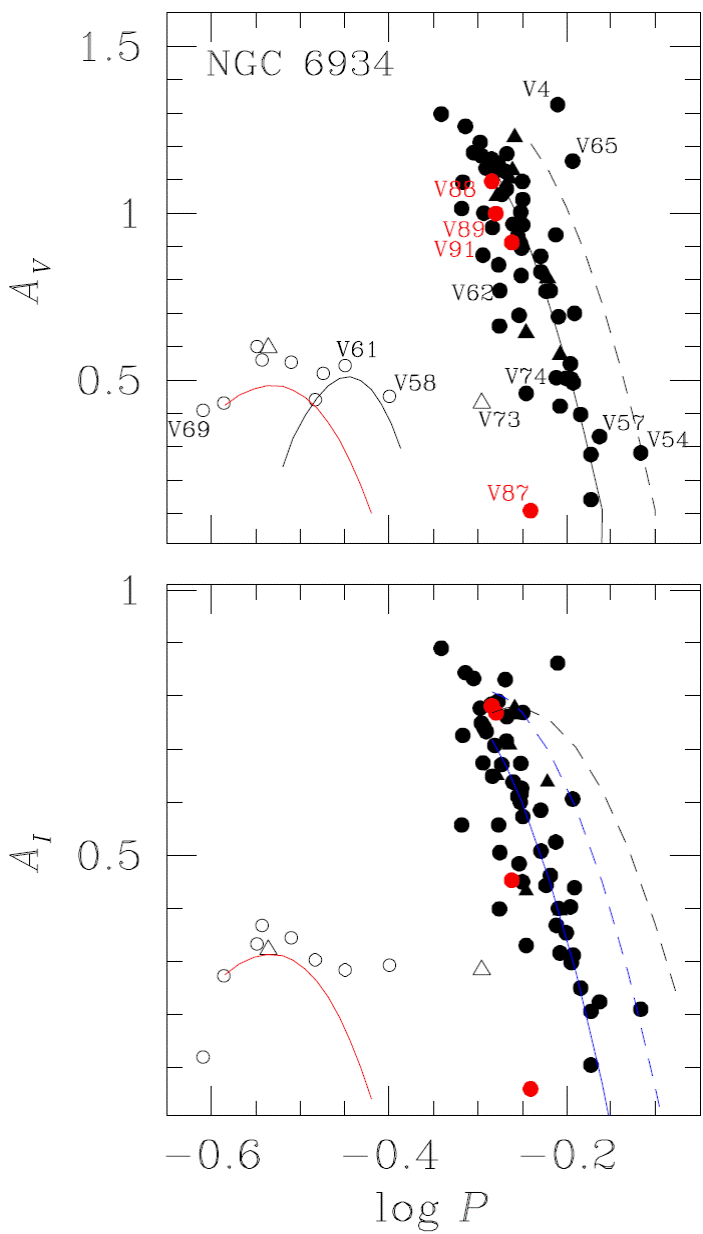
Fig. 10 Bailey diagram of NGC 6934 for V and I amplitudes. Filled and open symbols represent RRab and RRc stars, respectively. Triangles represent stars with Blazhko modulations. In the top panel the continuous and segmented lines are the loci for unevolved and evolved stars respectively in M3 according to Cacciari et al. (2005). The black parabola was found by Kunder et al. (2013a) from 14 OoII clusters. The red parabolas were calculated by Arellano Ferro et al. (2015) from a sample of RRc stars in five OoI clusters and avoiding Blazhko variables. In the bottom panel the black segmented locus was found by Arellano Ferro et al. (2011; 2013) for the OoII clusters NGC 5024 and NGC 6333. The blue loci are from Kunder et al. (2013b). See § 4.1 for details. The color figure can be viewed online.
Arellano Ferro et al. (2011) also discussed the distribution of AI amplitudes in the OoII cluster NGC 5024 and defined the locus shown as a black segmented line in the bottom panel of Figure 10. It has the equation:
The bottom panel of Figure 10 displays the distribution of the I amplitudes of RRab and RRc stars in NGC 6934. The blue loci are those calculated by Kunder et al. (2013) for the RRab stars in OoI clusters (solid line) and in OoII clusters (segmented line). Their OoI locus represents well the distribution in NGC 6934. We note the difference in the locus of OoII clusters proposed by Kunder et al. (2013) and the one observed by Arellano Ferro et al. (2011; 2013) in NGC 5402 and NGC 6333 respectively (black segmented line).
Several outstanding stars are labeled in the top panel and they deserve a dedicated discussion in Appendix A.
5. The SX phe stars
V52 was the only known SX Phe star in NGC 6934 prior to the present work. A detailed exploration of the residual images allowed us to discover three more, now labeled V92, V93 and V95. Their light curves are shown in Figure 11. These four SX Phe will play a role in the determination of the distance to the cluster as explained in § 6.
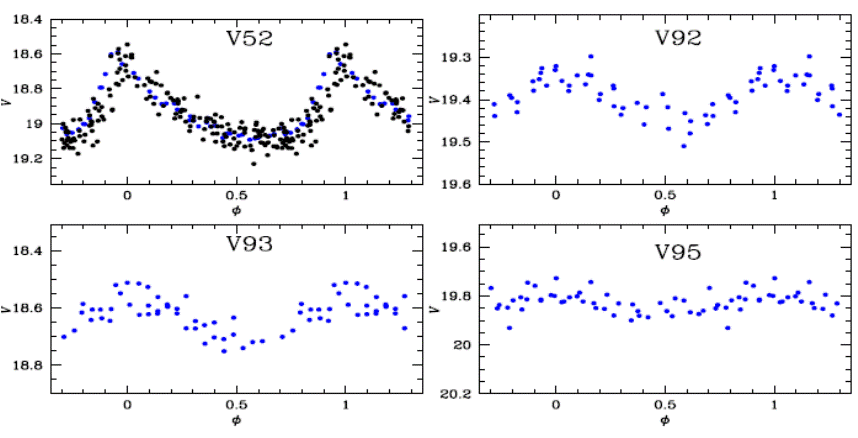
Fig. 11 V light curves of the SX Phe star. V92, V93 and V95 are new discoveries in this paper. These stars follow the P-L relation of SX Phe stars and are therefore considered members of the cluster (see Figure 12).
6. Distance to NGC 6934 from its variable stars
The distance to NGC 6934 can be estimated by a variety of approaches based on the variable stars. Our first determinations come from the calculation of M V via the Fourier light curve decomposition of the RRab and RRc stars. The average values of M V and distance are given in the bottom lines of Table 4. We found the distance values 16.03±0.42 kpc and 15.91±0.39 kpc, respectively. Coming from independent calibrations the results for the RRab and RRc stars can be considered as two independent estimations.
Also for the RR Lyrae stars one can make use of the P-L relation for the I magnitude derived by Catelan et al. (2004):
with log Z =[M/H]−1.765 and [M/H]=[Fe/H]− log (0.638 f + 0.362) and log f = [α/Fe] (Salaris et al. 1993). For the sake of direct comparison with the results of Fourier decomposition we applied the above equations to the I measurements of the 21 RR Lyraes in Table 4 and found a mean distance of 15.93 ± 0.46 kpc, in excellent agreement with the Fourier results.
Yet another approach to the calculation of the distance is from the P-L relation for SX Phe stars (PLSX) which has been calibrated by several authors, notably Poretti et al. (2008) and McNamara (1997) for Galactic and extragalactic δ Scuti and SX Phe stars. In globular clusters the PLSX has been studied by McNamara (2000) for ω Cen, Jeon et al. (2003) and Arellano Ferro et al. (2011) for NGC 5024. The calibrations of Arellano Ferro et al. (2011) for the fundamental mode of SX Phe stars in NGC 5024 in the V filter is of the form:
This calibration was used to calculate the distance to V52, V92 and V95. We adopted the mean reddening E(B − V) = 0.10 (Harris 1996), and found the distances 16.15, 16.50, and 16.00 kpc respectively for an average of 16.22±0.26 kpc which compares well with the independent estimates from the RR Lyrae stars given above. Alternatively, the PLSX calibration of Cohen & Sarajedini (2012); M v = −3.389 log P − 1.640 produces distances of 17.51, 17.35 and 16.21 kpc respectively, and average of 17.03±0.71 kpc, i.e. about 5% larger, a trend already noted by Arellano Ferro et al. (2017).
We then adopted the distance of 16.3 kpc, scaled equation 9 for the fundamental mode and plotted the corresponding solid line in Figure 12. The loci for the first and second overtone were drawn assuming the period rates P 1 /P 0 = 0.783 and P 2 /P 0 = 0.571 (see Santolamazza et al. 2001 or Jeon et al. 2003; Poretti et al. 2005). It seems clear from this figure that V52, V92 and V95 are cluster members and that the later pulsates in the first overtone. For V93 the distance is about 18.2 kpc, a bit too large to be a cluster member. Other candidate SX Phe stars labeled in the plot shall be discussed in Appendix A.
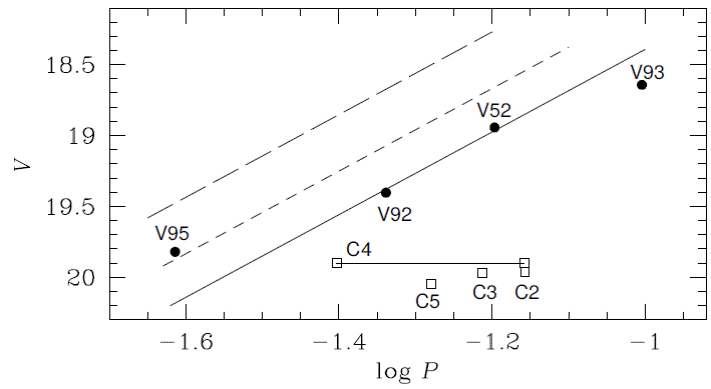
Fig. 12 The P-L relation of SX Phe Stars. Solid and dashed lines represent the P-L calibration for the fundamental, first overtone and second overtone of Arellano Ferro et al. (2011) scaled to the average distance of V52 and V92. V95 is a first overtone pulsator, while V93 might be a little too faint to be a cluster fundamental pulsator. Open squares are likely SX Phe stars behind the cluster. Two periods are plotted for the likely double mode C4. See Appendix A for a discussion on individual stars.
Table 5 Time-series v and i photometry for all the confirmed variables in our field of view.*
| Variable Star ID | Filter | HJD (d) | Mstd (mag) | mins (mag) | σm (mag) | fref (ADU s−1) | σref (ADU s−1) | fdiff (ADU s−1) | σdiff (ADU s−1) | p |
|---|---|---|---|---|---|---|---|---|---|---|
| V1 | V | 2455779.37293 | 16.996 | 18.125 | 0.005 | 738.417 | 2.078 | −195.326 | 2.881 | 1.1081 |
| V1 | V | 2455779.37758 | 17.010 | 18.139 | 0.005 | 738.417 | 2.078 | −208.125 | 2.978 | 1.1349 |
| ⋮ | ⋮ | ⋮ | ⋮ | ⋮ | ⋮ | ⋮ | ⋮ | ⋮ | ⋮ | ⋮ |
| V1 | I | 2455779.36627 | 16.307 | 17.357 | 0.007 | 1195.901 | 4.821 | −55.859 | 7.876 | 1.0051 |
| V1 | I | 2455779.37043 | 16.319 | 17.369 | 0.008 | 1195.901 | 4.821 | −67.854 | 8.632 | 1.0056 |
| ⋮ | ⋮ | ⋮ | ⋮ | ⋮ | ⋮ | ⋮ | ⋮ | ⋮ | ⋮ | ⋮ |
| V2 | V | 2455779.37293 | 17.370 | 18.493 | 0.007 | 392.308 | 2.364 | +9.324 | 2.752 | 1.1081 |
| V2 | V | 2455779.37758 | 17.379 | 18.502 | 0.007 | 392.308 | 2.364 | +5.722 | 2.801 | 1.1349 |
| ⋮ | ⋮ | ⋮ | ⋮ | ⋮ | ⋮ | ⋮ | ⋮ | ⋮ | ⋮ | ⋮ |
| V2 | I | 2455779.36627 | 16.699 | 17.746 | 0.010 | 805.480 | 4.515 | −8.408 | 7.296 | 1.0051 |
| V2 | I | 2455779.37043 | 16.677 | 17.724 | 0.010 | 805.480 | 4.515 | +7.914 | 7.929 | 1.0056 |
| ⋮ | ⋮ | ⋮ | ⋮ | ⋮ | ⋮ | ⋮ | ⋮ | ⋮ | ⋮ | ⋮ |
*The standard Mstd and instrumental mins magnitudes are listed in Columns 4 and 5, respectively, corresponding to the variable stars in Column 1. Filter and epoch of mid-exposure are listed in Columns 2 and 3, respectively. The uncertainty on mins is listed in Column 6, which also corresponds to the uncertainty on Mstd . For completeness, we also list the reference and differential fluxes fref and fdiff and the scale factor p in Columns 7, 9, and 11, along with the uncertainties σref and σdiff in Columns 8 and 10. This is an extract from the full table, which is available with the electronic version of the article.
A last approach we used to estimate the cluster distance is employing the variables near the tip of the RGB (TRGB). This method, originally developed to estimate distances to nearby galaxies (Lee et al. 1993) has already been applied by our group for the distance estimates of other clusters e.g. Arellano Ferro et al. (2015) for NGC 6229 and Arellano Ferro et al. (2016b) for M5. In the former case the method was described in detail. In brief, the idea is to use the bolometric magnitude of the tip of the RGB as an indicator. We use the calibration of Salaris & Cassisi (1997):
where [M/H] = [Fe/H] − log(0.638 f + 0.362) and log f=[α/Fe] (Salaris et al. 1993). However one should take into account the fact that the true TRGB might be a bit brighter than the brightest observed stars, as argued by Viaux et al. (2013) in their analysis of M5, under the arguments that the neutrino magnetic dipole moment enhances the plasma decay process, postpones helium ignition in low-mass stars, and therefore extends the red giant branch (RGB) in globular clusters. According to these authors the TRGB is between 0.05 and 0.16 mag brighter than the brightest stars on the RGB. Therefore the magnitudes of the two brightest RGB stars in NGC 6934, V15 and V86 would have to be corrected by at least the above quantities to bring them to the TRGB. Applying the corrections 0.05 and 0.16 we find distances of 16.6 kpc and 15.7 kpc respectively. If on the other hand we accept, from the results for the RR Lyrae and SX Phe discussed above, that the distance to NGC 6934 is between 15.9 and 16.1 kpc, then the correction for the TRGB should be about 0.12 for NGC 6934.
Table 6 summarizes the values of the distance obtained by the approaches described above.
Table 6 Distance to NGC 6934 by different approaches
| Approach | Calibration | Distance (kpc) |
|---|---|---|
| Fourier light curve decomposition of the RRab | Kovács & Walker (2001) | 16.03 ± 0.42 |
| Fourier light curve decomposition of the RRc | Kovács (1998) | 15.91 ± 0.39 |
| RR Lyrae I-magnitude P-L relation | Catelan et al. (2004) | 15.93 ± 0.46 |
| SX Phe P-L relation | Arellano Ferro et al. (2011) | 16.3 ± 0.3 |
| Bolometric magnitude of the TRGB | Salaris & Cassini (1997) | 15.9 − 16.1a |
7. The HB of NGC 6934 and probable evolved stars
The instability strip at the level of the HB is populated by RR Lyrae stars evolving both to the blue and to the red. According to a scheme described by Caputo et al. (1978) and sustained on theoretical grounds, depending on the mass of the pre-HB star the ZAHB evolutionary track starts in first overtone (FO) instability strip as an RRc, in the fundamental mode (F) instability strip as RRab, or in the interorder “either-or” region, in which the initial pulsating mode depends on the pre-HB phase related to the onset of CNO. This mechanism may produce an either-or region populated by both RRc and RRab stars or a distribution of clearly separated modes at the red edge of the first overtone instability strip. In the latter case the average period of the RRab stars would be larger (like in OoII clusters) than in the former (the OoI case). One may expect, under this scheme, that the distribution of RRab and RRc stars in the instability strip would tend to present a clear segregation of modes in the OoII and not so in the OoI clusters.
The distribution of RRc and RRab in the HB of several OoI and OoII clusters has been addressed by Arellano Ferro et al. (2015, 2016a). In summary, neat RRc-RRab segregation has been observed in all OoII clusters studied by these authors, namely, NGC 288, NGC 1904, NGC 4590, NGC 5024, NGC 5053, NGC 5466, NGC 6333, NGC 7099. On the other hand, of the studied OoI clusters NGC 3201, NGC 5904, NGC 6229, NGC 6362 and NGC 6934, NGC 6229 and NGC 6362 present a clean segregation of the modes whereas in the others the either-or region is populated by both RRc and RRab stars. The case of NGC 6934 is illustrated in Figure 13 where we have drawn a vertical black line at the border between the distribution of RRc and RRab stars as observed in several clusters. This has been interpreted by Arellano Ferro et al. (2016b) as the empirical red edge of the first overtone instability strip (RFO) and estimated as (V − I)0 ≈ 0.46. This border was reddened by E(B − V ) = 0.1 and assuming E(V −I) = 1.259E(B−V) (Schlegel et al. 1998; Table 6) resulted in (V − I) = 0.586. Clearly in NGC 6934, while the RRc stars fall to the blue of the edge, the RRc and RRab stars share the either-or region.
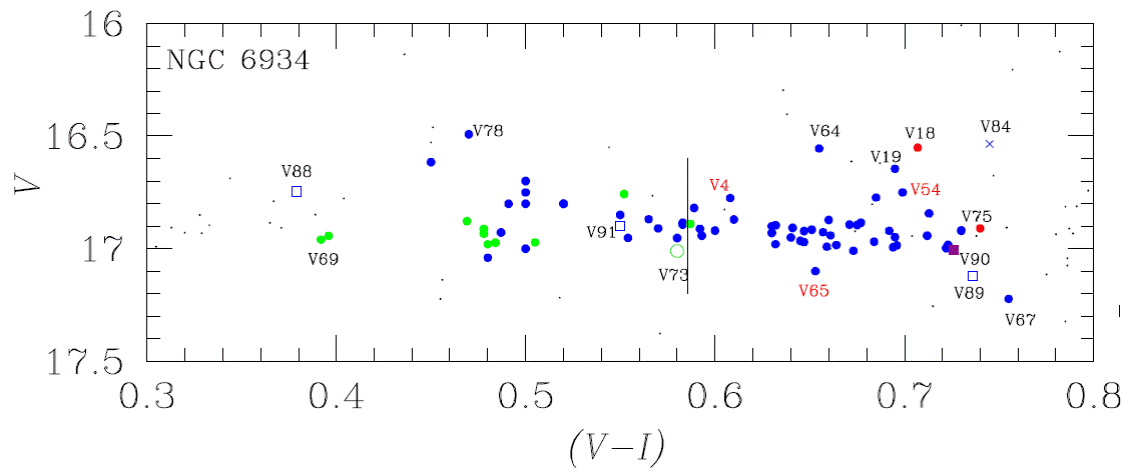
Fig. 13 The distribution of RR Lyrae stars is shown in detail in this blow-up of the HB in NGC 6934. The colour code is as in Figure 8. The vertical line indicates the first overtone red edge as estimated empirically (Arellano Ferro et al. 2016b) and helps realizing that in NGC 6934 the intermode or “either-or” regions is shared by RRab and RRc stars. See § 7 for further discussion. The color figure can be viewed online.
Figure 14 illustrates the distribution of OoI and OoII clusters in the [Fe/H]−L plane, where L is the Lee-Zinn parameter defined as (B − R)/(B + V + R) where B, V, R refer to the number of stars to the blue, inside, and to the red of the IS. Large values of L indicate HB’s with long blue tails while very negative values correspond to clusters with no blue tail and rather red clumps. All OoII have blue tails, with the possible exception NGC 4590, whereas the OoI clusters display an assortment of HB structures. In Figure 14 filled symbols represent those clusters studied by our group and those symbols with a black rim are for the clusters with a clear RRc-RRab segregation, i.e. all OoII clusters and some, NGC 6229 and NGC 6362, among the OoI clusters. No trend is seen for inner and outer halo clusters neither in terms of L nor in the RRc-RRab segregation.
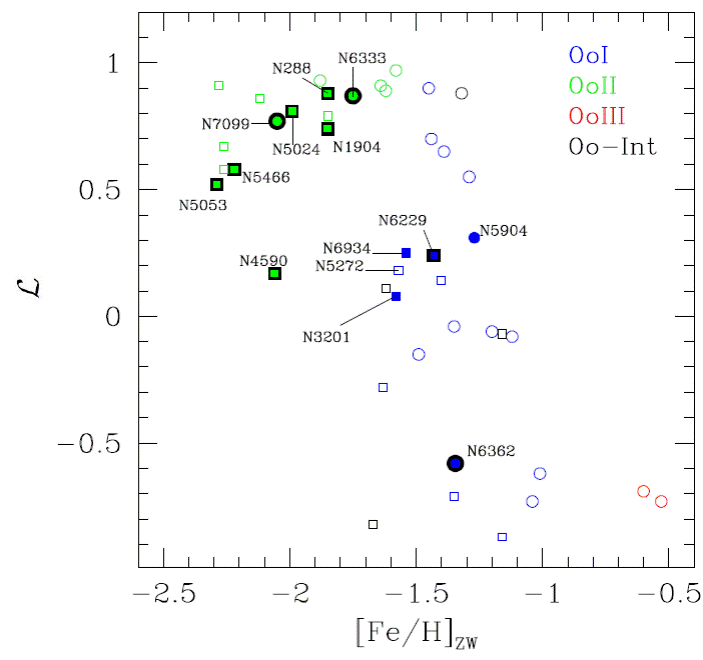
Fig. 14 Distribution of OoI and OoII clusters in the [Fe/H]−L plane. Filled symbols are used for cluster whose HB’s have been studied in detail and those with a black rim show a clear RRc-RRab segregation, i.e. all studied OoII clusters but only some OoI. Circles and squares are used for inner and outer halo clusters respectively.
These observational results, if interpreted according to the scenario proposed by Caputo et al. (1978), imply that in fact RR Lyrae stars in Oo II clusters are evolved from less massive stars starting their evolution across the instability strip on the bluer part of the ZAHB as first overtone pulsators, leading to either-or regions populated exclusively by RRc stars and with RRab stars averaging longer periods. On the other hand, in some OoI clusters, RR Lyrae stars may start their evolution as in OoII clusters (e.g. NGC 6229 and NGC 6362) or if they have a population of more massive stars starting in the redder part of the ZAHB, then they may produce an eitheror region populated by both pulsating modes (e.g. NGC 3201, NGC 5904, NGC 6934). What determines these two circumstances in OoI clusters is not clear, although mass loss in the RGB is most likely the answer. Pre-ZAHB evolutionary models calculated with a range of mass-loss efficiencies (SilvaAguirre et al. 2008) show that if mass loss is efficient, low mass stars will populate preferentially the bluer part of the ZAHB and viceversa. Hence the Oosterhoff type of the cluster must be determined by the mass loss rates being driven in a given system, which in turn may be connected with the primordial chemistry of a particular cluster. One further complication to adopt a single scenario is the growing evidence of the presence of more that one stellar population (e.g. Gratton et al. 2004, Milone et al. 2009, Carretta et al. 2010) at least in some clusters. This will impact on the mass distribution on the ZAHB and hence on the subsequent distribution of stars in the CMD. The mass distribution on the ZAHB has been studied in detail for NGC 5272 (M3), which is considered the prototype of OoI type clusters (Rood & Crocker 1989; Valcarce & Catelan 2008) showing that ZAHB are distributed on both sides of the RFO and suggesting that the either-or regions should be shared by RRc and RRab stars. That this is the case can be seen in the CMD of Valcarce et al. (2008) (Figure 2). Similar studies in other clusters would be very enlightening to understand the observed stellar distributions on the HB of both Oosterhoff type of clusters.
To identify, among a population of cluster RR Lyrae stars, those that may be truly advanced in their evolution towards the AGB is an observational challenge. There are some indicators that, in favorable circumstances, can help to identify evolved stars, e.g. the distribution of RRab stars in the Bailey diagram, as discussed by Cacciari et al. (2005) for M3, or the secular large positive period changes, like those cases identified in M5 by Arellano Ferro et al. (2016a), although extreme values of P can be achieved by the very rapid evolution in pre-ZAHB according to Silva-Aguirre et al. (2008). In the present case of NGC 6934, in Figure 10 we note that stars V4, V54 and V65 fall along the evolved star sequence. Their position on the HB (labeled with red numbers in Figure 13) show V4 and V54 among the brightest RRab as expected for evolved stars. On the contrary V65 is among the faintest. A crucial test for the evolutionary stage of these stars would be to explore their secular period behaviour, P. If truly advanced in their evolution towards the AGB, large positive values of P are expected. Unfortunately to estimate P, data over a large time base are necessary. In the case of NGC 6934 previous photometric studies include that of KOS01, Sawyer-Hogg (1938) and Sawyer-Hogg & Wehlau (1980). While most early light curves are no longer available, we shall try to retrieve times of maximum light or phase information from published material. The results of that effort will be reported elsewhere.
8. Summary of results
We have performed a new CCD photometric study of the globular cluster NGC 6934 and have analyzed the variable stars individually with the aim to confirm their classification and to estimate their physical parameters, particularly the absolute magnitudes and [Fe/H], which in turn lead to the mean values of the distance and metallicity of the parental globular cluster. For the RR Lyrae stars we performed the Fourier decomposition of their light curves to estimate the mean iron abundance and distance [Fe/H]ZW =-1.57±0.13 ([Fe/H]UV ES=- 1.48±0.14) and distance 16.03±0.42 kpc from the RRab stars, and [Fe/H]Z W =-1.53±0.11 ([Fe/H]UV ES=-1.43±0.11) and 15.91±0.39 kpc from the RRc stars; coming from independent calibrations they can be considered as two independent estimations.
Independent distances to the cluster were also calculated via the I P-L of RR Lyrae (Catelan et al. 2004); the P-L relation of SX Phe (Arellano Ferro et al. 2011) and from the bolometric magnitude estimation of the tip of the RG branch (Salaris & Cassisi 1997); the values found were; 15.9±0.5 kpc, 16.3±0.3 and 15.7-16.6 kpc respectively.
We detected 12 new variables; 4 RR Lyrae, 3 SX Phe, 2 Pop II cepheids or CWB, and three semiregural or SR stars. Also one RR Lyrae and four SX Phe were detected that are probably not members of the cluster and for which further exploration is recommended.
We found that inter-order, either-or, region on the HB of NGC 6934 is occupied by both RRc and RRab stars, a characteristic shared with the OoI type clusters NGC 3201, NGC 5272 (M3) and NGC 5904 (M5) and at odds with all OoII type clusters we have studied, and with the two OoI clusters NGC 6229 and NGC 6362. We have speculated that this property is a consequence of the mass loss rates involved during the He flashes and hence the resultant mass distribution on the ZAHB. Further work in the observational-theoretical interface will most likely contribute to the understanding the evolutionary processes and chemical conditions behind the observed stellar distributions on the HB.
We are indebted to Dr. Daniel Bramich for allowing us the use DanDIA and for enriching our work with very constructive comments. AAF acknowledges the support from DGAPA-UNAM grant through project IN104917. We have made an extensive use of the SIMBAD and ADS services, for which we are thankful.


 nueva página del texto (beta)


