1. INTRODUCTION
Contact binaries can be classified into four categories: A-subtype and W-subtype proposed by Binnendijk (1965) in which, in general, the A-subtype shows a transit at primary minimum with mass ratio q<0.3 and periods >0.3 days, the opposite is true for W-subtype. B-subtype proposed by Lucy & Wilson (1979) are systems in geometrical but not in thermal contact, with large surface temperature differences between the components. H-subtype, proposed by Csizmadia & Klagyvik (2004), are systems in which the predominant characteristic is a large mass ratio q>0.72.
Speaking generally, among the A-subtype, is possible to find the deep low-mass-ratio (DLMR) contact binaries, which are systems with a high fill out factor (f >50%) and a low mass ratio (q<0.25) as proposed by Qian et al. (2005) and may be the progenitors of single rapidly rotating stars (Stepień 2011, Tylenda et al. 2011, Zhu et al. 2016, Liao et al. 2017).
The eclipsing binary star CRTS J213033.6+213159 (hereinafter J213033,
1SWASP J212454.61+203030.8 (hereinafter J212454, α 2000 = 21 h 24 m 54 s .61, δ 2000 = +20°30'30'' .8) was proposed as a short period variable star in the list of candidate eclipsing binaries published by Norton et al. (2011), with a period and amplitude of variation of 0.22783 days and 0.15 mag.
A light curve for this system was reported by Lohr et al. (2013), which presented the typical EWtype behavior.
With no previous studies on these systems, the aim of the present work is to analyze their light curves using the latest version of the WilsonDevinney code and to understand the geometrical structure and evolutionary state of these eclipsing binaries. The determination of parameters of contact systems, though resulting only from the light curve solutions, can be useful to improve the empirical relations of overcontact W UMa systems.
2. CCD PHOTOMETRIC OBSERVATIONS AND DATA REDUCTION
Observations were carried out at the San Pedro Martir Observatory with the 0.84-m telescope, a filterwheel and the Spectral Instruments 1 CCD detector (a deep depletion e2v CCD42-40 chip with gain of 1.39 e−/ADU and readout noise of 3.54 e−). The field of view was 7.6' × 7.6' and a binning of 2×2 was used during all the observations. J212454 was observed on August 1 2017 for a total of 5.7 hours while J213033 was observed on the following night for a total of 6.5 hours. In both cases, alternated exposures in filters B, V , Rc and Ic , with exposure times of 20, 10, 6 and 6 seconds, respectively, were taken. Flat field and bias frames were also taken during both nights.
All images were processed using IRAF3 routines. Images were bias subtracted and flat field corrected before the instrumental magnitudes were computed with the standard aperture photometry method. These fields were also calibrated in the UBV (RI) c system and the results, along with the 2MASS magnitudes, are presented in Table 1. Based on this information, we decided to use objects #2 as comparison stars, since they have magnitudes and colors similar to their respective variables, making differential extinction corrections negligible. Any part of the data set can be provided upon request.
TABLE 1 UBV (RI) C AND 2MASS MAGNITUDES OF THE FIELD STARS
| ID | Name | RA (2000) | DEC (2000) |
|
|
|
|
|
|
|
|
|---|---|---|---|---|---|---|---|---|---|---|---|
| 1 | J213033 | 322.640089 | +21.533081 | 16.218 | 15.597 | 14.623 | 14.030 | 13.497 | 12.662 | 12.174 | 12.039 |
| 2 | 2MASSJ21304078+2132332 | 322.669929 | +21.542580 | 16.690 | 15.962 | 14.946 | 14.364 | 13.825 | 12.981 | 12.447 | 12.318 |
| 1 | J212454 | 321.227186 | +20.508471 | 17.334 | 16.763 | 15.808 | 15.211 | 14.642 | 13.494 | 13.039 | 12.849 |
| 2 | 2MASSJ21245253+2031522 | 321.218961 | +20.531240 | 15.153 | 14.519 | 13.561 | 12.971 | 12.471 | 11.682 | 11.127 | 11.059 |
From our observations of J213033 it was immediately clear that the period of 0.224 days proposed by the Catalina Catalog (Drake et al. 2014) was erroneous.
Using our new 2 ToMs presented in Table 2 and the 187 ToMs extracted from the 1SWASP (Butters et al. 2010) observations (more than 20000 measures, available as supplementary data, all heliocentric and determined with the polynomial fit method), we were able to refine the ephemeris of the system as follows:
TABLE 2 TIMES OF MINIMA OF J213033
| HJD | Epoch(1) | O-C(1) | Error | Source |
|---|---|---|---|---|
| 2457968.7484 | -0.5 | 0.0029 | 0.0013 | This work |
| 2457968.8748 | 0 | 0.0017 | 0.0010 | This work |
For J212454 we used our 2 ToMs presented in Table 3 and the 105 ToMs extracted from the 1SWASP (Butters et al. 2010) observations (about 9500 measures available as supplementary data), that permitted us to refine the ephemeris, as shown in equation (2).
TABLE 3 TIMES OF MINIMA OF J212454
| HJD | Epoch(2) | O-C(2) | Error | Source |
|---|---|---|---|---|
| 2457966.8237 | −0.5 | −0.0003 | 0.0009 | This work |
| 2457966.9383 | 0 | 0.0005 | 0.0010 | This work |
The ToMs used, presented in Table 3, are heliocentric and were determined with the polynomial fit method.
We used the data of Table 3 to show the behaviour of the O - C values, as shown in Figure 1. A parabolic trend can be inferred from this figure.
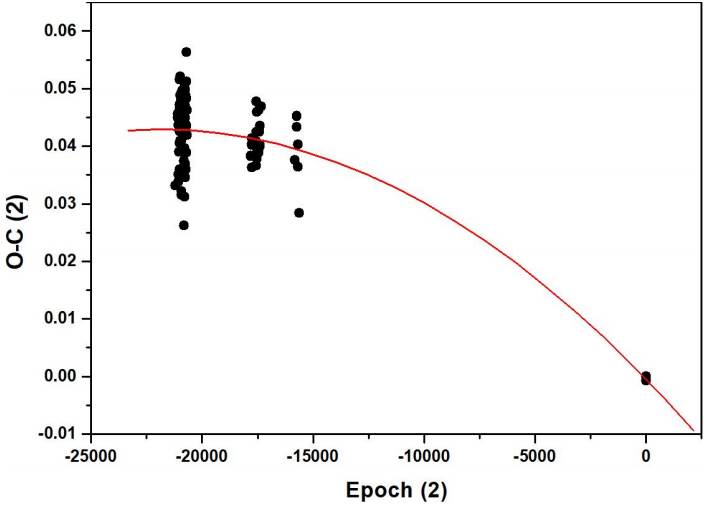
Fig. 1 The points are the data of Table 3. The solid line is the description by a second order polynomial fit to the new ephemeris in equation (2). The color figure can be viewed online.
The data set covers only 13.2 years with a gap of 9.7 years between the last of our ToMs and the previous 1SWASP points. Bearing in mind this gap, it is impossible to see any observable manifestation due to cyclic orbital period variations, which seem to be present in many contact binaries. However, we have calculated an orbital period decrease at a rate of dP/dt = −2.91 × 10⁻⁷ days yr−1.
Such a variation can be explained by either mass transfer from the more massive secondary to the primary star or by angular momentum loss (AML) due to a magnetic stellar wind.
If the parabolic variation is produced by conservative mass transfer, the transfer
rate is
Assuming that the secondary star transfers its present mass to the less massive
primary component on a thermal time scale (Paczyński
1971),
This value M
Another possible mechanism for the parabolic variation is AML caused by magnetic braking. Guinan & Bradstreet (1988) derived an approximate formula for the period decrease rate due to spinorbit-coupled AML of binary systems as follows:
where k is the gyration constant. With k 2 = 0.1, (see Webbink 1976), and with the absolute dimensions of Table 6 we computed the AML rate to be (dP/dt) AML = −4.47 × 10⁻⁸ days yr−1, which is too small (compared with the observed value) by a factor of about 85%. Therefore, with AML alone it is difficult to fully explain the observed secular period decrease.
This means that neither mass transfer nor AML can describe the parabolic variation, indicating that the orbital period decrease could be as a combination of a downward parabola and a light-travel-time (LTT) effect due to a third body.
3. MODELLING THE LIGHT CURVES
Both the systems are newly discovered so there are no reported spectroscopic mass ratios for them; the latest version of the Wilson-Devinney Code (Wilson & Devinney 1971, Wilson 1990, Wilson & van Hamme 2015), was used for simultaneous modelling of our complete light curves.
The temperatures of the hotter components of both systems were estimated using the B − V index from APASS, the AAVSO Photometric All-Sky Survey (Henden et al. 2009), and interpolated from the tables of Worthey & Lee (2011).
We have taken into account the interstellar extinction using the period-color relation discovered by
Eggen and revised by Wang (1994) as (B − V )0 = 0.062 − 1.310logP (days). The results for both systems show that the interstellar extinction is negligible.
The atmospheric parameters adopted here were: from Lucy (1967) the gravity-darkening coefficients were taken to be 0.32 and the bolometric albedos were set to 0.5 (Ruciński 1973). The limb-darkening parameters were interpolated with a square root law from the van Hamme (1993) tables for logg = 4.0 and solar abundances.
Inspection of the light curves indicates that they are similar in shape to the light curves of W UMa-type binary stars. This suggested to us to start the W-D analysis directly in Mode 3, suitable for over-contact binaries (W UMa stars).
The q-search method was applied to find the best initial value of q to be used during the light curve analysis.
A search for a solution was made for several fixed values of q using as adjustable parameters the inclination of the systems i, the mean temperature of the secondaries T 2, the surface potentials Ω1 = Ω2, and the monochromatic luminosities of the primaries L 1.
The behavior of the sum of squares of residuals, Σ(res)2, was used to estimate a best value.
Then the value of q corresponding to the minimum of Σ(res)2 was included in the list of the adjustable parameters and a more detailed analysis was performed.
As shown in Figure 3, the light curves display an evident inverse O’Connell effect (O’Connell 1951) that should not be ignored. The maximum at phase 0.25 (Max I) is clearly fainter than that at phase 0.75 (Max II). In Table 4 we can see that the value of this asymmetry decreases from short to long wavelength; this is an indication that the spot is wavelength dependent and hotter than the surface temperature.
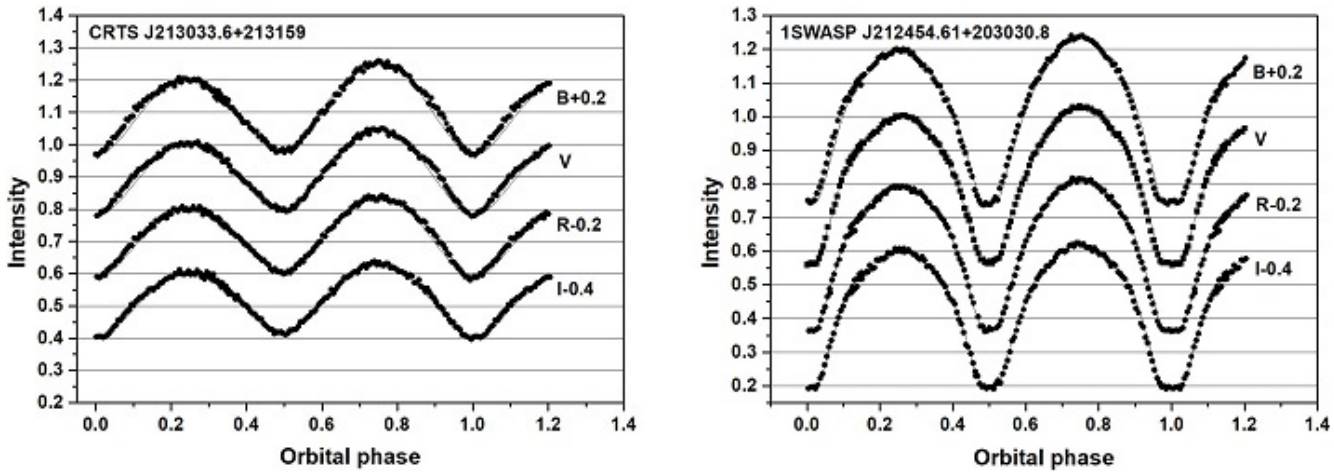
Fig. 3 CCD light curves of J2130033 and J212454. Points are the original observations and lines are the theoretical fits with the spot contribution.
TABLE 4 DIFFERENCES IN THE HEIGHT OF THE MAXIMA (MAG.)
| J213033 | J212454 | |
|---|---|---|
| MaxII - MaxI B | 0.059 | 0.043 |
| MaxII - MaxI V | 0.046 | 0.033 |
| MaxII - MaxI Rc | 0.040 | 0.025 |
| MaxII - MaxI Ic | 0.038 | 0.016 |
We therefore placed a spot at a fixed latitude 90° (i.e. on the equator) on the surface of the more massive component. The other spot parameters: longitude φ , angular radius γ and the temperature factor Ts/T∗, were treated as free parameters and modified along with the adjustable system parameters.
The final derived photometric solution is listed in Table 5. The temperature factor of the spot suggests to us that it is possibly due to the impact from the mass transfer between the components (Lee et al. 2006).
TABLE 5 LIGHT CURVE SOLUTIONS FOR J213033 AND J2124541
| Parameter | J213033 | J212454 |
|---|---|---|
|
|
62.022 ± 0.272 | 88.588 ± 0.220 |
|
|
5200* | 5190* |
|
|
5200 ± 25 | 5080 ± 12 |
|
|
2.136 ± 0.002 | 5.824 ± 0.002 |
|
|
0.186 ± 0.001 | 2.486 ± 0.003 |
|
|
0.5* | 0.5* |
|
|
0.32* | 0.32* |
|
|
0.762 ± 0.006 | 0.321 ± 0.002 |
|
|
0.769 ± 0.005 | 0.317 ± 0.001 |
|
|
0.769 ± 0.004 | 0.313 ± 0.001 |
|
|
0.773 ± 0.004 | 0.311 ± 0.001 |
|
|
0.189 ± 0.004 | 0.629 ± 0.003 |
|
|
0.188 ± 0.004 | 0.636 ± 0.003 |
|
|
0.187 ± 0.003 | 0.641 ± 0.003 |
|
|
0.187 ± 0.003 | 0.656 ± 0.002 |
|
|
0.517 ± 0.006 | 0.168 ± 0.007 |
|
|
0.789* | 0.794* |
|
|
0.456* | 0.461* |
|
|
0.268* | 0.271* |
|
|
0.149* | 0.151* |
|
|
0 | 0 |
|
|
0.507 ± 0.001 | 0.291 ± 0.001 |
|
|
0.559 ± 0.001 | 0.305 ± 0.001 |
|
|
0.586 ± 0.001 | 0.343 ± 0.002 |
|
|
0.246 ± 0.002 | 0.440 ± 0.001 |
|
|
0.258 ± 0.002 | 0.472 ± 0.001 |
|
|
0.311 ± 0.006 | 0.501 ± 0.001 |
| lat spot (∘) | 90* | 90* |
| long spot (∘) | 110.3 ± 3.6 | 70.3 ± 2.2 |
| radius (∘) | 50.1 ± 2.9 | 23.4 ± 2.2 |
| Temp fac.Spot | 1.025 ± 0.006 | 1.11 ± 0.06 |
| Star | secondary | primary |
| Sum (res)2 | 0.0020 | 0.00019 |
1 Assumed parameters are marked with *.
The final synthetic light curves calculated with the whole set of parameters of Table 5 are shown in Figure 3 as continuous lines.
The observed and the theoretical light curves are in good agreement. A graphic representations and the Roche geometry of the systems is shown in Figure 4.
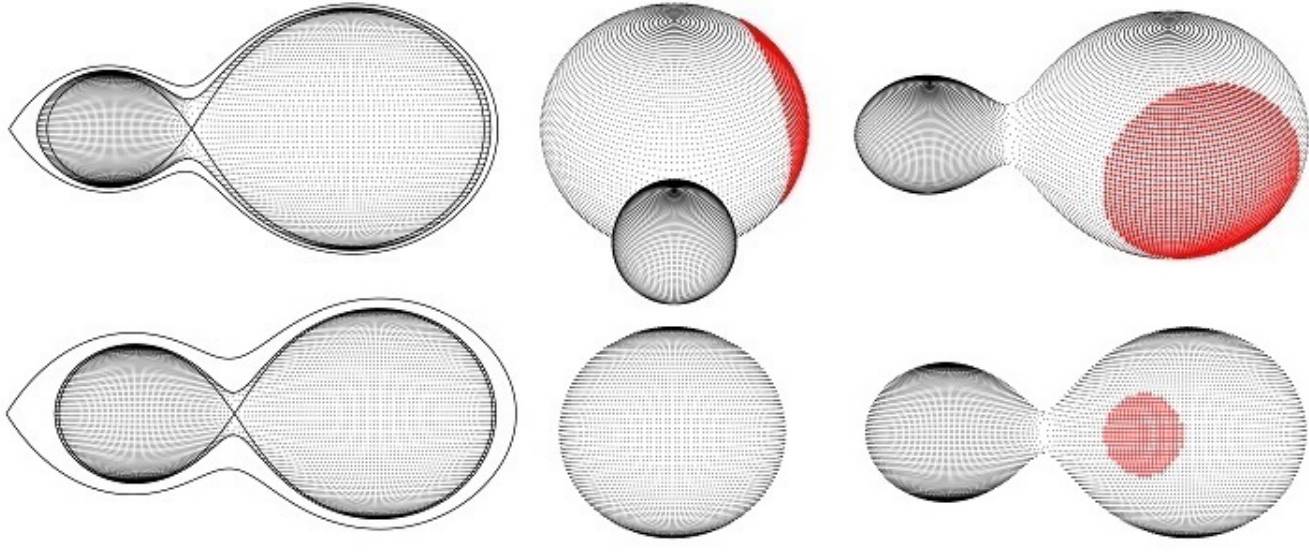
Fig. 4 Graphic representation of J313033 (up) and J212453 (down) according to our solution at quadrature (right) and at primary minimum (center). Left: the configuration of the components of the systems in the orbital plane is shown. The color figure can be viewed online.
In this paper we use the output errors from the DC program keeping in mind that the errors here indicated are the formal errors and are unrealistically small; for a discussion see Barani et al. (2017).
The results of our analysis indicate that J213033 is an A-subtype DLMR system with a low orbital inclination of 62°, while J212454 is a W-subtype shallow-contact binary with a degree of contact lower than 20% (Liu et al. 2016) and a large orbital inclination of 88°. This result implies that it is a totally eclipsing binary system and the photometric parameters here obtained are quite reliable (Terrell & Wilson 2005).
4. EVOLUTIONARY STATE OF THE SYSTEMS
In the absence of spectroscopic elements the absolute parameters cannot be determined directly. However, preliminary absolute elements were derived for each star of both systems using the values from Table 5.
As the two systems belong to different subtypes of the W UMa contact binaries, in the estimation of the absolute parameters we used two different relationships. For J213033 we estimated the global parameters using the empirical relationship “period - total mass” by Yang & Qian (2015) for low massratio binaries through the following formulae.
The derived mean densities of the components, ρ 1 and ρ 2 are estimated according to Mochnacki (1981), the luminosities are calculated using the following formula by Milano &Russo (1983).
While for J212454 we used the “period-semi-major axis” (P,a) relation by Dimitrov & Kjurkchieva (2015).
Knowing the period of J212454 of 0 d .2278293,
where a is in solar radii and P in days.
The (P,a) relation (equation 8) corresponds to the following relation “period-mass” for short-period binaries
where M is the total mass of the binary.
The full set of preliminary absolute parameters is shown in Table 6. These values can be used in statistical diagrams to understand the evolutionary state of the components.
TABLE 6 PRELIMINARY ABSOLUTE ELEMENTS FOR THE SYSTEMS
| J213033 | Primary | Secondary |
|---|---|---|
| Mass( |
0.995 ± 0.001 | 0.185 ± 0.001 |
| Radius( |
1.183 ± 0.001 | 0.676 ± 0.002 |
| Luminosity( |
0.917 ± 0.002 | 0.3± 0.002 |
|
|
4.29 | 4.04 |
|
|
1.47 | 2.27 |
|
|
1.841 ± 0.003 | |
| J212454 | Primary | Secondary |
| Mass( |
0.818 ± 0.010 | 0.329 ± 0.003 |
| Radius( |
0.775 ± 0.005 | 0.515 ± 0.005 |
| Luminosity( |
0.358 ± 0.003 | 0.172± 0.003 |
|
|
4.57 | 4.53 |
|
|
2.484 | 3.405 |
|
|
1.644 ± 0.002 |
Using the list of 46 DLMR binaries published by Yang & Qian (2015) and the seven new systems found in the literature (Table 7), we show the position of J213033 in the evolutionary diagram of Figure 5. Both components of our system follow the general pattern of the DLMR shown in the example: the primaries are evolved or slightly evolved from the ZAMS, and the secondary stars are not evolved.
TABLE 7 PHOTOMETRIC AND ESTIMATED ABSOLUTE ELEMENTS OF SEVEN NEW DLMR SYSTEMS
| System | Period |
|
|
|
|
|
|
|
|
|
|
Ref. |
|---|---|---|---|---|---|---|---|---|---|---|---|---|
| (days) | (K) | (K) | (%) | ( |
( |
( |
( |
( |
( |
|||
| ASAS 050334-2521.9 | 0.41407 | 6347 | 5925 | 0.133 | 53 | 1.260 | 0.168 | 1.540 | 0.600 | 3.450 | 0.400 | 1 |
| ASAS 063546-1928.6 | 0.475515 | 6229 | 6072 | 0.173 | 58 | 1.190 | 0.206 | 1.630 | 0.700 | 3.600 | 0.600 | 1 |
| TYC 1174-344-1 | 0.3887 | 6500 | 6357 | 0.187 | 51.8 | 1.381 | 0.258 | 1.449 | 0.714 | 3.310 | 0.736 | 2 |
| TYC 2058-753-1 | 0.3532 | 5370 | 5394 | 0.103 | 64 | 1.030 | 0.110 | 1.270 | 0.460 | 1.200 | 0.160 | 3 |
| TY Pup | 0.8192 | 6900 | 6915 | 0.184 | 84.3 | 1.650 | 0.303 | 2.636 | 1.373 | 14.112 | 3.862 | 4 |
| V53-M4 | 0.3084 | 7415 | 6611 | 0.078 | 69.1 | 1.470 | 0.115 | 1.383 | 0.481 | 7.306 | 0.465 | 5 |
| V658 Lyr | 0.330257 | 5752 | 5628 | 0.179 | 50.1 | 1.180 | 0.210 | 1.240 | 0.600 | 1.520 | 0.330 | 6 |
Ref. (1) Gezer & Bozkurt (2016), (2) Gürol et al. (2011), (3) Alton (2018), (4) Sarotsakulchai et al. (2018), (5) Li et al. (2017), (6) Martignoni et al. (2018).
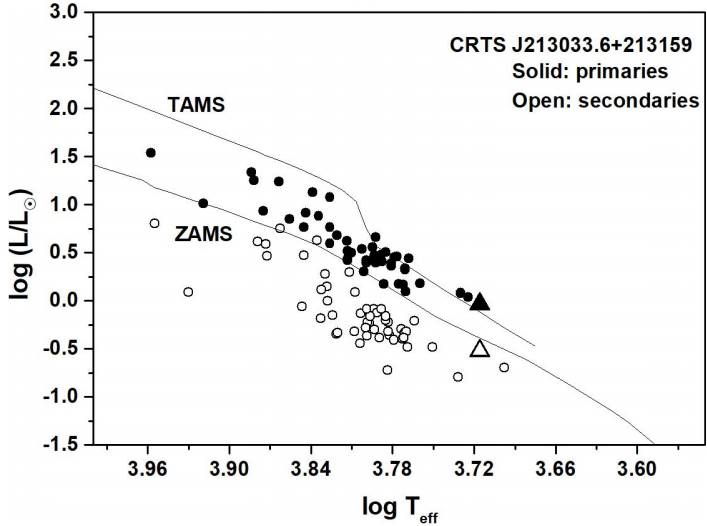
Fig. 5 Position of the components of J213033 in the logT - logL diagram. Zero Age Main Sequence (ZAMS) and Terminal Age Main Sequence (TAMS) are taken from Girardi et al. (2000) for solar chemical composition.
In Figure 6 we plot the components of J212454 together with other W- and A-type W UMa systems collected by Yankut & Eggleton (2005) and Li et al. (2008) on the logarithmic mass-luminosity (ML) relationship, along with the ZAMS and TAMS computed by Girardi et al. (2000).
It is clear from this figure that both components of J212454 are in good agreement with the well known W-type W UMa systems on the logM - logL plane.
The location of the primary component of the system is near the ZAMS line; that means that is not yet evolved. On the other hand, the secondary component deviates significantly from the ZAMS.
With the absolute elements of Table 6 we can infer the dynamical evolution of the binary orbit of the systems using the orbital angular momentum J 0 (Eker et al. 2006). In their paper, Eker et al. investigated 119 chromospherically active binaries (CAB) and 102 W UMa stars by means of the orbital angular momentum (OAM, J 0) and systemic mass (M): they found in the logJ 0 - logM diagram a curved borderline separating the detached and the contact systems. The physical significance of this line is that it marks the maximum OAM for a contact system to survive. If the OAM of a contact system is more than Jlim the contact configuration breaks.
The values of logJ 0 = 51.14 obtained for J213033 and logJ 0 = 51.39 for J212454 place our systems in the region of contact stars in the logJ 0 - logM diagram shown in Figure 7.
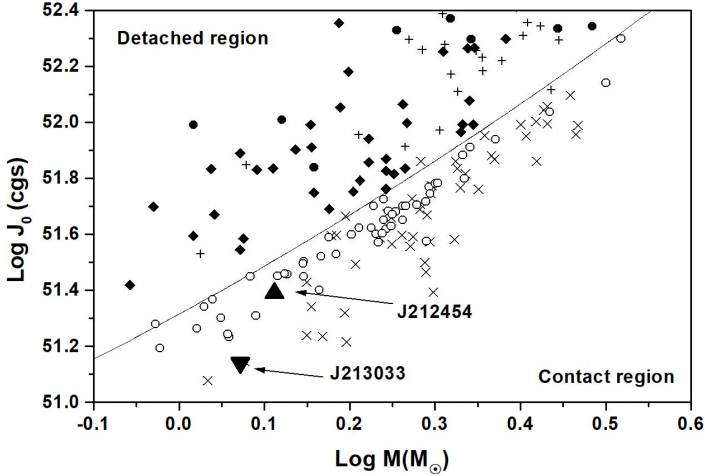
Fig. 7 The position of our systems in the logJ 0 - logM diagram. Symbols are described in Figure 1 of the original paper of Eker et al. (2006).
5. DISCUSSION AND CONCLUSION
CRTS J213033.6+213159 is found to be an A-subtype contact binary with a low mass ratio of q = 0.186 ± 0.001 and showing a high fill-out parameter of f = 51.7 ± 0.6%. With these characteristics the system belongs to the class of the deep low mass ratio (DLMR) eclipsing binaries as proposed by Qian et al. (2005).
1SWSP J212454.61+203030.8 is found to be an W-subtype with a mass ratio of q = 2.486 ± 0.002 (q inv = 0.402) and a shallow fill-out parameter of f = 16.8 ± 0.7%. Note that most of the W-subtype contact systems have shallow contact characteristics. The high orbital inclination i = 88.6° tell us that the system is totally eclipsed and that the photometric parameters here obtained are reliable.
Yildiz & Dogan (2013) developed a method for the computation of initial masses of contact binaries based on the assumption that the mass transfer starts near or after the TAMS phase of the initially massive component, which is the currently less massive component.
They discovered that binary systems with an initial secondary mass higher than
We can apply the method to J212454, to be able to calculate the absolute parameters of the detached system, progenitor of the contact system, as shown in Table 8.
TABLE 8 PARAMETERS OF THE PROGENITORS OF J212454
| Mass parameter | Value |
|---|---|
| Current mass of the
secondary |
|
| Inital mass of he
secondary |
|
| Current mass of the
primary |
|
| Inital mass of the
primary |
|
| Orbital period of the first overflow PFOF |
|
| Semi-major axis at the first overflow |
|
| J current angular momentum |
|
| J |
|
| Mlost |
|
We found that the initial mass of the secondary component would be
The results show that the angular momentum has decreased from 5.51 ×
1051 cgs at the first overflow (FOF) to 1.95 ×
1051 cgs at the present time, concurrently with a mass lost by the
system of
Initially, the binary J212454, in the detached phase, consisted of two main sequence stars. The more massive component (the progenitor of the secondary component) evolved to the TAMS. In combination with the AML, the Roche surface was filled by the evolved secondary component, allowing the mass transfer to begin. Since the FOF until the present time, the orbit has decreased by the AML and mass loss. The angular momentum has been lost to 74.6% of J fof from the stage at the FOF to the present time, producing a smaller orbit.
Two possible mechanisms were examined and we concluded that the continuous period decrease of J212454 is maybe not caused by a thermal mass transfer from the primary to the secondary component, but rather by angular momentum loss due to a magnetic stellar wind.
According to the parameters obtained for the system, we have drawn the configuration of the components using the Binary Maker 3.0 software (Bradstreet & Steelman 2002), which is shown in Figure 3.
For both the systems the small difference in temperature between the components suggest to us that they are in good thermal contact in spite of their different masses and radii.
The light curves of J213033 and J212454 exhibit the inverse O’Connell effect (O’Connell 1951) with the maximum at phase 0.25 (Max I) slightly fainter than that at phase 0.75 (Max II). For this reason a hot spot was placed on the surface of the more massive component.
While for J212454 the hot spot may indicate a probable impact from mass transfer between the components, for J213033 according to Sarotsakulchai et al. (2019), how large a hot spot (50°) should appear on the contact binary system is still unknown.
Both systems belong to spectral type K and are short period (< 0.3 days) contact binaries.
The systems of spectral K-type are important to explain the period cutoff phenomenon, as argued by Liu et al. (2014), and to test the thermal relaxation oscillation theory (TRO theory Lucy 1976, Flannery 1976, Robertson & Eggleton 1977, Yankut & Eggleton 2005, Li et al. 2008).
Presumably, J213033 should be in an extreme phase of contact of the TRO cycle while the opposite should hold for J212454, due to its low fill-out value. However, the available observations are insufficient to reveal any period changes that could explain the behaviour of the mass ratio of the binary system.
Absolute parameters were estimated for the components. Based on these, we discussed the evolutionary status of the systems and concluded that the components of J213033 follow the general pattern of other DLMR, with the primary component evolved or slightly evolved from ZAMS and the secondary situated on the ZAMS, as an unevolved star.
The primary component of J212454 is an unevolved ZAMS star, while the secondary component deviates significantly from ZAMS.
Following the study of Eker et al. (2006) our systems, as expected, are located in the contact region of the logJ 0 - logM diagram.
This research has made use of the International Variable Star Index (VSX) database, operated at AAVSO, Cambridge, Massachusetts, USA; of the VizieR catalogue access tool, CDS, Strasbourg, France. The original description of the VizieR service was published in A&AS 143, 23.
We acknowledge our anonymous referee for comments that helped to improve this work.


 nueva página del texto (beta)


