Introduction
Phylogeography examines the intraspecific lineage relationships throughout the species' distribution area (Avise 2000). Research in this area is highly valuable because it supports studies on genetic differentiation of closely or distantly related populations (Wiley and Lieberman 2011). The phylo-geographic structure in animals appears to be influenced by two main factors: dispersion capacity and gamete dispersal. For benthic invertebrates, larval dispersal seems to be the main factor affecting gene flow and consequently isolation between populations.
The movement of benthic invertebrate larvae is mainly driven by marine currents (Kurihara 2007, Salas et al. 2010), and gene flow is promoted when currents connect populations separated by hundreds of kilometers (Ospina-Guerrero et al. 2008, Van den Broeck et al. 2008). Larval dispersal is also influenced by the time larvae spend in open waters (Paulay and Meyer 2006) or whether the organisms show direct or larval development (Lee and Boulding 2009, Sánchez et al. 2011). Habitat availability is another factor that affects species distribution, since organisms will settle in specific habitats along their distribution range (Kirkendale and Meyer 2004, Elligson and Krug 2006, Crandall et al. 2008).
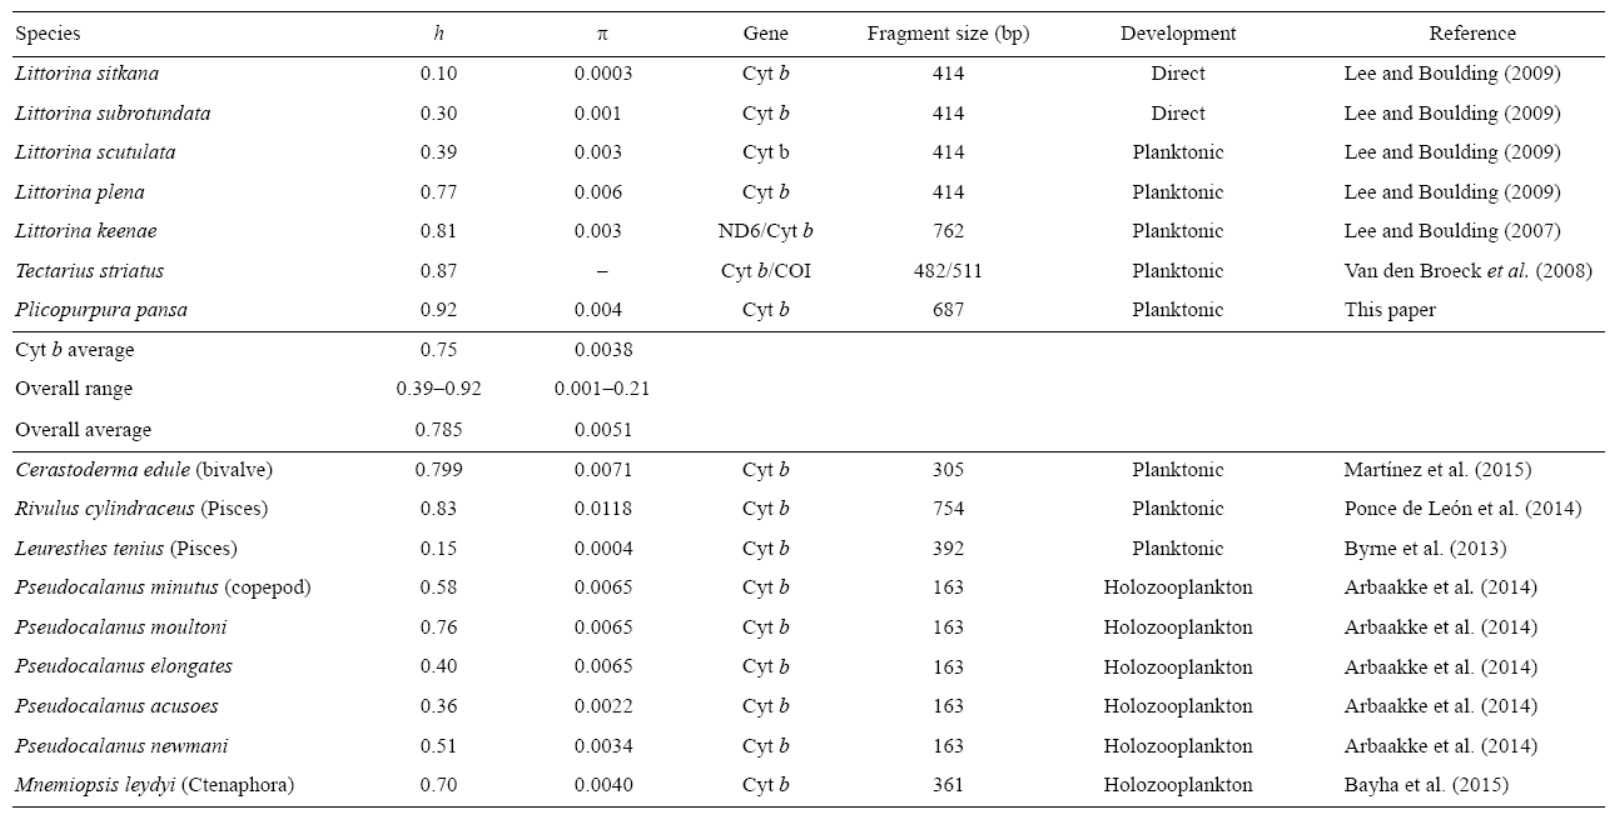
Phylogeographic studies have been based on the quantification of haplotype and nucleotide diversity using mitochon-drial DNA. The common markers in rocky intertidal gastropod species are cytochrome c oxidase subunit I (COI), cytochrome b, or both (Lee and Boulding 2007, Crandall et al. 2008, Van den Broeck et al. 2008, Haupt et al. 2013, Espinoza et al. 2015, Nuñez et al. 2015). Comparative studies with cytochrome b showed nucleotide and haplotype variation in species with planktonic larvae and in those with direct development (Table 1). Snail species from the same genus but with different (larval or direct) types of development pathways (Littorina spp.) showed higher haplotype and nucleotide diversity in planktonic species. Nevertheless, other comparative studies between east and west coast populations of Nucella lima and Siphonaria lessoni showed opposite results in their haplotype and nucleotide diversity depending on the region they inhabit (Cox et al. 2014, Nuñez et al. 2015).
Table 1: Comparison of haplotype (h) and nucleotide (π) diversity of rocky intertidal shelled mollusks and other planktonic invertebrates when cytochrome b (Cty b) was used: bp = DNA base pairs used for the analyses, DNA = NADH dehydrogenase subunit 6, and COI = cytocrome c oxidase subunit I.
The purple snail Plicopurpura pansa (Gould 1853) is a rocky intertidal gastropod from the Tropical Eastern Pacific that spawns in the spring. It is distributed from Baja California Sur, Mexico, to the north of Peru (Keen 1971). The purple snail is an economically important species along the western coast of Mexico since it is used to dye fibers by local people in Oaxaca and Guerrero (Castillo-Rodríguez and Amezcua-Linares 1992). Chávez and Michel (2006) proposed that P. pansa larvae could be part of the plankton for up to four months, from the egg stage to the time when the first recruits are seen. The larvae of P pansa have their own type of movement by velum contractions, shifting from surface to bottom currents.
In this study, we analyzed the genetic and phylogeo-graphic structure of P. pansa and its historic demographic events in the Tropical Eastern Pacific. Since P pansa originated as a result of the rise of the Isthmus of Panama (Collins et al. 1996), and since its larvae spend a long time in the plankton and are found in the continuous rocky intertidal habitat of the Pacific coast, with only some gaps of sandy beaches in northern Central America (Hurtado et al. 2007), we expected to find ancestral haplotypes in the southern populations and derived haplotypes in the northern populations in its eastern Pacific distribution.
Materials and methods
A total of 219 organisms of P. pansa were collected in 2006 from 16 locations on the Pacific coast of Mexico and one in Costa Rica (Fig. 1). Since P pansa shares distribution with Plicopurpura columellaris and there seems to be hybridization, we found some individuals with phonotypic characters of both species; however, only those that were pure P. pansa were collected. Organisms were collected by hand. A small part of the snail foot was sliced and preserved in 95% ethanol for future genetic analyses.
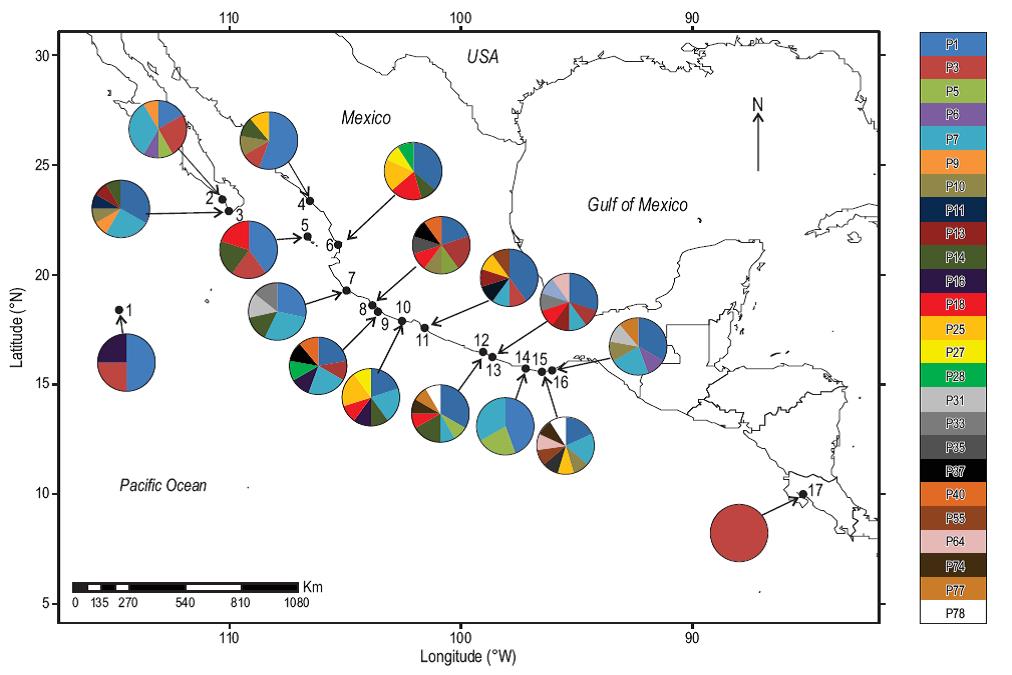
1. Isla Clarión, 2. Pescadero, 3. Cabo San Lucas, 4 Mazatlán, 5. Isla María Madre, 6. Platanitos, 7. Tenacatita, 8. Faro de Bucerías, 9. San Juan de Alima, 10. Peñitas, 11. Barra de Potosí, 12. Playa Ventura, 13. Punta Maldonado, 14. Carrizalillo, 15. Puerto Ángel, 16. Huatulco, 17. Costa Rica.
Figure 1: Sample sites and haplotype distribution among populations of Plicopurpura pansa. Private alleles are not shown.
DNA extraction was conducted using the phenol-chloroform-alcohol method (Palumbi 1996) from a 200-mg tissue sample. A 687-bp DNA fragment of the cytochrome b gene was amplified using the primers 14,841 and 15,573 (Anderson et al. 1981). We did not use any other marker because in earlier studies this marker showed enough resolution to identify the genetic and phylogeographic structure in vertebrates and invertebrates (Nicolas et al. 2012, Yong et al. 2015; see Table 1). PCR amplification was performed in a 25-µLvolume containing 0.2 mM dNTPs, 1.5 mM MgCl2, 0.36 µM of each primer, 1× buffer (10× buffer contains 500 mM KCl and 100 mM tris HCl [pH 8.3]), 1 unit of Taq, 1× BSA, and 50 to 200 ng DNA template. Thermal cycling conditions were the following: initial 1 min of DNA denaturalization at 95 °C, followed by 35 cycles of 1 min at 95 °C, 1 min at 50 °C, and 1 min at 72 °C, and then a final extension cycle of 5 min at 72 °C. PCR products were visualized using electrophoresis through a 0.8% low-melting-point agarose gel stained with ethidium bromide. PCR products were cleaned using the QIAquick Gel Extraction Kit (QIAGEN, Valencia, CA, USA). Sequencing reaction was performed in both directions using the ABI PRISM Big-Dye Terminator v3.1 Cycle Sequencing Kit (Applied Biosystems, Foster City, CA, USA) according to manufacturer recommendations. Sequences were generated in both directions on an ABI 3100-Avant (Applied Biosystems, Foster City, CA, USA) automated DNA sequencer.
Sequence editing and alignment was performed with Sequencher 4.7 (Gene Codes Corporation, Ann Arbor, MI). For coding regions, alignments were refined by eye to translated sequences to confirm reading frame conservation and checked for premature stop codons. Nucleotide diversity (π) and haplotype diversity (h) were estimated with Arlequin 3.11 (Excoffier et al. 2005). Genetic diversity distribution among populations was quantified using analysis of molecular variance (AMOVA; Excoffier et al. 1992) and performed by Arlequin 3.11 (Excoffier et al. 2005). We looked for differences among populations with pairwise FST values (taking into consideration each sampling site as a single population) to see how haplotypes related to each other among populations.
A haplotype network was constructed using maximum parsimony and the median-joining algorithm with the software Network (Bandelt et al. 1999). Fu's FS and Tajima's D tests were performed in order to detect population expansion or constriction with Arlequin 3.11 (Excoffier et al. 2005). We tested the fit of the observed and expected nucleotide site pairwise difference distributions with the constant population model in order to obtain an estimate of initial and final  as was calculated for T. Those parameters were necessary to get the population growth-decline model implemented in Arlequin 3.11 (Excoffier et al. 2005). Harpending's ragged-ness index was calculated to test for goodness of fit of the data in the mismatch analysis.
We analyzed the demographic history of mtDNA clades among the Mexican Pacific coast samples by nested clade analysis (NCA) using ANeCA (Panchal 2007), TCS (Clement et al. 2000), and GeoDis (Posada et al. 2000). To test for geographical barriers in the gene flow, we used Monmonier's algorithm implemented in BARRIER 2.2 (Manni et al. 2004), which includes the Delaunay triangula-tion (Watson 1992, Brouns et al. 2003) that creates a connectivity network among populations. All statistical analyses were interpreted using α = 0.05.
Results
A 687-bp fragment of mitochondrial cytochrome b was sequenced from each of the 216 individuals collected along 3,000 km of coastline from Pescadero, Baja California Sur, to Huatulco, Oaxaca (Fig. 1), with an extra 3 samples from Costa Rica. We found a total of 92 haplotypes (GenBank accession numbers KF372880-KF372966 and KF372969-KF372973). The percent average of C was 17.16%, T was 40.59%, A was 24.72%, and G was 17.52%. Variation of C, T, A, and G content among populations was below 0.16%. In the 687-bp fragment we recognized 98 polymorphic sites, of which 46 were informative and 52 were singleton variable sites. Without considering Costa Rica (h = 0.6) because of the small sample size, haplotype diversity ranged from 0.87 to 0.98 and nucleotide diversity ranged from 0.002 to 0.06 (Table 2). Twenty-six haplotypes were shared with at least one other population, and 66 were private.
Table 2: Genetic diversity of Plicopurpura pansa along the Mexican Pacific coast: n = sample size, H = number of haplotypes per site, h = haplotype diversity, π = nucleotide diversity, D = Tajima's D, and FS = Fu's FS.
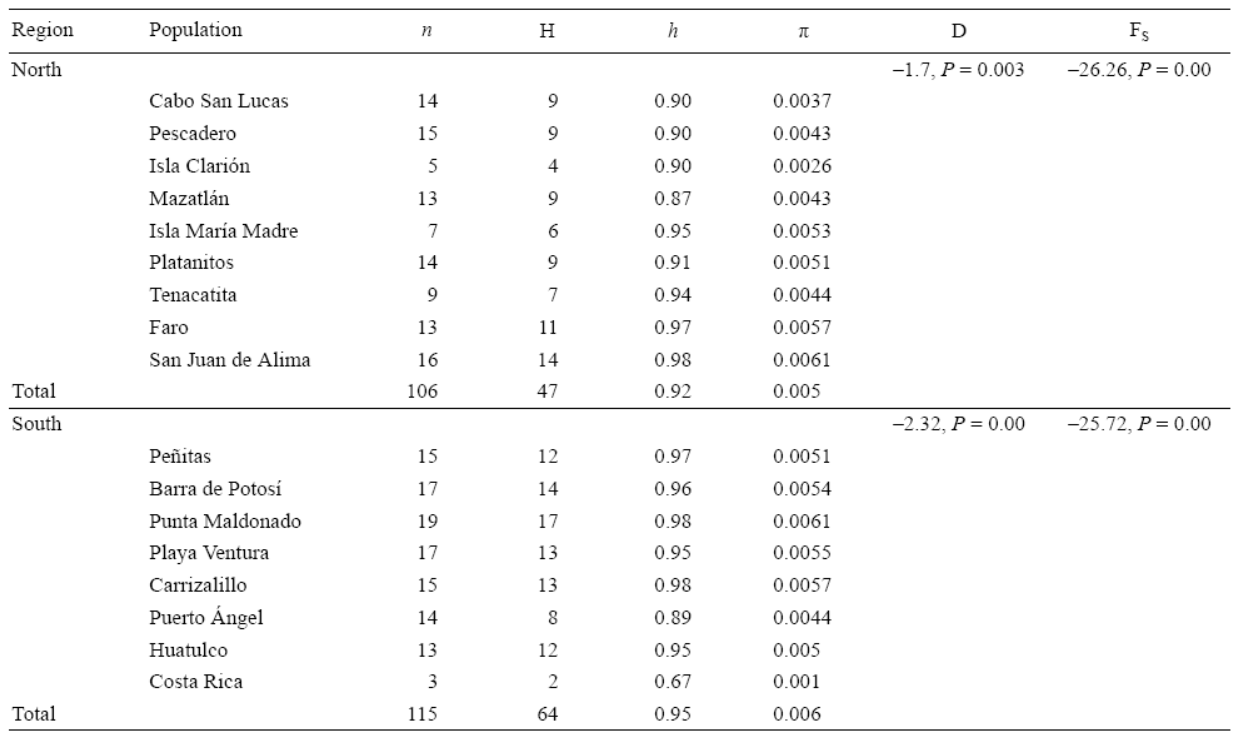
The AMOVA showed that the overall Φ st result across all samples was -0.004 (P = 0.6). When FST values were examined among pairs of populations, the Clarión Island population was significantly different from 6 of the other 15 Mexican populations studied (Table 3)-the Costa Rica population was not considered here due to the small number of samples. The haplotype network was constructed with TCS since the one done with Network did not show significant differences and we decided to leave the one obtained by NCA. It exhibits two major star-like polytomies with two central high frequency haplotypes (haplotypes P1, n = 47, and P7, n = 23; Fig. 2). Fu's FS test for all sites showed negative and significant results (Table 2), as we expected for populations that have undergone recent demographic changes in ecological times. The mismatch distribution analysis showed a uni-modal representation for all populations (Fig. 3), fitting to the sudden expansion model concordance with a raggedness index (r = 0.0128, P = 0.85).
Table 3: FST pairwise difference. Bold face = significant FST value.
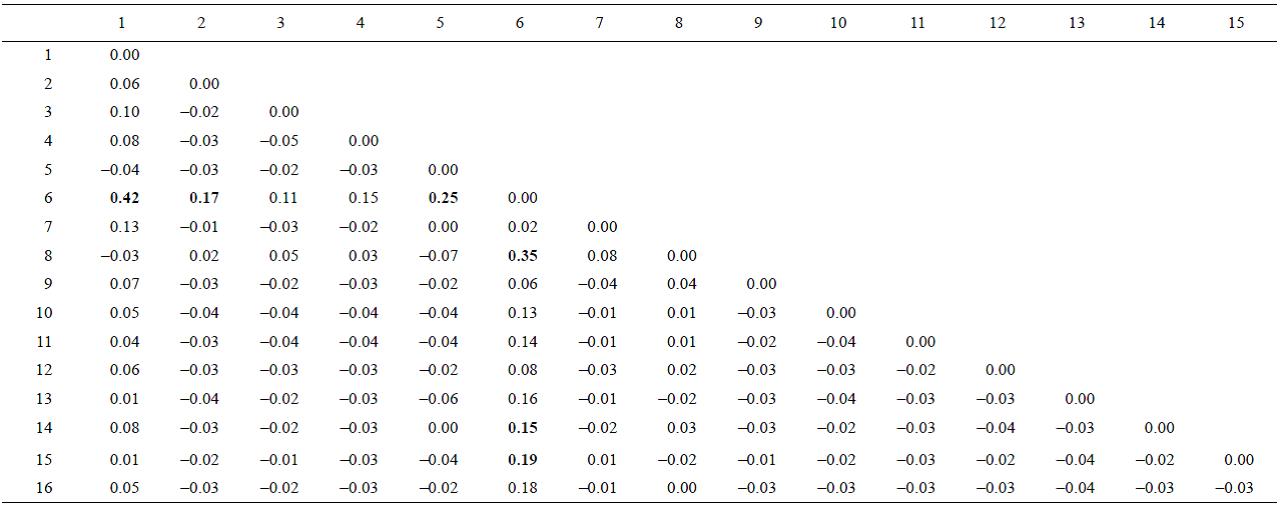
1. Cabo San Lucas, 2. Pescadero, 3. Platanitos, 4. Mazatlán, 5. Isla María, 6. Isla Clarión, 7. Faro de Bucerías, 8. Tenacatita, 9. San Juan de Alima, 10. Peñotas, 11. Barra de Potosí, 12. Punta Maldonado, 13. Playa Ventura, 14. Puerto Ángel, 15. Carrizalillo, 16. Huatulco.
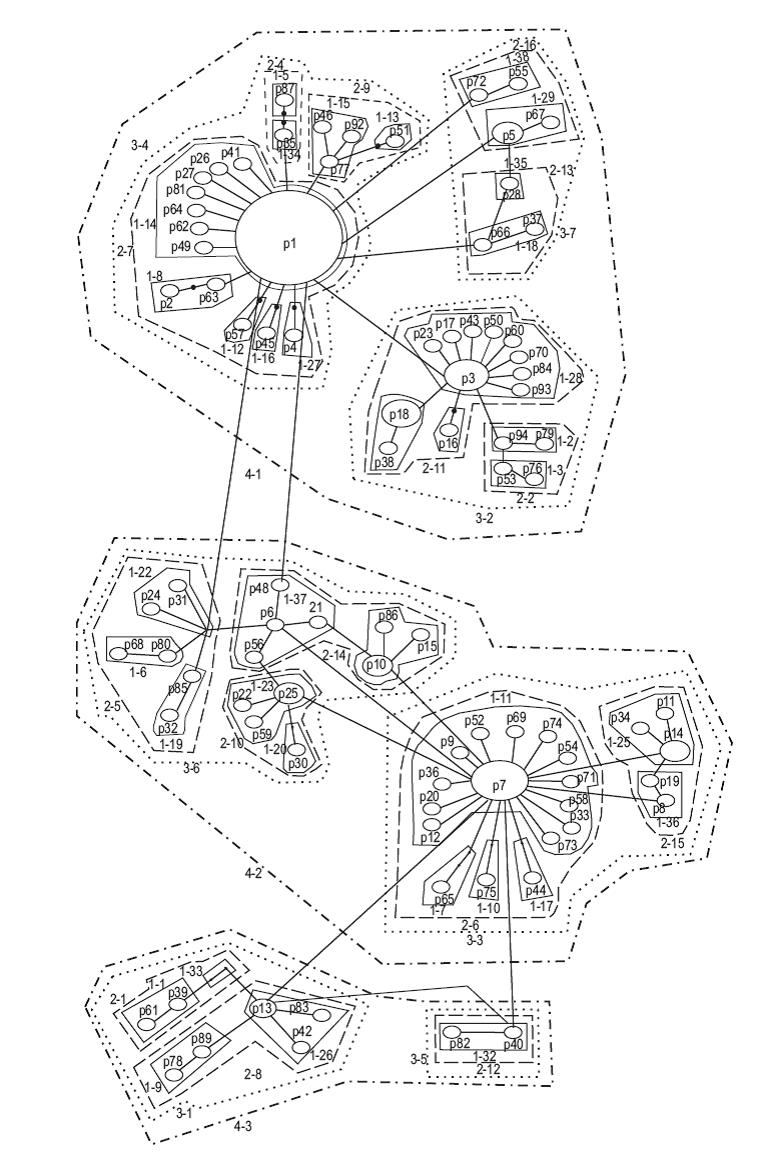
Figure 2: Haplotype network and corresponding nested design from the cytochrome b gene haplotypes of Plicopurpura pansa. The numbers "1-n", "2-n", "3-n", and "4-n" are the numbers for the four different step clades.
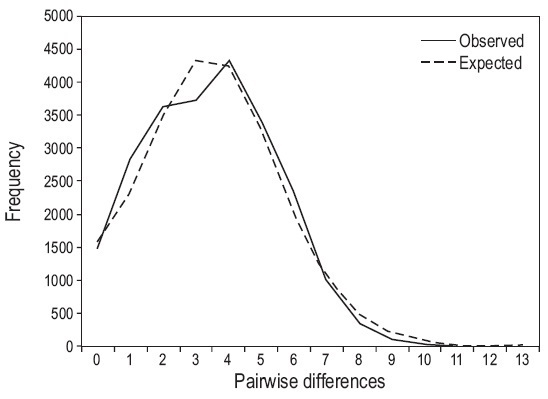
Figure 3: Mismatch distribution analysis according to a population growth scenario for all populations.
Four levels were present in the mtDNA haplotype NCA of P pansa (Fig. 2). Of the 92 haplotypes, 38 were first step clades, 16 second step clades, 7 third step clades, 3 fourth step clades, and 1 fifth step clade (total haplotype network, Fig. 2). Three of all the clades presented restricted gene flow with isolation by distance; these were 1-11, 2-11, and 3-3. The total haplotype network showed a contiguous range expansion.
Our analyses conducted with BARRIER 2.2 showed four barriers when FST and GST data were used. The results obtained with FST and GST show differences in grouping northern populations (from San Juan de Alima to Pescadero), and both show one group for the southern populations (Fig. 4).
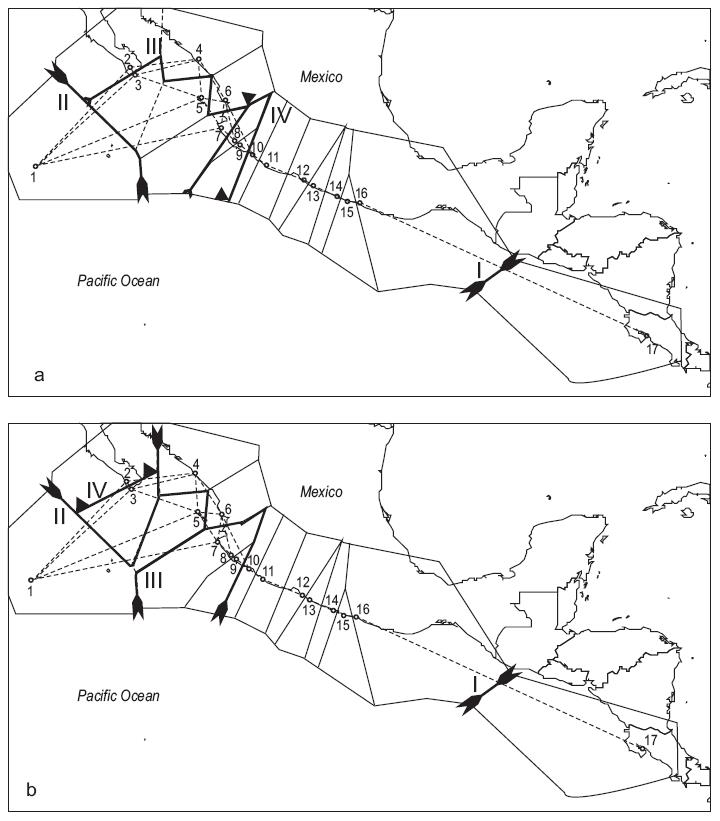
Figure 4: Delaunay triangulated connectivity network of the sample sites with Voronoi tessellations built with the BARRIER 2.2 software. Bold lines represent the four probable barriers to gene flow (decreasing probability from I to IV) as detected with Monmonier's maximum difference algorithm from FST (a) and GST (b).
Discussion
Rocky intertidal gastropods show different patterns of genetic diversity depending on the time larvae spend as plankton (Crandall et al. 2008, Díaz-Ferguson et al. 2012, Haupt et al. 2013) or if they are direct developers (Ayre et al. 2009, Cox et al. 2014). However, there tends to be higher haplotype and nucleotide diversity in species that have free-living larvae compared with those that have direct-developing larvae (Table 1). Our data suggest that the studied populations of P pansa are undergoing expansion. We did not find any phylogeographic or genetic structure among the populations sampled. Overall results may be explained by a recent genetic bottleneck event or by a founder effect (Grant and Bowen 1998, Avise 2000).
There are reports of medium haplotype diversity (using other markers) in other neogastropod species including Mexacanthina lugubris (Fenberg et al. 2014), Megastraea unduosa (Haupt et al. 2013), and Conus sanguinolentus (Duda et al. 2012). Morula marginalba and Haustrum vinosa (Ayre et al. 2009) showed higher values of haplotype diversity despite showing direct development.
One clue of genetic diversity trends in rocky intertidal neogastropods can be elucidated from a study by Cox et al. (2014) on the phylogeography of N. lima on the east and west coasts of the northern Pacific Ocean. Western populations of N. lima showed low haplotype and nucleotide diversity, whereas eastern populations showed high haplotype and nucleotide diversity. This species is a direct developer and is not as highly affected by ocean currents as planktonic species. The western and eastern N. lima populations were isolated by the last glacial period and the eastern population experienced a severe bottleneck. The P. pansa populations on the Mexican Pacific coast seem to respond in a similar way to the eastern N. lima populations due to the effect of gyres and eddies that return the drifting larvae to the beaches where they hatched.
A clear relationship between phylogeographic structure and larval type (and duration) seems to be elusive; however, the lack of genetic structure in our study area along the Mexican Pacific coast may be directly related to ocean currents, which points toward the founder effect hypothesis. Around Clarión Island, whose population differed from 6 of all the Mexican populations studied, currents flow offshore most of the year. Another example is the Tehuantepec Bowl, which may keep all the sample sites along the Mexican Pacific coast in contact since it extends northwards from Oaxaca to Nayarit (Kessler 2006).
The presence of one of the two haplotypes found in Costa Rica that is not found in Mexico might be a result of the presence of an eddie in the Gulf of Tehuantepec and another in the Gulf of Papagayo in Costa Rica. This may prevent the migration of larvae to the north and it may transport the larvae westward more than 1,000 km offshore (Trasviña et al. 1995, Filonov and Trasviña 2000, López-Calderón et al. 2006). Eddies and gyres can act as barriers for the rest of the populations by keeping larvae close to the hatching beach. Furthermore, larvae would have to overcome the large sandy-beach gap, about 1,200 km long, between El Salvador and southern Oaxaca (Hurtado et al. 2007) to reach the closest rocky shore in Huatulco, Oaxaca, a journey that could take the larvae almost a year with an average current speed of 1ms-1.
The distribution of P. pansa along Mexican shores apparently occurred after the rise of the Isthmus of Panama (Barco et al. 2010, Claremont et al. 2013). After the breakup of the ocean, the change of currents promoted the movement of tropical waters off Panama to northern waters (Coates 1997). The presence of one haplotype in Costa Rica and in 6 populations from Mexico (Fig. 1) indicates a putative ancient haplotype spreading among Mexican populations. However, more samples from Central America are needed to identify a haplo-type succession from south to north. Nonetheless, the genetic diversity of the Mexican P. pansa population studied was driven by a founder effect or by a bottleneck process due to barriers in Central America and the Isthmus of Tehuantepec. The lack of structure between samples and the high haplotype and nucleotide diversity could be related to the fact that long-lived planktonic larvae of P. pansa are distributed by ocean currents in Costa Rica and Tehuantepec.


 texto en


