


 texto en
  Inglés (pdf)
 Artículo en XML
 Referencias del artículo
 Enviar artículo por email
 Citado por SciELO
  Similares en
SciELO
Similares en
SciELO 
 Permalink
Introduction
Batoids are one of the least studied groups of marine vertebrates, and most species are classified as ‘data deficient’ (DD) on the International Union for Conservation of Nature (IUCN) Red List of Threatened Species (Dulvy et al. 2008, Hoffman et al. 2010). They are important demersal predators in marine food webs, since their proliferation could generate an ecosystem imbalance, altering trophic dynamics (Navia et al. 2010, Vaudo and Heithaus 2011, Bornatowski et al. 2014a). This is due to their association with high (as prey of top predators) and low trophic levels (Ferretti et al. 2010, Vaudo and Heithaus 2011). They also play an ecological role as bioturbators, since their foraging behavior implies habitat modification (O’Shea et al. 2011).
In Peru, there are 37 batoid species, 8 of which belong to the Rajidae family (Cornejo et al. 2015, Last et al. 2016). The rasptail skate, Rostroraja velezi, inhabits muddy-sandy bottoms in benthic zones (Grove and Lavenberg 1997, Zavalaga et al. 2018) of tropical and subtropical neritic waters, at depths between 35 and 250 m (Zavalaga et al. 2018). It is distributed from the Gulf of California (Mexico) to northern Peru. This species interacts with the fisheries in northern Peru, though the volume of landings is low compared to landings for other batoid species (González-Pestana et al. 2016). It is consumed sporadically and occasionally by locals, so it is of no commercial fishing importance in Los Organos (Piura, Peru). It is incidentally caught in bottom-fishing gear (e.g., trawl and gillnet), especially as bycatch in the Peruvian hake, Merluccius gayi peruanus Ginsburg 1954 (Céspedes 2014), artisanal and trawling fisheries. On a national level, the hake fishery represents one of the main industrial and artisanal fisheries (Arellano and Swartzman 2010), so its impact on R. velezi populations could be high since the trawl fishery yields the largest discards of all fisheries (Pérez-Roda et al. 2019). Rostroraja velezi is listed as ‘data defficient’ on the IUCN Red List due to limited knowledge about its biology and fisheries (Valenti and Kyne 2009).
The diet of R. velezi has been studied in Colombia, Costa Rica, and Mexico (Navia et al. 2007, Espinoza et al. 2012, Simental 2013), wherein demersal prey were found to prevail, mainly decapod crustaceans and small fish. In Peru, there are very few studies about the diet of batoids (Coasaca-Céspedes et al. 2018, Silva-Garay et al. 2018), and there are no studies regarding the diet of the rasptail skate. It is important to learn the feeding habits of this little-studied taxonomic group. Diet studies allow us understand the interactions between species within a trophic web, the trophic position, and the feeding habits (Mar-Silva et al. 2014, González-Pestana et al. 2017, Roque-Ventura 2017, González-Pestana et al. 2018). This information allows us to establish ecological baselines for the development of ecosystem models and holistic fishery management plans, considering the ecosystem, the species living in it, and the species interactions (Shepherd and Andrade 2006).
The present study aims to know the diet of R. velezi in Los Organos, Piura (Peru), through the analysis of stomach contents. Thus, it represents a baseline for future research on the diet of the Rajidae family in this area of the southeastern Pacific.
Materials and methods
Study area and sampling methodology
The samples of R. velezi were collected at Los Organos pier, Piura (4º10′38″ S, 81º07′29″ W), from December to March since 2016 until 2019, during the warm season, which is defined by the high concentration of chlorophyll a and primary production (Pennington et al. 2006) (Fig. 1). All samples were part of the bycatch from the Peruvian hake artisanal fishery, which uses gillnets (7 cm mesh size) at depths between 35 and 220 m.
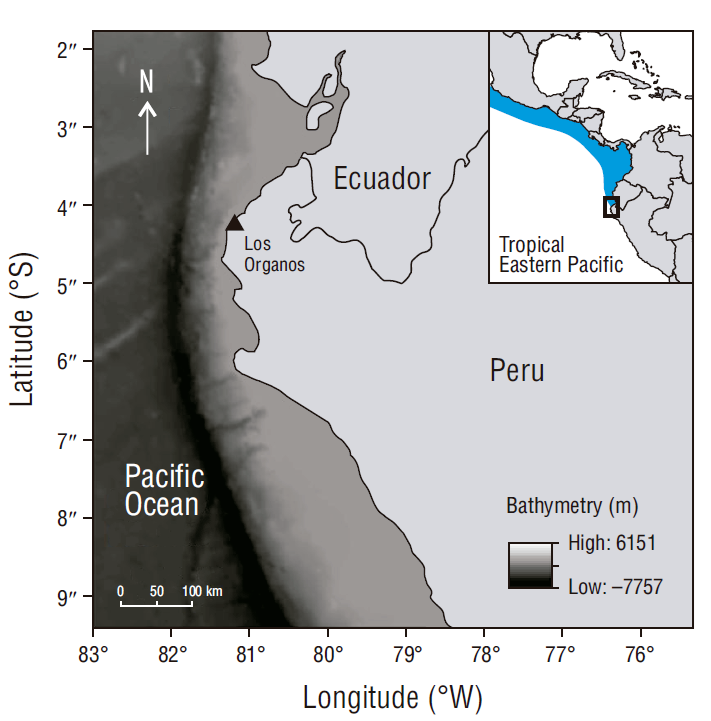
Figure 1 Sampling location for the study of stomach contents of the rasptail skate, Rostroraja velezi. The blue shaded area delimits the Tropical Eastern Pacific marine ecoregion.
The specimens were sexed, considering the presence or absence of claspers, and measured, considering total length (TL, cm) and disc width (DW, cm). The digestive tracts (esophagus, stomach, and spiral valve) were extracted and fixed in 4% formaldehyde. Then, they were stored for 24 h in labeled bottles containing a 10% formalin solution. Finally, the samples were rinsed with distilled water and preserved in 70% ethanol (Ruiz-Campos et al. 2010).
Laboratory Analysis
The digestive tracts were analyzed in the Universidad Cientifica del Sur Research Laboratory. The contents were placed over a 500-µm mesh size sieve (Espinoza et al. 2012) and were then rinsed and analyzed to identify prey to the lowest possible taxonomic level. Prey items were grouped by taxa, counted, and weighed. For the identification of crustaceans, fish, and otoliths, the taxonomic guides of Méndez (1981), Chirichigno-Fonseca and Velez-Dieguez (1998), García-Godos (2001), and Zavalaga et al. (2018) were used. For the identification of cephalopods, the beaks were analyzed; a regression equation considering the beak length measurements was used to estimate the total mass of the individuals (Wolff 1984, Lu and Ickeringill 2002).
Diet analysis
Sampling efficiency was determined using cumulative curves (Ferry and Cailliet 1996) based on the nonparametric estimator Chao 1, which considers the abundance of prey categories (Colwell and Coddington 1994) and was analyzed using 999 resamples in EstimateS 9.1 (Escalante-Espinosa 2003, Colwell 2013, Flores-Ortega et al. 2015). For the construction of the cumulative prey curve, individuals with empty stomachs and unidentified prey were excluded and categories grouped by order and family were used. Sample size was considered reliable for describing the diet if the slope of the curves was less than 0.1 (Soberón and Llorente 1993, Ferry and Cailliet 1996, Magurran 2004). Sampling efficiency, as well as the performance of the estimator, was also calculated considering bias and accuracy (Chiarucci et al. 2003, Walther and Moore 2005). The R statistical program v.3.2.2 (Core Team 2016) was used for modeling the curves and obtaining the coefficient of determination (R 2 ). A good performance of the estimator is observed if the bias and accuracy values, which may vary between -1 to 1, are close to zero (Palmer 1990, Brose et al. 2003). An R 2 value equal or close to one with a P value < 0.05 determines a good fit between both curves (Motulsky and Christopoulos 2003).
The diet was quantified at a general level and by sex through the following percentages: numerical, which accounts for the number of individuals in a prey category and the total of prey individuals; gravimetric, which accounts for the weight of individuals in a prey category and the total weight of individuals; and frequency of occurrence, which accounts for the number of occurrences of individuals in a prey category and the total number of stomachs. The index of relative importance (IRI) was calculated by adding the numerical and the gravimetric percentages and then multiplying the sum by the percentage of frequency of occurrence (Pinkas et al. 1971). Next, the IRI percentage was obtained by dividing the IRI of each prey category by the total IRI of the prey items (Cortés 1997). Finally, the prey-specific IRI (%PSIRI) was obtained (Brown et al. 2012). The %PSIRI is independent of the taxonomic level, allowing for more reliable comparisons between studies (Brown et al. 2012).
The trophic position of the rasptail skate was calculated by adding the proportion of the weight of the prey item, multiplied by each trophic position of each prey item, all of this added to one (Christensen and Pauly 1992). The value of the trophic position of the prey items was obtained from the scientific literature (Cortés 1999, Espinoza 2014).
Analysis of the diet by sex
Analysis of similarity (ANOSIM) was used, where the value of the R statistic allows establishing the degree of similarity. A value of zero with a P value < 0.05 indicates that there are no significant differences between the diets, and a value of one with a P value < 0.05 indicates that there are significant differences (Clarke 1993). The similarity percentage was then used to determine the prey groups that contributed the most to the dissimilarity between diets by sex (Clarke 1993). The R statistical program v.3.2.2 (Core Team 2016) was used for the analysis of the diet at the gender level.
Results
Sample characterization
A total of 74 R. velezi stomachs were collected, 59 (79.7%) of which had stomach contents. The size of the individuals ranged between 47.6 and 81.9 cm TL (34.5-83.5 cm DW), with average and standard deviation values of 64.6 ± 8.7 cm TL.
Sample representativeness
The cumulative prey curves by order and family ranks showed an asymptotic trend (slope for order = 0.01, slope for family = 0.006) and a sampling efficiency of 93.7% for order and 94.0% for family (Figs. 2, 3). Thus, the number of samples is representative of the diet of R. velezi at both taxonomic levels. The coefficient of determination indicated a good fit between both curves (R 2 = 0.98, P value < 0.05) at both taxonomic levels analyzed. Likewise, the bias (0.08) and accuracy (<0.01) values indicated good estimator performance.
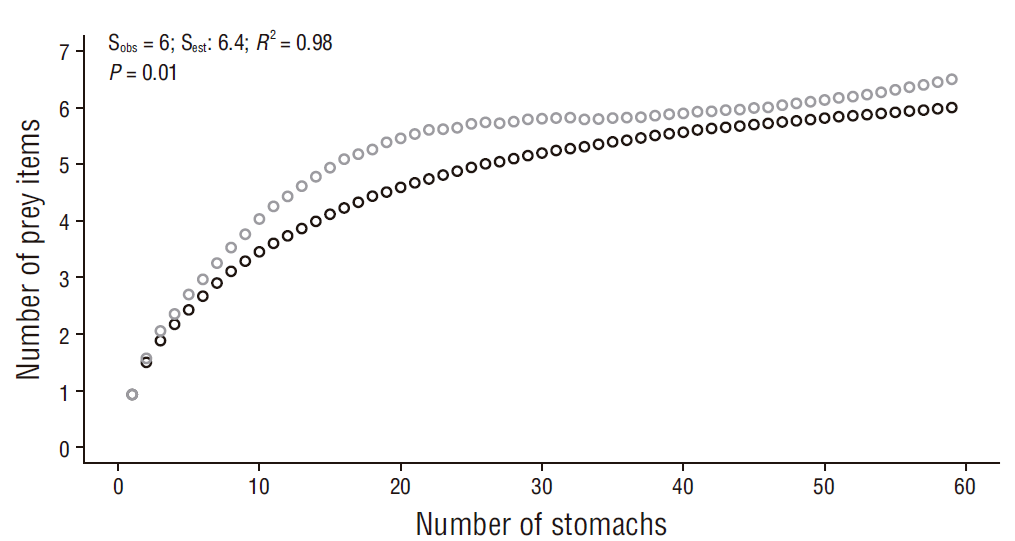
Figure 2 Cumulative curve of prey items identified to the taxonomic level of order for the rasptail skate, Rostroraja velezi. Black open circles: observed data (Sobs); gray open circles: estimated data (Sest) (N = 59).

General diet composition
The diet of R.velezi included 8 prey items: Decapoda, Myctophiformes, Ophidiiformes, Scorpaeniformes, Octopoda, Teuthida, Cephalopa (unidentified), and Teleostei (unindentified) (Table 1). According to the %PSIRI, the most important prey groups were decapod crustaceans (54.1%), mainly the genus Acanthephyra (31.4%) and unidentified decapods (15.1%), and teleost fish (31.5%). Acanthephyra faxoni and Acanthephyra trispinosa have been recorded off northern Peru (Méndez 1981, Moscoso 2012), so it is possible that R. velezi preys on either of these 2 species.
Table 1 Diet composition by sex for the rasptail skate, Rostroraja velezi, (N = 59) in northern Peru. %N, percentage by number; %W, percentage by weight; %FO, percentage by frequency of occurrence; %IRI, index of relative importance expressed as a percentage; %PSIRI, prey-specific index of relative importance; and SD, standard deviation.
| Female (n = 32) | Male (n = 27) | ||||||||||||
| Prey items | % N | % W | %FO | %IRI | %PSIRI | SD | %N | %W | %FO | %IRI | %PSIRI | SD | |
| Crustacea | 70.67 | 47.55 | 90.63 | 55.32 | 59.11 | 61.40 | 31.30 | 66.67 | 49.85 | 46.35 | |||
| Decapoda | |||||||||||||
| Unidentified decapods | 26.67 | 9.45 | 31.25 | 20.83 | 18.06 | 36.35 | 17.54 | 3.50 | 29.63 | 19.68 | 10.52 | 34.03 | |
| Penaeidea | 1.75 | 0.87 | 3.70 | 0.13 | 1.31 | 0.67 | |||||||
| Munididae | |||||||||||||
| Pleuroncodes monodon | 9.33 | 5.12 | 21.88 | 8.10 | 7.23 | 17.58 | 8.77 | 9.46 | 11.11 | 11.09 | 9.11 | 31.98 | |
| Oplophoridae | |||||||||||||
| Acanthephyra sp. | 34.67 | 32.98 | 37.50 | 26.39 | 33.82 | 40.80 | 33.33 | 17.48 | 22.22 | 18.94 | 25.41 | 37.21 | |
| Teleosti | 21.33 | 35.80 | 46.88 | 34.41 | 28.57 | 21.05 | 50.11 | 40.74 | 33.85 | 35.58 | |||
| Unidentified teleosts | 18.67 | 9.95 | 40.63 | 29.87 | 14.31 | 43.16 | 14.04 | 46.93 | 29.63 | 22.74 | 30.48 | 38.28 | |
| Myctophiformes | |||||||||||||
| Myctophidae | 1.75 | 1.40 | 3.70 | 3.70 | 1.58 | 19.25 | |||||||
| Ophidiiformes | |||||||||||||
| Ophidiidae | 5.26 | 1.78 | 7.41 | 7.41 | 3.52 | 26.69 | |||||||
| Scorpaeniformes | |||||||||||||
| Peristediidae | |||||||||||||
| Peristedion barbiger | 2.67 | 25.86 | 6.25 | 4.54 | 14.26 | 19.17 | |||||||
| Cephalopoda | 8.00 | 16.65 | 18.75 | 10.27 | 12.32 | 17.54 | 18.59 | 37.04 | 16.30 | 18.07 | |||
| Unidentified cephalopods | 5.26 | 0.34 | 11.11 | 2.09 | 2.80 | 6.80 | |||||||
| Octopoda | 5.33 | 0.78 | 12.50 | 6.67 | 3.06 | 20.61 | 3.51 | 2.39 | 7.41 | 4.01 | 2.95 | 19.22 | |
| Teuthida | |||||||||||||
| Loliginidae | |||||||||||||
| Doryteuthis gahi | 2.67 | 15.87 | 6.25 | 3.60 | 9.27 | 13.58 | 8.77 | 15.87 | 18.52 | 10.20 | 12.32 | 27.64 | |
Diet composition and differentiation by sex
A total of 32 females, with sizes that ranged between 44.4 and 81.9 cm TL (37.4-62.3 cm DW) and averaged 65.1 ± 10.3 cm TL, and 27 males, with sizes that ranged between 47.6 and 74.9 cm TL (37.7-57.0 cm DW) and averaged 64.3 ± 6.7 cm TL, were sampled. Decapod crustaceans (59.1%) were dominant in female stomachs, while male stomachs showed a shared dominance of decapod crustaceans (46.4%) and teleost fish (35.6%) (Table 1). There was a significant difference in the diets between sexes; however, this difference was small (ANOSIM: R-statistic = 0.21, P value < 0.01). According to the similarity percentage analysis, the prey groups that contributed the highest percentage of dissimilarity were teleosts (45.4%) and crustaceans (37.3%). The trophic position of R. velezi regarding its diet in northern Peru was 3.90 ± 0.7.
Discussion
The results of this study are similar to those obtained in previous studies on the diet R. velezi in the eastern Pacific, which found similar dominant prey categories. The study by Navia et al. (2007) was the first to describe the diet of R. velezi, highlighting the importance of the decapod crustacean Trachypenaeus sp. (IRI = 30%) and fish (unidentified teleosts, IRI = 61%) as their main prey on the Pacific coast of Colombia. In Costa Rica, Espinoza et al. (2012) also found crustaceans (IRI = 57%) and teleost fish (IRI = 41%) to be predominant. In Mexico, Simental (2013) determined that the diet of this species was dominated by teleost fish (IRI = 76%). Other studies on the diet of Rostroraja rays have also shown predominance of decapod crustaceans and teleost fish (Woodland et al. 2010, Bornatowski et al. 2014b).
Rostroraja velezi is considered a demersal species given its frequent proximity to the seabed and its morphological characteristics (López et al. 2014, Barbini et al. 2018). However, the findings on its prey taxa allow us to infer that this species has benthopelagic feeding habits (Bianchi 1992, Wetherbee and Cortés 2004, Barbini et al. 2018, Silva-Garay et al. 2018). In Costa Rica, the trophic habitat of R. velezi has been found to shift from benthic to pelagic regions as individuals reach the adult stage (Espinoza et al. 2012). Therefore, we recommend studying the habitat of prey species in order to better understand the feeding habits and habitat of their predators (Munroe et al. 2013). For example, on the central coast of Peru, this benthopelagic displacement, from pelagic to benthic zones, has been observed in other batoid species (i.e., Myliobatis peruvianus and Hypanus dipterurus) through the study of their diets, with benthic (e.g., polychaetes and gastropods) and pelagic (e.g., Engraulis ringens) prey predominating (Silva-Garay et al. 2018). Future research should study the diet of R. velezi by life stages and thus determine if this benthopelagic feeding behavior is associated with their life stages or if it remains constant throughout their ontogeny.
Dominance of pelagic and benthic prey could also be influenced by a time scale (i.e., seasonality and day-night time variability). For example, the diet of Zapteryx brevirostris is composed of mainly polychaetes and amphipods in the summer and cumacean crustaceans in the winter (Barbini et al. 2011). A difference has also been observed between the diets of Rhinobatos leucorhynchus, which has diurnal feeding habits, and R. velezi, which has nocturnal feeding habits (Navia et al. 2007).
Fishing gear in relation to its position in the water column could influence dominance of pelagic or benthic prey (Wehrtmann and Echeverría-Sáenz 2007, Wehrtmann and Nielsen-Muñoz 2009, Espinoza et al. 2012). A dietary preference for benthic prey has been determined in various batoid studies that used bottom trawling as the sampling method (Ebert and Bizzarro 2007, Barbini et al. 2011, Espinoza et al. 2012). In contrast, other studies, including this one, used gillnets as the sampling gear and found mainly pelagic prey (Simental 2013, Bornatowski et al. 2014a, Bornatowski et al. 2014b); this fishing gear is set throughout the water column (Northridge 1992) and allows capturing batoids that are probably feeding on pelagic prey throughout the water column. Future studies of R. velezi in northern Peru could include individuals sampled with different fishing gears, as well as extending the sampling time scale to account for the winter season and the hourly variability in the catch. This would allow us to determine if diet composition changes with different fishing gears and temporal variability.
Rostroraja velezi is considered a secondary predator with a trophic position (TP) of less than four (Cortés 1999). However, the low standard deviation obtained in this study indicates that it could also behave as a tertiary predator. This was reported by Simental (2013), who found that R. velezi occupies the role of tertiary predator (TP = 4.68 ± 0.52). Other Rajiformes rays can behave as secondary and tertiary predators (TP = 3.48-4.22) given their fluctuating feeding habits and the diverse range of prey (Ebert and Bizzarro 2007, Navarro-González et al. 2012, Flores-Ortega et al. 2015). The size of the predator can influence its TP in the ecosystem, with small rays (<100 cm) as secondary predators (TP < 4) and large rays (>100 cm) as tertiary predators (TP > 4) (Ebert and Bizzarro 2007, Simental 2013). Future studies could evaluate if there are dietary differences throughout ontogenetic development and determine if TP changes.
Various diet studies of batoids have shown that there is no significant difference in feeding behavior between sexes, unless the factor maturity stages is included, with which a difference has been found between the diets of adult males and adult females (Espinoza et al. 2012, De la Rosa-Mesa et al. 2013, Bornatowski et al. 2014b, Silva-Garay et al. 2018). This is due to the fact that during the gestation period in females and the gonadal development from juvenile to adult stages in males, feeding requirements vary and influence food preferences (Belleggia et al. 2008, De la Rosa-Mesa et al. 2013). The results obtained in the present study show minor differences in feeding behavior according to sex. However, these results may be biased by ontogeny (Espinoza et al. 2012), since different life stages were present in the samples of both sexes (45.3% mature individuals and 54.7% immature individuals). For this reason, it will be important to carry out future studies that evaluate diet according to the stage of maturity by sex.
When comparing the results of this study, by sex, with the results obtained in Mexico for the same species, we find differences. In this study we observed that both R. velezi females and males feed mainly on crustaceans and, in the case of males, teleost fish too. However, the results obtained in Mexico show that R. velezi females feed on teleosts and cephalopods and males feed mainly on teleost fish (Simental 2013). In this way, locality is also a factor that influences the diet.
These results should be taken cautiously given the high level of taxonomic clustering of prey categories, which could decrease the degree of dissimilarity between diets by sex (Navia et al. 2011). Future studies should consider including maturity stages by sex and increasing spatial coverage and sample size. This study represents the second report on the diet of R. velezi for the southeastern Pacific and the first for Peru, and it therefore represents a baseline for future research on the Rajidae family in this Pacific region.

