


Servicios Personalizados
Revista
Articulo
 texto en
  Inglés (pdf)
 Artículo en XML
 Referencias del artículo
 Enviar artículo por email
Indicadores
-
 Citado por SciELO
 -
 Accesos
Links relacionados
-
 Similares en
SciELO
Similares en
SciELO
Compartir

 Permalink
Contaduría y administración
versión impresa ISSN 0186-1042
Contad. Adm vol.66 no.4 Ciudad de México oct./dic. 2021 Epub 02-Sep-2024
https://doi.org/10.22201/fca.24488410e.2021.2708
Articles
Sensitivity of credit ratings to elasticities of financial ratios with respect to macroeconomic variables: A classifier decision tree model for Mexican companies
1Escuela Superior de Economía del Instituto Politécnico Nacional, México
The factors that influence a change in credit rating are unknown because the allocation process depends on private companies, so identifying these factors in combination with certain macroeconomic situations is essential to manage the credit risk, beyond the private process of assigning grades. The objective of this paper is to determine a set of rules that allow to firm’s management to anticipate the change in the credit rating of a Mexican firm, considering the levels of elasticity of its financial ratios to macroeconomic variables from a data mining approach, through an iterative logit regression fitting process and a classification decision tree model using public data.
Keywords: Credit risk; Classification and regression trees; Data mining
JEL Code: C63; G32; C53
Los factores que influyen en un cambio de calificación crediticia se desconocen porque el proceso de asignación depende de empresas privadas, por lo que identificar estos factores en combinación con determinadas situaciones macroeconómicas es fundamental para gestionar el riesgo crediticio, más allá del proceso privado de asignación de calificaciones. El objetivo de este artículo es determinar un conjunto de reglas que permitan a la gerencia de la empresa anticipar el cambio en la calificación crediticia de una empresa mexicana, considerando los niveles de elasticidad de sus razones financieras a variables macroeconómicas desde un enfoque de minería de datos, a través de un proceso iterativo de ajuste de regresión logística y un modelo de árbol de decisión clasificador utilizando datos públicos.
Palabras clave: Riesgo crédito; Árboles de regresión y clasificación; Minería de datos
Código JEL: C63; G32; C53
Introduction
Credit ratings are issued by credit rating agencies that evaluate the issuer’s ability to pay, mitigate credit risk, and reduce information asymmetry between the debtor and the lender. Credit ratings are benchmarks not only for debt issuers but also for market signals about the company’s financial stability. As shown in the work of Wojewodzki, Poon, and Shen (2018), and Kisgen (2019), credit rating adjustments affect stock price and capital structure.
Due to the changing environment, a company’s ability to meet its obligations is not static, leading to a systematic credit evaluation process. Unfortunately, the methodology of the rating process is not publicly available, so it is impossible to identify and measure the variables used to ratify or change a company’s rating.
A methodology is proposed to solve this information problem by identifying the factors that influence the change in credit rating from publicly available information, such as related financial ratios and macroeconomic data, which includes an iterative modeling process of logistic regressions and a classification tree. Therefore, this methodology can be classified as an essential credit rating methodology.
Beaber proposed one of the first fundamental credit rating models (1966). The author proposed using financial liquidity ratios to predict the probability of bankruptcy. A similar but more recent approach is the work of Le and Viviani (2018), which uses machine learning techniques on financial ratios to predict credit rating changes. It is also worth mentioning Acosta-González, Fernández-Rodríguez, and Ganga (2019), who also included macroeconomic data and financial ratios for the same purpose.
From the fundamental approach is the seminal work of Altman E. I. (1968), who uses multivariate discriminant analysis to predict bankruptcy. Examples of more recent work in that line are seen in the work of Almamy, Aston, and Ngwa (2016), in which Altman’s Z and the cash flow index are used to predict corporate failure, and in the work of Kliestik, Vrbka, and Rowland (2018), who present a discriminant analysis based on financial ratios to reveal unhealthy company development1.
Probably the most common fundamental model to address the issue of financial distress is Merton’s (1974), which is a reference model even today, as shown in the papers by Anuwar and Jaffar (2017) and Lee and Yu (2020) since both papers use it as a basis.
With the evolution of computing power, econometric methods are becoming progressively more critical in the assessment of credit risk. Examples of this trend are works such as Schmid (2012) or Zamore, Djan, K., and Hobdari (2018). Econometric models have used two main methods: qualitative models such as Logit or Probit (Nehrebecka, 2018) and panel data models (Mpofu & Nikolaidou, 2018).
The most commonly used variables in credit risk analysis are financial ratios, according to Woo, Kwon, and Yuen (2020), Mishra and Bansal (2019) or Khemakhem and Boujelbene (2018), and certain macroeconomic variables, as in Dos Reis and Smith (2018) or Hassani and Zhao (2015). In the fundamental approach of the credit risk assessment literature, macroeconomic variables have an important influence on a company’s health, but they do so differently depending on the company’s characteristics, such as financial situation and structure and industry.
This paper proposes to consider the elasticity of key financial ratios for macroeconomic variables such as the spot exchange rate, Gross Domestic Product, employment, interbank interest rate, and country risk, based on a combination of econometric-computational search of significant variables. Specifically, a Logit fitting algorithm, as in Ramlall (2018), and decision trees, as in Bach, Zoroja, Jaković, and Šarlija (2017), are used to establish hierarchical interactions of risk factors inducing changes in credit rating.
The main objective of this paper is to identify a set of rules to forecast changes in the credit rating of a sample of Mexican companies. The paper’s main argument is that if financial ratios are sensitive to macroeconomic variables, then a combination of the elasticities of financial ratios2 for macroeconomic variables serves as a predictor of credit rating changes.
To identify the appropriate combination of elasticities (out of the 12 financial ratios related to the 10 proposed macroeconomic variables), a logistic fitting algorithm is used to select those that are statistically significant out of the 120 elasticities calculated. Once the screening process is completed, a classifier decision tree is used to find the set of rules that guide the credit rating process.
It is important to note that this method correctly classifies 90.6% of the data, and the results show that the industry to which the companies belong is the first and most important grouping criterion, followed by the working capital to GDP elasticity, solvency to consumer default, debt to country risk ratio, and inventory turnover to financial market performance.
Section one of the paper reviews the academic literature on financial ratios as triggers for credit rating changes. It also reviews the most common macroeconomic interactions for credit ratings, creditworthiness and, in general, the company’s ability to meet its financial commitments. Section two presents the proposed methodology that includes the Logit Delete Worse adjustment algorithm used to select the statistically significant elasticities in credit rating changes. These are used as inputs for the classifier tree model that provides the set of rules to forecast rating changes. Section three presents the analysis of the model results. Finally, the conclusions and future research agenda are presented.
Review of the literature
According to the Basel Committee—BCBS3—financial regulations have been strengthened due to recent defaults. A noteworthy regulation is the one requiring that at least two rating agencies must assess the payment capacity of those firms willing to sell debt instruments; for more details, see Hofbauer, Klimontowicz, & Nocoń (2016) and Sbârcea (2014).
As noted in Bonsall and Miller (2017), and Figlioli, Moreira Antonio, and Guasti Lima (2019), credit ratings are market signals capable of changing the cost of debt or the price of equity and, for that reason, are important. Unfortunately, they are not accessible to small companies because only three agencies monopolize this service (S&P, Moody’s, and Fitch), which makes them more expensive.
On the other hand, CRAs came under academic and market scrutiny after the 2007 financial crisis (DeHaan, 2017) and (Hassani & Zhao, 2015). For this reason, academics develop models for credit risk assessment. Examples of such efforts are Duffie and Singleton (2012), in addition to a continuoustime approach with Markov chains, as in Koopman and Lucas (2008) and Dos Reis and Smith (2018).
As part of the academic research, the econometric modeling approach to default probability and credit risk assessment uses dichotomous or categorical variable models. Examples of this approach are Hernandez-Tinoco and Wilson (2013) and Hernandez-Tinoco, Holmes, and Wilson (2018).
The econometric approach also has a branch of discriminant analysis (Altman E. I., 2013), (Zmijewski, 1984), or (Peres & Antão, 2017). The main difference between those papers is the explanatory variables they use (financial ratios or company characteristics), but there is no dominant approach for variable selection (Husein & Pambekti, 2015), (Mihalovic, 2016), or (Alifiaha & Tahir, 2018).
The variety of approaches and works that explain credit events (defaults and rating changes) can be attributed mainly to the fact that the variable selection criteria are not homogeneous due to the sources of information: internal or external to the company. Korol and Korodi (2010) show no single determinant for insolvency.
The academic literature has a theoretical division between internal and external causes. Internal causes include inefficiencies in resource allocation, capital structure, and company management (see Zhang, Bessler, & Leatham, 2013). Similarly, Altman E. I. (2013) and Brusov, Filatova, Orekhova, and Eskindarov (2018) point to the interest coverage and other debt service ratios and changes in the weighted average cost of capital—WACC—as the main reasons for marking a credit rating change.
On the other hand, authors such as Korol and Korodi (2010) or Hernandez-Tinoco and Wilson (2013) highlight external sources arguing that financial statements do not contain all the relevant information about the company. These authors include macroeconomic and market variables to complement them. Liou and Smith (2006), Alifiaha and Tahir (2018), and Hernandez Tinoco, Holmes, and Wilson (2018) also include market information to improve their predictions or analysis of credit events.
Lack of consensus on the determinants of credit events may occur due to non-normality in financial ratios (Alifiaha & Tahir, 2018) (Linares-Mustarós, Coenders, & Vives-Mestres, 2018) or due to collinearity issues and extreme values. Other authors, such as Fontaine Rezende et al. (2017), opt for a previous treatment for the data, such as: discarding variables through collinearity, regression, and correlation tests or censoring extreme values.
Authors such as West (2000), Li et al. (2017) and Tian, Yong, and Luo (2018) explore the use of new techniques such as machine learning and data mining for consumer credit allocation, risk assessment, or bankruptcy prediction. It is important to emphasize that these techniques make no assumptions about the variables’ distributions, variance, or dependence because they eliminate redundancies through iterations or classification.
Among the most effective and popular machine learning and artificial intelligence techniques are artificial neural networks (ANNs). Schmidhuber (2015) and Angelini, di Tollo, and Roli (2008) proposed their use in the financial sector by assessing credit risk using financial ratios.
When the number of variables is cumbersome, or the complexities of the problem are not manageable with traditional methodologies—such as credit rating problems—techniques such as Support Vector Machine (SVM) are a reasonable option to achieve predictions. Lee Y. (2007), Wang (2017), and Prodan-Palade (2017) obtained the same conclusion when comparing supervised learning tools on the same credit risk assessment problem.
In this paper, the classification and regression tree method, CART, was used. This methodology provides more information than other machine learning techniques, including relationships between explanatory variables, although they accept more significant errors than SVM or ANN (Rokach & Maimon, 2014).
Ruxanda, Zamfir and Muraru (2018) found that financial ratios used as inputs to the CART methodology show better performance in periods of financial distress than either SVM discriminant analysis or econometric techniques.
On the other hand, Barboza, Kimura, and Altman (2017) compare SVM, Random Forest, Bagging, and Boosting techniques with traditional econometric models and ANNs that predict bankruptcies one year in advance. The authors obtained a 10% increase in predictive power. These results were similar to those of Wang (2017) and Wagle, Yang, and Benslimane (2017). For a more detailed review of supervised learning algorithms on credit risk, see Devi & Radhika (2018).
It is important to emphasize that the CART methodology can establish a hierarchy and a set of rules for ranking, as in the rating process, which is the objective. Barboza, Kimura, and Altman (2017) showed that the CART methodology, enhanced by bagging or bootstrapping techniques, can achieve greater accuracy in the results. Most articles using these techniques consider proxy variables to measure credit risk (swaps). Nevertheless, one of the limitations of this research is that changes in the rating assigned directly by the rating agencies were considered, and given that these changes are sporadic, the amount of data is relatively small to apply this type of technique.
Methodology
The proposed methodology consists of three stages. The first consists of calculating elasticities between financial ratios and macroeconomic factors (both are public information). These data provide a dynamic view of the companies’ evolution and the macroeconomic environment. In the second stage, unrelated or redundant variables are discarded using a DW Logistic regression adjustment algorithm4. Finally, a classification tree of credit events (rating changes) is constructed based on statistically significant elasticities.
Description of the data
This paper uses public macroeconomic information about the Mexican economy5 and quarterly financial ratios calculated with information from Economática from 1998 - 2018. Apparently, rating agencies have access to the same information as that published6, so the methodology would capture the same dynamics.
First, from the point of view of internal factors that can generate changes in the credit rating, Table 1 presents information related to the financial ratios, their calculation and description, as well as references to works that have used each of the ratios proposed in this article to describe the financial situation of the companies.
Table 1 Financial ratios description
| Liquidity ratios | |||
| Ratio | Name | Description | References |
| Liquidity ratio | LIQ | Current assets/Current liabilities | (Zmijewski, 1984), (Altman E. I., 2013), (Alifiaha & Tahir, 2018) (Ruxanda, Zamfir, & Muraru, 2018) |
| Acid test | PBACID | Current assets -Inventories / Current liabilities | (Fontaine Rezende, da Silva Montezano, Nascimento de Oliveira, & de Jesus Lameira, 2017) |
| Working capital to Assets | RCTA | Current Assets - Current Liabilities) / Total Assets | (Alifiaha & Tahir, 2018), (Altman E. I., 2013), (Fontaine Rezende et al. 2017) |
| Activity ratios | |||
| Ratio | Name | Description | References |
| Inventory turnover | RINVT | Cost of sales /Inventory | (Bendig, Strese, & Brettel, 2017), (Elking et al., 2017), (Chuang, Oliva, & Heim, 2019) |
| Working capital turnover | RCT | Net sales/ Current assets - Current liabilities | (Bendig, Strese, & Brettel, 2017), (Elking et al., 2017), (Chuang, Oliva, & Heim, 2019) |
| Total assets turnover | RAT | Net sales/Total assets | (Fontaine Rezende et al., 2017), (Ruxanda, Zamfir, & Muraru, 2018) |
| Financial leverage ratios | |||
| Ratio | Name | Description | References |
| Debt ratio | RDT | Total liabilities/Total assets | (Hernandez-Tinoco & Wilson, 2013), (Alifiaha & Tahir, 2018), (Hernandez Tinoco, Holmes, & Wilson, 2018), (Ruxanda, Zamfir, & Muraru, 2018), (Kemper, 2020) |
| Debt to equity ratio | RDTCC | Total liabilities/Total capital | (Ruxanda, Zamfir, & Muraru, 2018) |
| Coverage ratios | |||
| Ratio | Name | Description | References |
| Interest coverage ratio | RINTD | EBIT/Interest expenses | (Hernandez-Tinoco & Wilson, 2013), (Hernandez Tinoco, Holmes, & Wilson, 2018), (Kemper, 2020) |
| Profitability ratios | |||
| Ratio | Name | Description | References |
| Net income margin | MUT | Net income/Total operating income | (Altman E. I., 2013) |
| Return on assets | ROA | Net income / Total assets | (Altman E. I., 2013), (Alifiaha & Tahir, 2018), (Ruxanda, Zamfir, & Muraru, 2018) |
| Return on equity | ROE | Net income / Equity | (Ruxanda, Zamfir, & Muraru, 2018) |
Source: created by the authors
Regarding external factors, Hussain et al. (2005) find that Gross Domestic Product has predictive power for estimating financial stress. In this context, the works of Zhang, Bessler, and Leatham (2013), Hernandez-Tinoco and Wilson (2013),Hernandez-Tinoco, Holmes, and Wilson (2018), and Rezende et al. (2017) coincide with the previous one; however, they also incorporate variables referring to interest rates and stock and inflationary indexes.
Among the papers that relate financial ratios of debt, economic activity, and market activity to credit quality are the works of Keenan and Sobehart (1999) and Duffie and Singleton (2012), which show a negative relationship with respect to default rate and GDP growth in the United States up to 1983. In the same respect, Koopman et al. (2012) include the market effect through principal components, and Tang, D. Y. and Yan, H. (2010) use Credit Default Swap (CDS) spreads as a proxy for delinquency in the market.
The above review identifies a consensus in the literature concerning the following variables: Economic Activity Indicator, Stock Market Indicator, Benchmark Interest Rates, Inflationary Indicator, and Delinquency Rate7. In order to incorporate the effect of these variables, Table 2 shows the description, source, and periodicity of the variables used for the Mexican case.
Table 2 Description of macroeconomic variables
| Variable | Description | Source |
| PIB (GDP) | Gross Domestic Product (Millions of Mexican pesos, 2008) | (National Institute of Statistics and Geography, INEGI, 2020) |
| INPC (NCPI) | National Consumer Price Index | (National Institute of Statistics and Geography, INEGI, 2020) |
| TC | Exchange rate, end of quarter (Mexican peso per U.S. dollar) | (Bank of Mexico, BANXICO, 2020) |
| TIIE | Interbank interest rate, 28 days | (Bank of Mexico, BANXICO, 2020) |
| PIBI | Economic indicator of secondary activities | (National Institute of Statistics and Geography, INEGI, 2020) |
| PIBS | Economic indicator of tertiary activities | (National Institute of Statistics and Geography, INEGI, 2020) |
| MC | Commercial bank delinquency rate, consumption | (Bank of Mexico, BANXICO, 2020) |
| MV | Commercial bank delinquency rate, housing | (Bank of Mexico, BANXICO, 2020) |
| IPC (CPI) | Price and Quotations Index, Mexican market, BMV | INVESTING |
| RP | CETES (28-day) and U.S. T-Bills rate differential | (Bank of Mexico, BANXICO, 2020), (Federal Reserve Bank of Saint Louis, 2020) |
Source: created by the authors; quarterly data from 1998 to 2018
Long-term corporate ratings published by Fitch Ratings and Standard & Poors are used. The long-term rating correspondence table in Annex 1-B8 is used to homogenize them. Information is available for 28 debt issuing companies9; 23 rated by Fitch, 17 by S&P, and 12 by both companies, throughout each quarter of the 1998 Q1 - 2018 Q2 period. A value of “0” is assigned to each period with no change in the credit rating and “1” in case of change (better or worse rating). 120 elasticities10 are calculated, and all periods are filtered out (companies with no credit ratings assigned) so that 224 quarterly observations are available.
Discrimination of elasticities: Delete Worse (DW) algorithm
A Delete Worse (DW) algorithm based on logistic regression models is used to discard non-statistically significant elasticities. The DW methodology consists of iteratively discarding non-statistically significant elasticities until the algorithm reaches a Logit model with all significant variables at a 95% confidence level. To avoid the problem of collinearity and consider the collective explanatory capacity of the variables in a model, the algorithm was run with different initial sets of variables, and the statistically significant variables were kept in each run. In the first instance, 60 regressions are performed on sets with pairs of elasticities, followed by 40 regressions on triplets and finally, 24 regressions on quintets. From the significant elasticities resulting from these processes, a list of 28 different elasticities is constructed, from which the DW algorithm consisting of 13 additional regressions is run, concluding with a list of 15 elasticities. Table 3 describes the logistic model using the 15 statistically significant variables.
Table 3 Statistically significant elasticities after running the DW algorithm
| (Intercept)*** | E_RDT_RP* | E_MUT_TIE* | E_RINVT_IPC* |
| E_RCTA_PIB* | E_RDTCC_RP* | E_PBACID_MC. | E_RDTCC_IPC* |
| E_ROA_INPC* | E_RDT_TIE. | E_RINTD_MC* | E_LIQ_MC* |
| E_ROE_INPC* | E_RINVT_MC. | E_LIQ_IPC* | E_ROA_IPC* |
***p < 0.001, **p < 0.01, *p < 0.05 Mac Faden’s pseudo R2 = 0.31, 62.94% model accuracy. Source: created by the authors using (R Core Team, 2020). The variable code is created as: E_financial ratio_macro variable.
Decision trees: CART model
Decision trees are flexible, non-parametric models that capture the interactions between variables conditioning decisions. In the literature, this is called rules: constructing combinations of input values to obtain an output (Faraway, 2016). In these models, the results depend on the individual decisions made at each tree node. A CART model classifies values into a set of defined classes based on sample characteristics.
To prevent the classification and regression tree—CART—from overfitting the model, the tree must be “pruned.” The pruning process consists of eliminating the final nodes that do not greatly diminish the model’s explanatory power (deviation error)11. In this model, the 15 elasticities taken from the previous steps plus two categorical variables (sector and subsector of the company) were used according to the classification of the BMV, which are shown in Table 4, following the works of Liou and Smith (2011) and Karkinen and Laitinen, (2015) who mention that the sector or industry are discriminants that can affect the financial operations of a company.
Table 4 Classification of companies on the Mexican Stock Exchange (BMV)
| Sector | Subsector |
| 1) Energy | Energy |
| 2) Industry |
|
| 3) Materials | Materials* |
| 4) Frequent consumption goods |
|
| 5) Health | Pharmaceuticals, biotechnology, and health sciences |
| 6) Telecommunication services | Communications and media Telecommunication services |
| 8) Non-core assets and services | Consumer Services Retail sales |
Source: created by the authors with information from the Mexican Stock Exchange. *Sectors identified as discriminants of group 2 of the model (see Table 7).
Using the “tree” library (Ripley, 2019) in R, a tree with 17 end nodes was found that classifies 90.6% of the observations. A pruning value, α = 7.01 (corresponding to the median), is used to minimize the complexity cost12. As a result, a classification tree with 13 nodes (7 end nodes) was obtained. Figure 1 shows the decision tree in which the rules that indicate a change or no change of rating are displayed.
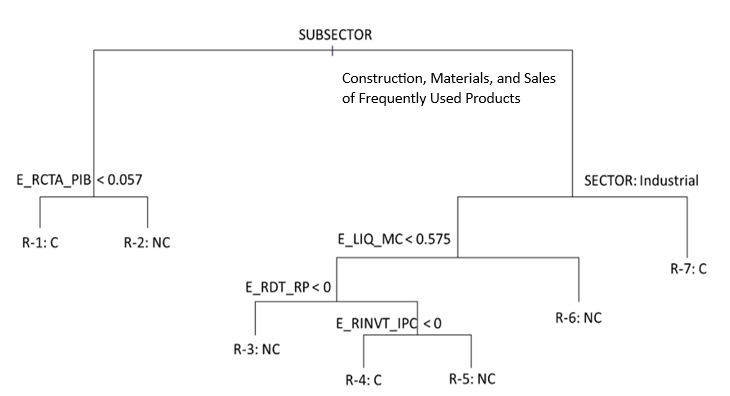
Source: created by the authors using “tree” (Ripley, 2019) in R Project (R Core Team, 2020)
Figure 1 Classification tree, α = 7.01 Tree impurity, D = 119.5, with mean residual error, E = D⁄(n − 7) = 0.55
The model shows that the main classification criteria are the economic sector and sub-sector, revealing different sensitivities to macroeconomic values depending on the industry13. The model establishes greater sensitivity in the construction, materials (both highly procyclical), and consumer staples sectors. Table 5 shows the elasticities that make up the pruned tree classification rules.
Table 5 Significant variables in the pruned tree
| Variable | Financial ratio | Macroeconomic Variable | |
| E_RCTA_PIB | Working capital to assets | Gross Domestic Product | |
| E_LIQ_MC | Liquidity ratio | Commercial bank default ratio, consumer | |
| E_RDT_RP | Debt ratio | Spread between Mexican CETES (28 days) and U.S. T-Bills | |
| E_RINVT_IPC | Inventory turnover | Price and Quotations Index | |
Source: created by the authors with the “tree” package (Ripley, 2019).
The misclassification rate (MC) is calculated to evaluate the classification tree, which measures the model’s ability to generalize an example with a confidence level (Rokach & Maimon, 2014). A crossvalidation test is also performed by generating four mutually exclusive random subsamples with an average MC of 8.5%.
As a final check of the model, a confusion matrix is calculated (see Table 6) as in Chapra (2012) or Rokach and Maimon (2014). The pruned model has an accuracy rate of 90.62%.
Table 6 Precision and accuracy of the model
| Confusion matrix | Rule/Exception | Accuracy | |||||
| Estimate (C) | Estimate (NC) | C | NC | C | NC | ||
| Examples (C) | 18 | 19 | C | 0.49 | 0.51 | 0.9 | 0.09 |
| Examples (NC) | 12 | 185 | NC | 0.01 | 0.99 | 0.1 | 0.91 |
Source: created by the authors based on (Rokach & Maimon, 2014)
Analysis of results
Once the classification tree and confusion matrix are obtained, the credit rating change rules from the model are presented in Table 7.
Table 7 Classification tree rule set
| RULES | |||||
| Rule # | Condition | Likelihood | |||
| Group 1 | |||||
| 1 | SI | E_RCTA_PIB < 0.0564335 | → | C | 0.08 |
| 2 | SI | E_RCTA_PIB > 0.0564335 | → | NC | 0.96 |
| Group 2 | |||||
| 3 | SI | E_LIQ_MC < 0.57 & E_RDT_RP < 0 | → | NC | 0.81 |
| 4 | SI | E_LIQ_MC < 0.57 & E_RDT_RP > 0 & E_RINVT_IPC < 0 | → | C | 0.98 |
| 5 | SI | E_LIQ_MC < 0.57 & E_RDT_RP > 0 & E_RINVT_IPC > 0 | → | NC | 0.56 |
| 6 | SI | E_LIQ_MC > 0.57 | → | NC | 0.92 |
| 7 | SI | Sector = 'Industry' & Subsector='Construction | → | C | 0.84 |
Source: created by the authors based on the classification tree
The right branch of the tree (Figure 1) represents the second group of companies (6) belonging to the subsector: Construction, Materials or Frequent Consumption, see Table 4. In group 1, the probability that one of these companies will receive a rating change is only 8%; however, the model identifies the elasticity between the working capital ratio and the growth of Gross Domestic Product (E_RCTA/GDP) as the main criterion to explain possible rating changes.
The interpretation of the model is that the order of the rule implies hierarchy. For example, Rule 4 states that, in group 2, if the elasticity of the current ratio of liquidity to default, E_LIQ_MC, is less than 0.57 (step 1), and the elasticity of the debt to country risk ratio, E_RDT_RP, is greater than zero (step 2), and, in addition, the elasticity of inventory turnover to the Price and Quotations Index, E_RINVT_IPC, is less than zero (step 3), then there is a 0.98 probability of having a change in the credit rating.
The article’s results are not surprising, as they relate the asset working capital to GDP ratio, E_RCTA_GDP, as the main source of credit rating changes due to its relationship with the company’s short-term ability to meet its financial commitments without external money.
The model also relates the current ratio to delinquency, E_LIQ_MC, meaning that if there is widespread difficulty in collecting debts, companies will have fewer liquid resources and accounts receivable will be less valuable. The next significant elasticity is the borrowing rate spread over shortterm interest rates between Mexico and the United States, E_RDT_RP; this implies that companies that are transnational or strongly related to the U.S. market make financing decisions considering the country risk induced by the rate differential. The increase in the relative cost of money between currencies (exchange rate depreciation) directly demands more liquid resources.
Conclusions
The results of this work show the dynamic nature of a company’s ability to meet its financial commitments, in addition to identifying the effect of the macroeconomic environment on the company’s rating. Moreover, the set of rules obtained from the classification tree analyzes the closed credit rating process.
The structure of the model (set of rules) reflects the traditional and empirical knowledge about the behavior of the company’s ability to pay its debts related to the internal process of the company, such as inventory turnover, liquidity, or working capital to macroeconomic variables, considering the sector to which the company belongs.
The CART model identifies a set of 7 rules (described in Table 7) based on a combination of criteria representing a company’s financial situation and its sensitivity to the macroeconomic environment to forecast possible rating changes.
Rating changes for Mexican companies belonging to the materials and sales of frequent consumption products subsectors (group 2) are susceptible to financial ratios related to liquidity, indebtedness, and activity ratios, as well as their sensitivity to country risk, consumer default, and capital market. In contrast, for most of the companies in the sample (group 1), the rating depends on the sensitivity of the working capital ratio to economic activity as measured by domestic production. It is important to mention that the significant elasticities indicate a relationship between the company’s corporate governance and different types of risk: market, credit, and liquidity.
The proposed methodology combines the best of the two branches of credit rating analysis: the power of computational analysis (step 1, obtain the 10 macroeconomic variables * 12 financial ratios * companies * number of quarterly observations) with the traditional econometric approach (step 2, performed based on the logistic regression model through the DW fitting algorithm that estimates 137 regressions) with the use of a supervised learning technique (step 3, classifier tree and pruning).
The CART model allows company financial managers to identify risk factors and macroeconomic environments that jeopardize the company’s ability to meet its financial commitments. It also allows them to manage these credit, market, and liquidity risks within the margins provided by each company’s respective elasticities.
Future research includes applying the methodology to companies in other countries and comparing whether the rules are maintained. Another possible line of research is to implement the methodology to other types of risk or rating changes; for example, that issued for short-term debt. This methodology can also be improved by including bagging or bootstrapping techniques as long as more observations are incorporated.
REFERENCES
Acosta-González, E., Fernández-Rodríguez, F., y Ganga, H. (2019). Predicting corporate financial failure using macroeconomic variables and accounting data. Computational Economics, 53(1), 227-257. https://doi.org/10.1007/s10614-017-9737-x [ Links ]
Alifiaha, M. N., y Tahir, M. S. (2018). Predicting financial distress companies in the manufacturing and non-manufacturing sectors in Malaysia using macroeconomic variables. Management Science Letters, 8(6), 593 - 604. https://doi.org/10.5267/j.msl.2018.4.031 [ Links ]
Almamy, J., Aston, J., y Ngwa, L. N. (2016). An evaluation of Altman’s Z-score using cash flow ratio to predict corporate failure amid the recent financial crisis: Evidence from the UK. Journal of Corporate Finance , Vol. 36 , February, 36(February), 278-285. https://doi.org/10.1016/j.jcorpfin.2015.12.009 [ Links ]
Altman, E. I. (1968). Financial ratios, discriminant analysis and the prediction of corporate bankruptcy. The Journal of Finance , Vol. 23 , No.4, 23(4), 589-609. https://doi.org/10.2307/2978933 [ Links ]
Altman, E. I. (2013). Predicting financial distress of companies: revisiting the Z-score and ZETA®models. En A. R. Bell, C. Brooks, y M. Prokopczuk, In Handbook of research methods and applications in empirical finance (págs. 428 - 456). Northhampton, MA: Edward Elgar Publishing. https://doi.org/10.4337/9780857936097.00027 [ Links ]
Angelini, E., di Tollo, G., y Roli, A. (2008). A neural network approach for credit risk evaluation. The quarterly review of economics and finance, 48(4), 733 - 755. https://doi.org/10.1016/j.qref.2007.04.001 [ Links ]
Anuwar, M. H., y Jaffar, M. M. (2017). Grading the probabilities of credit default risk for Malaysian listed companies by using the KMV-Merton model. AIP Conference Proceedings, 1870(1), 1 - 8. https://doi.org/10.1063/1.4995857 [ Links ]
Bach, M. P., Zoroja, J., Jaković, B., y Šarlija, N. (2017). Selection of variables for credit risk data mining models: preliminary research. 40 th International Convention on Information and Communication Technology, Electronics and Microelectronics (MIPRO) (págs. 1367-1372). Opatija, Croatia: IEEE. https://doi.org/10.23919/ MIPRO.2017.7973635 [ Links ]
Banco de México, BANXICO. (October de 2020). Sistema de Información Económica. Obtenido de Disponible en: https://www.banxico.org.mx/SieInternet/ Consulatdo 10/08/2020 [ Links ]
Barboza, F., Kimura, H., y Altman, E. (2017). Machine learning models and bankruptcy prediction. Expert Systems with Applications, 83(October), 405 - 417. https://doi.org/10.1016/j.eswa.2017.04.006 [ Links ]
Beaber, W. H. (1966). Financial ratios as predictors of failure. Journal of accounting research, 4, 71 -111. https://doi.org/10.2307/2490171 [ Links ]
Bendig, D., Strese, S., y Brettel, M. (2017). The link between operational leanness and credit ratings. Journal of Operations Management, 52(May), 46 - 55. https://doi.org/10.1016/j.jom.2016.11.001 [ Links ]
Bonsall, S. B., y Miller, B. P. (2017). The impact of narrative disclosure readability on bond ratings and the cost of debt. Review of Accounting Studies, 22(2), 608 - 643. https://doi.org/10.1007/s11142-017-9388-0 [ Links ]
Brusov, P., Filatova, T., Orekhova, N., y Eskindarov, M. (2018). Rating: new approach. En P. Brusov, T. Filatova, N. Orekhova y M. Eskindarov, Modern Corporate Finance, Investments, Taxation and Ratings (págs. 441-474). Cham, Cham, Switzerland: Springer. https://doi.org/10.1007/978-3-319-99686-8 [ Links ]
Chapra, S. C. (2012). Applied numerical methods with MATLAB for engineers and scientists (3rd ed.). New York, New York, USA: McGraw-Hill Education. [ Links ]
Chuang, H. H.‐C., Oliva, R., y Heim, G. R. (2019). Examining the link between retailer inventory leanness and operational efficiency: Moderating roles of firm size and demand uncertainty. Production and Operations Management, 28(9), 2338-2364. https://doi.org/10.1111/poms.13055 [ Links ]
DeHaan, E. (2017). The financial crisis and corporate credit ratings. The Accounting Review, 92(4), 161 - 189. https://doi.org/10.2308/accr-51659 [ Links ]
Devi, S. S., y Radhika, Y. (2018). A survey on machine learning and statistical techniques in bankruptcy prediction. International Journal of Machine Learning and Computing, 8(2), 133 - 139. https://doi.org/10.18178/ijmlc.2018.8.2.676 [ Links ]
Dos Reis, G., y Smith, G. (2018). Robust and consistent estimation of generators in credit risk. Quantitative Finance, 18(6), 983 - 1001. https://doi.org/10.1080/14697688.2017.1383627 [ Links ]
Duffie, D., y Singleton, K. J. (2012). Credit risk: pricing, measurement, and management. Princeton, NJ: Princeton University Press. https://doi.org/10.2143/ast.34.1.504966 [ Links ]
Elking, I., Paraskevas, J.‐P., Grimm, C., Corsi, T., y Steven, A. (2017). Financial dependence, lean inventory strategy, and firm performance. Journal of Supply Chain Management, 53(2), 22 - 38. https://doi.org/10.1111/jscm.12136 [ Links ]
Faraway, J. J. (2016). Extending the linear model with R: generalized linear, mixed effects and non-parametric regression models (2nd ed.). Boca Ratón, Florida, USA: CRC Press. https://doi.org/10.1201/b21296 [ Links ]
Federal Reserve Bank of Saint Louis. (October de 2020). Economic Research, FRED Economic Data. Obtenido de https://fred.stlouisfed.org/ Consultado: 02/10/2020 [ Links ]
Figlioli, B., Moreira Antonio, R., y Guasti Lima, F. (2019). Stock Price Synchronicity and Current and Potential Credit Ratings. International Journal of Economics and Finance, 11(10), 1-16. https://doi.org/10.5539/ijef.v11n10p1 [ Links ]
Fontaine Rezende, F., da Silva Montezano, R. M., Nascimento de Oliveira, F., y de Jesus Lameira, V. (2017). Predicting financial distress in publicly-traded companies. Revista Contabilidade & Finanças, 28(75), 390 - 406. https://doi.org/10.1590/1808-057x201704460 [ Links ]
Hassani, B., y Zhao, X. (2015). Reconsidering Corporate Ratings. Economic Notes: Review of Banking, Finance and Monetary Economics, 44(2), 177-209. https://doi.org/10.1111/ecno.12036 [ Links ]
Hernandez Tinoco, M., Holmes, P., y Wilson, N. (2018). Polytomous response financial distress models: The role of accounting, market and macroeconomic variables. International Review of Financial Analysis, 59(October), 276 - 289. https://doi.org/10.1016/j.irfa.2018.03.017 [ Links ]
Hernandez-Tinoco, M., y Wilson, N. (2013). Financial distress and bankruptcy prediction among listed companies using accounting, market and macroeconomic variables. International Review of Financial Analysis , 30(December), 394 - 419. https://doi.org/10.1016/j.irfa.2013.02.013 [ Links ]
Hofbauer, G., Klimontowicz, M., y Nocoń, A. (2016). Basel III equity requirements and a contemporary rating approach. Copernican Journal of Finance & Accounting, 5(1), 91 - 105. http://dx.doi.org/10.12775/CJFA.2016.005 [ Links ]
Husein, M. F., y Pambekti, G. T. (2015). Precision of the models of Altman, Springate, Zmijewski, and Grover for predicting the financial distress. Journal of Economics, Business, & Accountancy Ventura, 17(3), 405 - 416. http://dx.doi.org/10.14414/jebav.v17i3.362 [ Links ]
Hussain, M. I., Nassir, A. M., Mohamad, S., & Hasan, T. (2005). Prediction of corporate financial distress of PN4 companies in Malaysia: A logistic model approach. Journal of Restructuring Finance, 2(02), 143-155. https://doi.org/10.1142/s0219869x05000440 [ Links ]
Instituto Nacional de Estadística y Geografía, INEGI. (October de 2020). Banco de Información Económica (BIE, INEGI). Disponible en: https://www.inegi.org.mx/sistemas/bie/ Consultado 05/10/2020. [ Links ]
Kemper, K. J. (2020). Financial adjustments and credit rating changes. Finance Research Letters, 33(March), 101213. https://doi.org/10.1016/j.frl.2019.06.011 [ Links ]
Khemakhem, S., y Boujelbene, Y. (2018). Predicting credit risk on the basis of financial and non-financial variables and data mining. Review of Accounting and Finance, 17(3), 316 - 340. https://doi.org/10.1108/RAF-07-20170143 [ Links ]
Kisgen, D. J. (2019). The impact of credit ratings on corporate behavior: Evidence from Moody’s adjustments. Journal of Corporate Finance, 58(October), 567-582. https://doi.org/10.1016/j.jcorpfin.2019.07.002 [ Links ]
Kliestik, T., Vrbka, J., y Rowland, Z. (2018). Bankruptcy prediction in Visegrad group countries using multiple discriminant analysis. Equilibrium. Quarterly Journal of Economics and Economic Policy , Vo. 13 , No.3, 13(3), 569-593. https://doi.org/10.24136/eq.2018.028 [ Links ]
Koopman, S. J., y Lucas, A. (2008). A non-Gaussian panel time series model for estimating and decomposing default risk. Journal of Business & Economic Statistics, 26(4), 510 - 525. https://doi.org/10.1198/073500108000000051 [ Links ]
Korol, T., y Korodi, A. (2010). Predicting bankruptcy with the use of macroeconomic variables. Economic computation and economic cybernetics studies and research, 44(1), 201 - 221. [ Links ]
Le, H. H., y Viviani, J.-L. (2018). Predicting bank failure: An improvement by implementing a machine-learning approach to classical financial ratios. Research in International Business and Finance, 44(April), 16 - 25. https://doi.org/10.1016/j.ribaf.2017.07.104 [ Links ]
Ledolter, J. (2013). Data mining and business analytics with R. Hoboken, New Jersey, USA: John Wiley & Sons. https://doi.org/10.1002/9781118596289 [ Links ]
Lee, C. F., y Yu, H.-C. (2020). Application of Discriminant Analysis, Factor Analysis, Logistic Regression, and KMV-Merton Model in Credit Risk Analysis. En C. F. Lee, y J. C. Lee, Handbook of Financial Econometrics, Mathematics, Statistics, and Machine Learning (págs. 4313 - 4328). Washington, DC: World Scientific. https://doi.org/10.1142/9789811202391_0126 [ Links ]
Lee, Y.-C. (2007). Application of support vector machines to corporate credit rating prediction. Expert Systems with Applications , 33(1), 67 - 74. https://doi.org/10.1016/j.eswa.2006.04.018 [ Links ]
Li, Z., Tian, Y., Li, K., Zhou, F., y Yang, W. (2017). Reject inference in credit scoring using semi-supervised support vector machines. Expert Systems with Applications , 74(May), 105 - 114. https://doi.org/10.1016/j.eswa.2017.01.011 [ Links ]
Linares-Mustarós, S., Coenders, G., y Vives-Mestres, M. (2018). Financial performance and distress profiles. From classification according to financial ratios to compositional classification. Advances in Accounting, 40(March), 1 - 10. https://doi.org/10.1016/j.adiac.2017.10.003 [ Links ]
Liou, D.-K., y Smith, M. (01 de May de 2006). Macroeconomic variables in the identification of financial distress. http://dx.doi.org/10.2139/ssrn.900284 [ Links ]
Merton, R. C. (1974). On the pricing of corporate debt: The risk structure of interest rates. The Journal of finance, 29(2), 449-470. https://doi.org/10.2307/2978814 [ Links ]
Mihalovic, M. (2016). Performance comparison of multiple discriminant analysis and logit models in bankruptcy prediction. Economics & Sociology, 9(4), 101 - 118. https://doi.org/10.14254/2071-789X.2016/9-4/6 [ Links ]
Mishra, S., y Bansal, R. (2019). Credit rating and its interaction with financial ratios: A study of BSE 500 companies. En T. Tripti, M. Kumar Dash y G. Agrawal, Behavioral Finance and Decision-Making Models (págs. 251 - 268). IGI Global. https://doi.org/10.4018/978-1-5225-7399-9.ch014 [ Links ]
Mpofu, T. R., y Nikolaidou, E. (2018). Determinants of credit risk in the banking system in Sub-Saharan Africa. Review of development finance, 8(2), 141-153. https://doi.org/10.1016/j.rdf.2018.08.001 [ Links ]
Nehrebecka, N. (2018). Predicting the default risk of companies. Comparison of credit scoring models: LOGIT vs Support Vector Machines. Econometrics, 22(2), 54 - 73. https://doi.org/10.15611/eada.2018.2.05 [ Links ]
Peres, C., y Antão, M. (2017). The use of multivariate discriminant analysis to predict corporate bankruptcy: A review.” Aestimatio. The IEB International Journal of Finance, 14, 108 - 131. https://doi.org/10.5605/IEB.14.6 [ Links ]
Prodan-Palade, D. (2017). Bankruptcy risk prediction models based on artificial neural networks. The Audit Financiar journal, 15(147), 110 - 121. https://doi.org/10.20869/auditf/2017/147/418 [ Links ]
R Core Team. (04 de 2020). R: A Language and Environment for Statistical Computing. R: A language and environment for statistical computing. 25, Vienna, Austria: R Foundation for Statistical Computing. Disponible en: https://www.R-project.org/ Consultado: 01/09/2020 [ Links ]
Ramlall, I. (2018). Some Practical Issues in Credit Risk Modelling. En I. Ramlall, The Banking Sector Under Financial Stability : Volume 2 (Vol. 11, págs. 205 - 211). Bingley, UK: Emerald Publishing Limited. https://doi.org/10.1108/978-1-78769-681-520181009 [ Links ]
Ripley, B. (2019). tree: Classification and Regression Trees. R package version 1.0-40. Obtenido de Disponible en: https://CRAN.R-project.org/package=tree Consultado: 01/09/2020 [ Links ]
Rokach, L., y Maimon, O. Z. (2014). Data mining with decision trees: theory and applications. Vol. 69. World scientific, 2008. (2nd ed., Vol. 69). Singapore: World Scientific. http://dx.doi.org/10.1142/9789812771728 [ Links ]
Ruxanda, G., Zamfir, C., y Muraru, A. (2018). Predicting financial distress for Romanian companies. Technological and Economic Development of Economy, 24(6), 2318 - 2337. https://doi.org/10.3846/tede.2018.6736 [ Links ]
Sbârcea, I. R. (2014). International Concerns for Evaluating and Preventing the Bank Risks-Basel I Versus Basel II Versus Basel III. Procedia Economics and Finance, 16(May), 336-341. https://doi.org/10.1016/S22125671(14)00811-9 [ Links ]
Schmid, B. (2012). Credit risk pricing models: Theory and practice. Springer Science & Business Media, 2012. Munich: Springer. https://doi.org/10.1007/978-3-540-24716-6 [ Links ]
Schmidhuber, J. (2015). Deep learning in neural networks: An overview. Neural networks, 61(January), 85 - 117. https://doi.org/10.1016/j.neunet.2014.09.003 [ Links ]
Tang, D. Y., & Yan, H. (2010). Market conditions, default risk and credit spreads. Journal of Banking & Finance, 34(4), 743-753. https://doi.org/10.1016/j.jbankfin.2009.05.018 [ Links ]
Tian, Y., Yong, Z., y Luo, J. (2018). A new approach for reject inference in credit scoring using kernel-free fuzzy quadratic surface support vector machines. Applied Soft Computing, 73(December), 96 - 105. https://doi.org/10.1016/j.asoc.2018.08.021 [ Links ]
Wagle, M., Yang, Z., y Benslimane, Y. (2017). Bankruptcy prediction using data mining techniques. 8th International Conference of Information and Communication Technology for Embedded Systems (IC-ICTES) (págs. 1 - 4). Chonburi, Thailand: IEE. https://doi.org/10.1109/ICTEmSys.2017.7958771 [ Links ]
Wang, N. (2017). Bankruptcy prediction using machine learning. Journal of Mathematical Finance 7.04 (2017): 908., 7(4), 908 - 918. https://doi.org/10.4236/jmf.2017.74049 [ Links ]
West, D. (2000). Neural network credit scoring models. Computers & Operations Research 27.11-12, 27(11 - 12), 1131 - 1152. https://doi.org/10.1016/S0305-0548(99)00149-5 [ Links ]
Wojewodzki, M., Poon, W. P., y Shen, J. (2018). The role of credit ratings on capital structure and its speed of adjustment: An international study. The European Journal of Finance, 24(9), 735 - 760. https://doi.org/10.1080/1351847X.2017.1354900 [ Links ]
Woo, S.-H., Kwon, M.-S., y Yuen, K. F. (2020). Financial determinants of credit risk in the logistics and shipping industries. Maritime Economics & Logistics , In press, 1 - 23. https://doi.org/10.1057/s41278-020-00157-4 [ Links ]
Zamore, S., Djan, O., K., A. I., y Hobdari, B. (2018). Credit risk research: Review and agenda. Emerging Markets Finance and Trade, 54(4), 811 - 835. https://doi.org/10.1080/1540496X.2018.1433658 [ Links ]
Zhang, J., Bessler, D. A., y Leatham, D. J. (2013). Aggregate business failures and macroeconomic conditions: A VAR look at the US between 1980 and 2004. Journal of Applied Economics, 16(1), 179 - 202. https://doi.org/10.1016/S1514-0326(13)60008-2 [ Links ]
Zmijewski, M. E. (1984). Methodological issues related to the estimation of financial distress prediction models. Journal of accounting research , 22, 59 - 82. https://doi.org/10.2307/2490859 [ Links ]
1The use of financial ratios such as assets ratio to current liabilities, net income ratio to total assets, non-current liability ratio and current liabilities to total assets, cash ratio and cash equivalents to total assets and return on equity.
3Basel Committee on Banking Supervision (BCBS), 2004. Basel II: International convergence of capital measurement and capital standards: a revised framework. Report 107, Bank for International Settlements, Basel.
5Compiled from INEGI, the Mexican public entity responsible for the compilation and publication of Mexico's National Statistics https://www.inegi.org.mx/sistemas/bie/
6The work uses information from the financial statements published by the companies themselves; therefore, any errors or omissions (deliberate or not) that companies report to avoid downgrades or to improve their rating (creative accounting) are the responsibility of the companies.
7The default rates are constructed as the ratio of non-performing loans to total loans in consumer and mortgage loans, respectively.
8Resolution amending the general provisions applicable to credit institutions: http://dof.gob.mx/nota_detalle_popup.php?codigo=5186974
9ARCA CONTINENTAL, ALSEA, AMERICA MÓVIL, TV AZTECA, BACHOCO, BIMBO, CEMEX, CHEDRAUI, CREAL, CULTIBA, ELEKTRA, ELEMENTIA, FEMSA, GRUPO AEROPORTUARIO DEL PACÍFICO, GRUPO CARSO, HERDEZ, ICA, IENOVA, INMUEBLES CARSO, KIMBERLY CLARK, COCA COLA, GENNOMA LAB, LIVERPOOL, MEXICHEM, PEÑOLES, RADIO CENTRO, SORIANA, TELEVISA
10The elasticities between financial ratios and macroeconomic variables are obtained from the division between the rates of change of each of the 12 ratios in combination with the rates of each of the 10 macroeconomic variables
Received: September 21, 2019; Accepted: November 30, 2020; Published: January 13, 2021
 Este es un artículo publicado en acceso abierto bajo una licencia Creative Commons
