


 nueva página del texto (beta)
 Inglés (pdf)
 Artículo en XML
 Referencias del artículo
 Enviar artículo por email
 Citado por SciELO
  Similares en
SciELO
Similares en
SciELO 
 Permalink
Introduction
Soil contamination causes changes in its properties that can affect the natural processes necessary for plant development (Palm, Blanco, De Clerck, Gatere, and Grace, 2014). For example, in areas affected by spills of oil products and waste, soil degradation has been evident even though they have been restored to regulatory levels (Domínguez-Rodríguez, Adams, Vargas, Zavala, and Romero, 2020). In general, these spills have caused an increase in salinity and soil compaction, as well as a reduction in field capacity, which have been related to the reduction of agricultural production (Almansa-Manrique, Velásquez, and Rodríguez, 2018; Ibarzábal and Bonilla, 2020).
Furthermore, it has been reported that the composition and concentration of some oil products and waste vary depending on the treatment process and, consequently, the effects may vary from one site to another (González, Méndez, García, Sandoval, and Santillám, 2019; Álvarez -Coronel, Domínguez, Adams, López, and Zavala, 2020). For example, Méndez-Moreno et al. (2021) mention that cuttings from drilling production water (generated during the drilling of an oil well) cause salinization and water repellency, but these effects varied depending on the type of soil. For their part, Pérez-Hernández et al. (2017) found that clay-textured soils have greater retention of contaminants compared to sandy soils. Other authors such as Zavala-Cruz et al. (2005), Guzmán-Osorio and Adams (2015) and Yzquierdo-Ruíz et al. (2022) found that, despite having a high content of sodium salts and hydrocarbons, clay soils have greater primary production of grasses compared to sandy soils.
A poorly addressed problem is wastewater spills from oil production or congenital waters, which cause an increase in salinity (Ma and Tashpolat, 2023). Recently, the high demand for crude oil has caused an increase in the generation of congenital waters and, in parallel, spills of this waste (Amakiri, Ogolo, Angelis, and Albert, 2023). In Mexico, congenital waters have caused the salinization of agricultural soils (Hernández-Salazar, Moreno, and Sandoval, 2018; Gómez-Mellado, Morales, Garza, Torres, and Sánchez, 2020).Soil salinization reduces the production of vegetables, mainly those that are not tolerant to these changes (Zhao, Zhang, Song, Zhu, and Shabala, 2020; Pessarakli, 2021). Salinity causes osmotic stress and low nutrient uptake, resulting in reduced plant development or death (Machado and Serralheiro, 2017; Lu et al., 2023; Ma and Tashpolat, 2023; Amakiri et al., 2023).
Some alternatives to restore soils affected by salinity consist of washing with drinking water and introducing tolerant plantations (Liang, Ma, Wan, and Liu, 2018; Hernández, 2019; El Sabagh et al., 2020; Abdel Latef, Omer, Badawy, Osman, and Ragaey, 2021). However, some studies mention that areas restored using these techniques must be constantly irrigated (Martel-Valles, Benavides, Valdez, Juárez, and Ruiz, 2013; Yan, Marschner, Cao, Zuo, and Qin, 2015; Abdel Latef et al., 2021; Gawryluk, Stępniowska, and Lipińska, 2022). Another alternative is the incorporation of components that reduce the availability of sodium and increase the biological activity of the soil so that the plants have available nutrients (Naz et al., 2021; Yasir et al., 2021; Singhal et al., 2021).
Remediation methods in which assisted washings have been carried out with chemical or biological materials have proven to be one of the most effective alternatives, but the applicability in different types of soils has not been evaluated (Liang et al., 2018; Gómez-Mellado et al., 2020). For example, the cation exchange technique with calcium (Ca) precursors and the addition of organic material have managed to recover the vocation for land use (Degioanni, Cisneros, Cantero, Plevich, and Cantero, 2020; Zhu et al., 2020). However, the amendments have not been optimized, consequently, the pH increases to alkaline levels (Abbaslou, Hadifard, and Ghanizadeh, 2020; Jalali, Arian, and Ranjbar, 2020).
For example, Morales-Bautista, Domínguez, and Adams (2011) carried out evaluations with hydrated lime (commercial CaO) in clay soil experimentally contaminated with congenital waters and compared their results with other Calcium precursors such as Ca (NO3)2 and CaSO4; In their results, they observed that CaO has some advantages over other precursors. However, the CaO modifications contributed to the reduction of Electrical Conductivity (EC) and the Percentage of Exchangeable Sodium (PSI), as well as soil compaction.
In the last decade, contaminated sites have been identified in Mexico, mainly with drilling waste, congenital waters, and old oil spills; One of the biggest challenges is determining the viability of the various technologies in these areas, which have different types of soils (Méndez-Moreno et al., 2021; Yzquierdo-Ruíz et al., 2022). For these reasons, the present study aimed to determine if there are differences in the response of each soil (four) to experimental contamination with oil production waters and the application of CaO. The response variables were changes in EC (salinity) and soil properties according to treatment time.
Material and Methods
The analysis consisted of evaluating the treatment period and its relationship with the reduction of Electrical Conductivity (EC) according to the soil type. In addition, a comparison of the contaminated soils properties, and their changes after remediation were evaluated.
A directed sampling was carried from geological strata of four sites near oil facilities in the state of Tabasco, Mexico: ST1 in Cunduacán (17° 59’ 53.1” N, 93° 05’ 45.2” W), ST2 in Macuspana (18° 25’ 55.0” N, 93° 16’ 43.2” W), ST3 in Paraíso (17° 51’ 13.7” N, 92° 29’ 11.5” W) and ST4 in Cárdenas (18° 01’ 01.3” N, 93° 39’ 21.1” W). At each site, an excavation of approximately 1 m3 was made (the depth was defined by the phreatic level, which was found between 1 m and 1.40 m, approximately). Subsequently, each soil was homogenized and a composite sample of approximately 30 kg of each was prepared (wet base). Rocks and roots were removed from each sample, and they were dried in an electric furnace (60 °C) (Méndez-Villegas, Gómez, and Ledesma, 2014; Palma-López et al., 2017).
Finally, the samples were stored in plastic bags, deposited in a cooler with ice (4 °C), and transferred to the Laboratorio de Suelos e Hidrocarburos of the UJAT to perform analyses and treatments. These samples represented the control soils. In addition, oil production water was sampled (congenital water discharge line at 17° 47’ 31.8” N, 92° 41’ 13.3” W) and they were determined: DBO (Biological Oxygen Demand, test method according to NMX-AA-028-SCFI-2001 (NMX-AA-012-SCFI-2001, 2001), fecal coliforms (methods specified in NMX-AA-042-SCFI-2015 (NMX-AA-042-SCFI-2015, 2015); additionally, it was determined total solids (STT), total dissolved solids (TDS), settleable solids (SD), Suspended solids (SS), EC, HTP (Total Petroleum Hydrocarbons), colour, pH, total chlorides and, CaCO3 according to the methods specified by the NOM-143-SEMARNAT-2003 (SEMARNAT, 2003).
All sampled soils were experimentally contaminated. Plastic containers, with 5 kg of a sample of each soil (4 soils, in triplicate, adding a total of 12 experimental units). Then, 2.5 L of congenital water was added to each soil container, and each sample was homogenized (5 min) and allowed to sit for one day (Morales-Bautista et al., 2011). After this time, the samples were mixed again and 0.5 kg of sample was taken from each container. These are composed of the contaminated samples (SC): SC1 (Cunduacán), SC2 (Macuspana), SC3 (Paraíso), and SC4 (Cárdenas).
The sodium content in the SCs was determined indirectly using a relationship curve between CE and NaCl (Baker brand reagent grade) was implemented at different molar concentrations (Figure 1) considering that chlorides are between 40-80 mg L-1 for soils in the study area (Palma-López et al., 2017; Gómez-Mellado et al., 2020). After the lie up period, the contaminated soils were homogenized and a sample of 50 g of each site was selected. EC was measured in both the witness soils (CET) and the contaminated soils (CEC). The method used in this process was AS-18, specified in NOM-021-SEMARNAT-2000 (NOM-021-SEMARNAT-2000, 2003).
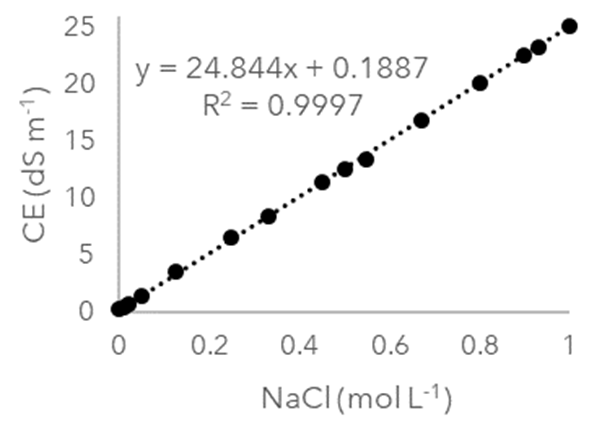
With the values obtained from CET and CEC, the difference between these values was calculated for each soil (CED) (Table 1), these were substituted in the equation shown in Figure 1, where y = CED and X = NaCl. Thus, the NaCl value in each soil was as follows: SC1 = 0.549; SC2 = 10.290; SC3 = 0.041, and SC4 = 0.153 (in mol L-1, respectively). Besides, Morales-Bautista et al. (2011) specify that, in the cation exchange treatment, for the removal of 2 mol of NaCl, 1 mol of CaO is required, therefore, with the NaCl values found for each soil, the amount of Ca to be added was calculated, leaving CaO solutions (Baker brand reagent grade) for SC1 = 0.275, SC2 = 0.145, SC3= 0.020 and SC4 = 0.077 (mol L-1, respectively).
Table 1: Properties of water from oil production.
| Parameter | Values | Parameter | Values |
|---|---|---|---|
| STT | 95 g L-1 | Colour | 55 UPt Co-1 |
| TDS | 95% | pH | 6 |
| SD | 3 % | Total Chlorides | 21 mg L-1 |
| SS | 2 % | DBO | 11 mg L-1 |
| EC | 140.1 dS m-1 | Faecal Coliforms | 900 NMP |
| HTP | 14 mg L-1 | CaCO3 | 405 mg L-1 |
STT = total Solids; TDS = total dissolved solids; SD = settleable solids; SS = suspended solids; EC = electric conductivity; HTP = total petroleum hydrocarbons; DBO = biological oxygen demand.
The treatment consisted of preparing 2.5 L of each solution, which were added to the corresponding soils. Afterward, the soils were manually mixed for 5 min and left to settle for 3 h, later were washed five times with drinking water (EC = 0.1 dS m-1) every hour (homogenization/drained 1 h, 5 L for each washing) and let was left to lay for 24 h. Subsequently, each treated soil was homogenized and 0.1 kg of sample was selected, to which CE was determined, a total of 7 treatments, were carried out, which were named as treated soils (Gómez-Mellado et al., 2020). These specimens were named T0, T1, T2, T3, T4, T5, T6 and T7. Where the numbers indicate the number of days (d) under treatment and T0 is SC.
Finally, the parameters of pH, Porosity (%Po), Apparent Density (AD), Real Density (RD), Texture Class, and Field Capacity were determined for the uncontaminated, contaminated, and treated soil samples, using the aforementioned methods by the NOM-021-SEMARNAT-2000 (NOM-021-SEMARNAT-2000, 2003). In addition, the results obtained were evaluated using a Shapiro-Wilk normality test (α = 0.05) and ANOVA-Tukey in the R project program (α = 0.05 and significant difference or HSD, respectively for each test) (Luke, 2017).
Results and Discussion
The comprehensive management of oil production water includes its reuse and final disposal. Parameters are controlled by normative limits. In this context, the analyzed congenital water sample has values below the LMP such as Total Petroleum Hydrocarbons or HTP (Table 1), which is below 15 mg L-1. Studies that evaluated acute toxicity did not observe negative effects at an HTP concentration of ˂ 15 mg L-1 (Madhav et al., 2020; Smith et al., 2021; Shen et al., 2022). In contrast, TDS have values above the permissible limit by the Mexican standard NOM-143-SEMARNAT-2003, since STT in the sample of congenital waters, has a value of 90.25 g L-1 and the norm estimates values below 0.5 g L-1 for discharges in fresh water and 32 g L-1 in coastal waters (SEMARNAT, 2003). Some reports such as Gómez-Mellado et al. (2020) observed that the solids presented in congenital water are mostly sodium precursor salts, which can be related to the TDS and EC values found in the sample de congenital waters.
In this sense, the EC values in controlled, contaminated, and treated soils (Table 2) have a normal distribution (SWc ˃ SWt = 0.803) and the values of the means of T1, T2 and T3 of the Macuspana soil, as well as T2 and T3 soil from Paraíso, did not have significant differences (x1-x2 ˃ HSD), and it was observed that CE in ST ˂ SC. Also, it is documented that the increase in EC or PSI in soils could promote the mortality or displacement of vital organisms for soil biogeochemical processes, such as earthworms and insects (Almansa-Manrique et al., 2018; Hernández-Salazar et al., 2018). These effects have been reported for the study areas by Zavala-Cruz et al. (2005) and Pérez-Hernández et al. (2017). The reduction of the EC in treated soils establishes that the addition of CaO in water can be a treatment alternative for the areas affected by congenital water spills (Morales-Bautista et al., 2011).
Table 2: EC of soils (saturation extract in dS·m-1).
| Cunduacán | Cárdenas | Macuspana | Paraíso | |
|---|---|---|---|---|
| ST | 0.13±0.01 | 0.60±0.01 | 0.51±0.01 | 3.00±0.06 |
| SC | 14.00±0.28 | 4.60±0.09 | 7.92±0.16 | 4.20±0.08 |
| SC/ST ratio | 107.69 | 7.66 | 15.53 | 1.40 |
| T1 | 12.89±0.26 | 2.68±0.05 | 7.59±0.11* | 2.14±0.04 |
| T2 | 11.14±0.23 | 1.68±0.03 | 7.36±0.13* | 1.77±0.04* |
| T3 | 10.20±0.20 | 0.99±0.02 | 7.21±0.14* | 1.71±0.02* |
| T4 | 7.32±0.15 | 0.69±0.02 | 6.13±0.11 | 0.99±0.01 |
| T5 | 5.04±0.10 | 0.48±0.01 | 4.88±0.07 | 0.85±0.01 |
| T6 | 2.17±0.04 | 0.35±0.01 | 3.32±0.06 | 0.71±0.02 |
| T7 | 1.10±0.03 | 0.21±0.01 | 2.99±0.04 | 0.52±0.01 |
| SWc | 0.813 | 0.827 | 0.852 | 0.815 |
| p-value | ˂ 0.05 | |||
| HSD | 0.468 | 0.101 | 0.281 | 0.279 |
EC = ele.ctric conductivity; ST, and SC (T0) = control and contaminated soils; SWc = calculated correlation coefficient; SWt = minimum correlation for α = 0.05. T1, T2, T3, T4, T5, T6 and T7; the soils treated from 1 to 7 days; SWt = 0.803. * indicates that there are no significant differences between the samples (x 1 -x 2 ˂ HSD).
However, when calculating the ratio of the EC of contaminated soils and controls (SC/ST, which indicates that if it ˃1 there is an increase and is dimensionless) of each site, it was observed that these are different. Consequently, Cunduacán sample has the greatest increase, since SC/ST = 107.69; in contrast, Paraíso has minor values to the rest of the soils, with SC/ST = 1.40, likewise, the soils from Cárdenas and Macuspana have a SC/ST of 7.66 and 15.53, respectively. Otherwise, the differences between SC/ST may be related to the incorporation of the contaminant into the clay structure, which causes the formation of agglomerates that, as they gain mass, can be interpreted as sand (Bouyoucos method) (Gómez-Mellado et al., 2020; Álvarez-Coronel et al., 2020).
For these reasons, when comparing the values of %Ac (Clay) and %L Silt, with respect to those of %Ar (Sand), it is observed that the particles with greater porosity (%Ac+%L) are reduced and those without contain an increase in porosity (Figure 2).
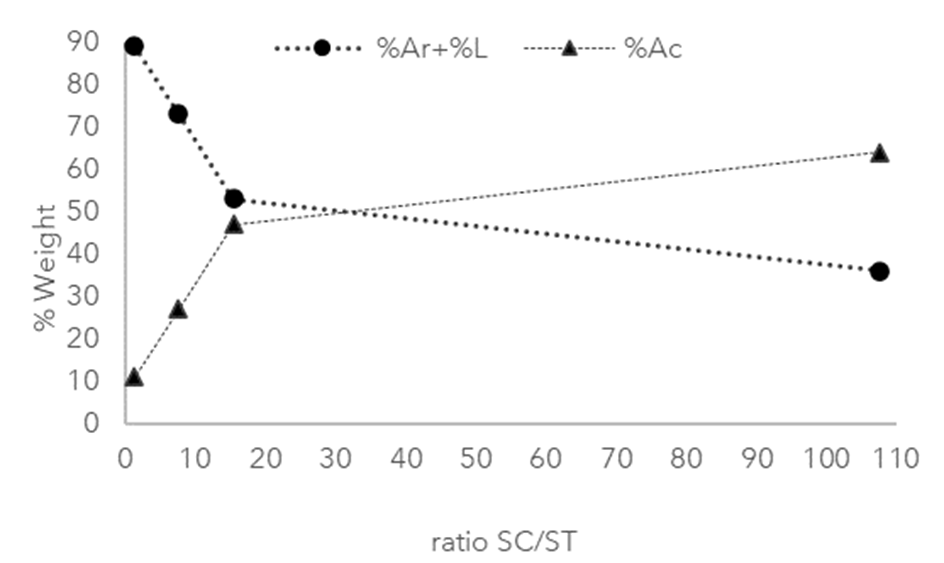
This behavior was reported by Adams and Guzmán-Osorio (2008) and Domínguez-Rodríguez et al. (2020) for soils contaminated with hydrocarbons and oil production water, in which sand increased and clay decreased, however, they did not find a direct relationship with %L. In this sense, in Figure 2, it is observed that %L+%Ac decrease with respect to % Ar, which can be related to a greater distribution of the components over the porous particles and allows the aggregates to gradually increase their weight depending mainly on soil porosity and texture (Abbaslou et al., 2020; Wang, He, Zhao, Wang, and Ma, 2022).
In this context, Palma-López et al. (2017) mention that the clays present in Macuspana are clays non-expandable and those of Cunduacán are expandable. Some studies mention that the pore clogging derived from the dispersion of clays which is higher in the order of 1:1 compared to 1:2. This behavior contributes to the reduction of the macroporosity and permeability of the soil, where the 1:1 clay is the most affected (Martínez, 2001; Chan-Quijano et al., 2015); according to this, T1, T2, and T3 of the Macuspana soil do not have significant differences since the desorption of Na is slower as the porosity and permeability of this soil is reduced. However, although the restoration with calcium can favor the agglutination of primary particles that contribute to the formation of larger aggregates, it is not known if the diameter of the treated solid increases due to the used method to determine the textural classes, which consists of a comparison between the differences in the water-particle density and not in the aggregate size (Guzmán-Osorio and Adams, 2015).
To calculate the treatment days for each soil, regressions of the normalized values of EC in treated soils (CET) and EC of contaminated soils (CEC) were applied and the equations were obtained to determine the treatment period by cation exchange, in all cases, the regression that had the best R2 result was selected (Figure 3).
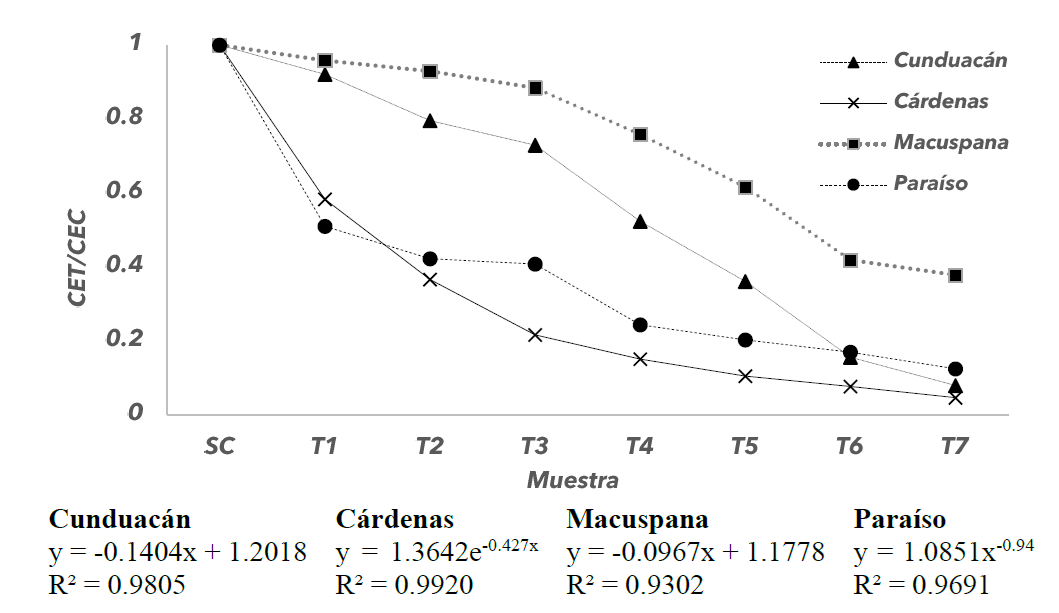
The decreasing trends presented in (Figure 3) demonstrate that CaO reduces EC in soils, but the kinetic equations are of a different order. Adams and Guzmán-Osorio (2008) and Chan-Quijano et al. (2015) demonstrated that removal rates in soil treatment systems depend on general factors: temperature, agitation, pH, humidity, and the chemical or biological precursor used in the treatment. However, other authors such as Morales-Bautista et al. (2011) and Álvarez-Coronel et al. (2020) add that the adsorption-desorption phenomena and the chemical compatibility between treating agent and contaminant are directly related to the textural properties of the treated solid.
An example of this phenomenon is the reports by Sastre-Conde, Lobo, Beltrán, and Poggi (2015) and Rahman, Clark, Yee, and Burton (2019). who observed that the proportion of clay-silt-sand influences the treatment time and the amount of contaminant removed. These studies could explain why removal rates and speeds are different between each type of soil. In these terms, Zavala-Cruz et al. (2005) and Gómez-Mellado et al. (2020) observed that the higher the amount of clay, the soils tend to retain contaminants, which could explain why the removals in Macuspana and Cunduacán soils are slower for clays (˃ 40% of Ac), concerning soils from Paraíso and Cárdenas (˂ 30% of Ac), (Table 3).
Table 3: Physical and chemical parameters of contaminated and treated control soils.
| Sample | pH | Texture | CC | Po | |||
|---|---|---|---|---|---|---|---|
| Ar | Ac | L | |||||
| - - - - - - - - - - - - - - % - - - - - - - - - - - - - - | |||||||
| Cunduacán (expandable clays) | T | 7±0.14 | 14±0.10 | 64±0.11 | 22±0.14 | 40±0.80 | 58±1.10 |
| C | 6.7±0.11 | 73±0.11 | 25±0.10 | 2±0.14 | 23±0.40 | 52±0.50 | |
| TR | 9.1±0.13 | 80±0.10 | 10±0.08 | 1±0.01 | 30±0.70 | 48±1.00 | |
| SWc | 0.910 | 0.891 | 0.831 | 0.840 | 0.901 | 0.912 | |
| p | ˂0.05 | ||||||
| HSD | 0.290 | 0.228 | 0.229 | 0.225 | 1495 | 1713 | |
| Cárdenas (expandable clays) | T | 7.21±0.13 | 30±0.09 | 27±0.07 | 43±0.10 | 34±0.7 | 26±0.30 |
| C | 5.30±0.10 | 51±0.20 | 10±0.11 | 30±0.12 | 22±0.4 | 23±0.11 | |
| TR | 9.40±0.11 | 70±0.13 | 5±0.13 | 25±0.11 | 25±0.5 | 28±0.31 | |
| SWc | 0.909 | 0.991 | 0.922 | 0.932 | 0.911 | 0.933 | |
| p | ˂ 0.05 | ||||||
| HSD | 0.260 | 0.230 | 0.219 | 0.241 | 1282 | 1631 | |
| Macuspana (non-expandable clays) | T | 6.42±0.12 | 48±0.21 | 47±0.10 | 5±0.01 | 13.42±0.30 | 17±0.01 |
| C | 4.61±0.13 | 67±0.30 | 30±0.09 | 3±0.01 | 34.60±0.10 | 11±0.02 | |
| TR | 7.76±0.11 | 81±0.12 | 19±0.12 | 0±0.00 | 22.27±0.50 | 21±0.01 | |
| SWc | 0.840 | 0.911 | 0.921 | 0.930 | 0.850 | 0.872 | |
| p | ˂ 0.05 | ||||||
| HSD | 0.274 | 0.241 | 0.230 | 0.245 | 1212 | 1522 | |
| Paraiso (expandable clays) | T | 6.83±0.12 | 89±0.11 | 11±0.02 | 0±0.00 | 7.78±0.20 | 31±0.62 |
| C | 5.80±0.11 | 95±0.10 | 5±0.01 | 0±0.00 | 16.3±0.30 | 29±0.40 | |
| TR | 9.01±0.18 | 100±0.10 | 0±0.00 | 0±0.00 | 10.71±0.20 | 4±0.01 | |
| SWc | 0.890 | 0.901 | 0.850 | 0.910 | 0.870 | 0.932 | |
| p | ˂ 0.05 | ||||||
| HSD | 0.281 | 0.220 | 0.232 | 0.243 | 1310 | 1437 | |
%Po = is porosity; %CC = field capacity; T, C, TR = area control; Contaminated and Treated soils (7 days), respectively. %Ar = sand; %Ac = clay; %L = silt; SWc = calculated correlation coefficient; SWt = minimum correlation for α = 0.05S; SWt = 828. * expresses that there are no significant differences between the samples (x 1 -x 2 ˃ HSD).
The removal rates of EC in each soil were evaluated through the half-life (t½). For this, it was considered that CET/CEC = 0.5 which is substituted in "y" of the equations expressed in Figure 3 (Morales-Bautista et al., 2011). The results are Cunduacán t½= 4.998 days, Cárdenas t½= 2.350 days, Macuspana t½= 7.009, days Paraíso t½= 1.373 days. Even though Cunduacán has a higher % Clay, Macuspana t½ is higher than Cunduacán. This behavior was reported by Álvarez-Coronel et al. (2020) who explain the type of clay also participates in the retention of contaminants. Additionally, Torri, Amaturo, Sánchez, and Pacheco (2021) mention that the quartz present in sandy soils has less surface area and exchangeable cations, compared to the zeolite and montmorillonite present in clayey soils, so the retention of the contaminant may be lower in the former than in the latter.
On the one hand, the values obtained for the properties of the non-contaminated, contaminated, and treated soils have a normal distribution, since SWc ˃ SWt (Table 3). All samples have significant differences among themselves (x1-x2 ˃ HSD), these results indicate that all the soil properties analyzed are affected by contamination and that despite soil restoration and salinity reductions, the rest of the properties are altered, which coincides with Domínguez-Rodríguez et al. (2020) and Mendez-Moreno et al. (2021) who mention that, although soil remediation technologies reduce the contaminant concentration, the final conditions are not similar to those that existed before contamination, due the loss of the edaphological and fertility properties. When the soil is contaminated, the soil pH is reduced in all samples, which is related to the salts of the congenital water.
In addition, when remediating the soils, the pH increases in all the samples, which is related to the addition of Ca. Some studies indicate that by increasing components of greater specific weight to soil, the apparent density (DA) increases (Guzmán-Osorio and Adams, 2015); in the case of CaO, it tends to form agglomerates that can reduce the clay content and increase the amount of sand, likewise, the increase in Calcium in the soil contributes to having mostly alkaline soils (Morales-Bautista et al., 2011). These works can explain the increase in the content of particles with higher specific weight (which can be interpreted as the sand by the Bouyoucos method) in all soils and the reduction in the percentage of clays, as well as the increase in pH, the soils already have an alkaline pH after being treated and this parameter is acidic or neutral in uncontaminated soils and controls.
Also, soils with lower clay content tend to increase pH values more easily when treated with CaO, so sandy soils would have greater changes in texture and pH when the cation exchange treatment with Ca is applied (Figure 4a). Other authors have observed this behavior with heavy metals, which can displace lower valence cations such as K and Mg, and to a lesser extent Fe and Al (Abbaslou et al., 2020). This explains why acid soils change to strongly alkaline and strongly acid to alkaline. It is important to mention that parallel to the pH changes, the availability of nutrients also changes (Rivera, Sánchez, and Domínguez, 2018), so it is necessary to establish additional measures for the complete restoration of the soil, which guarantees not only agricultural production but also not in parallel with their natural conditions (González et al., 2019).
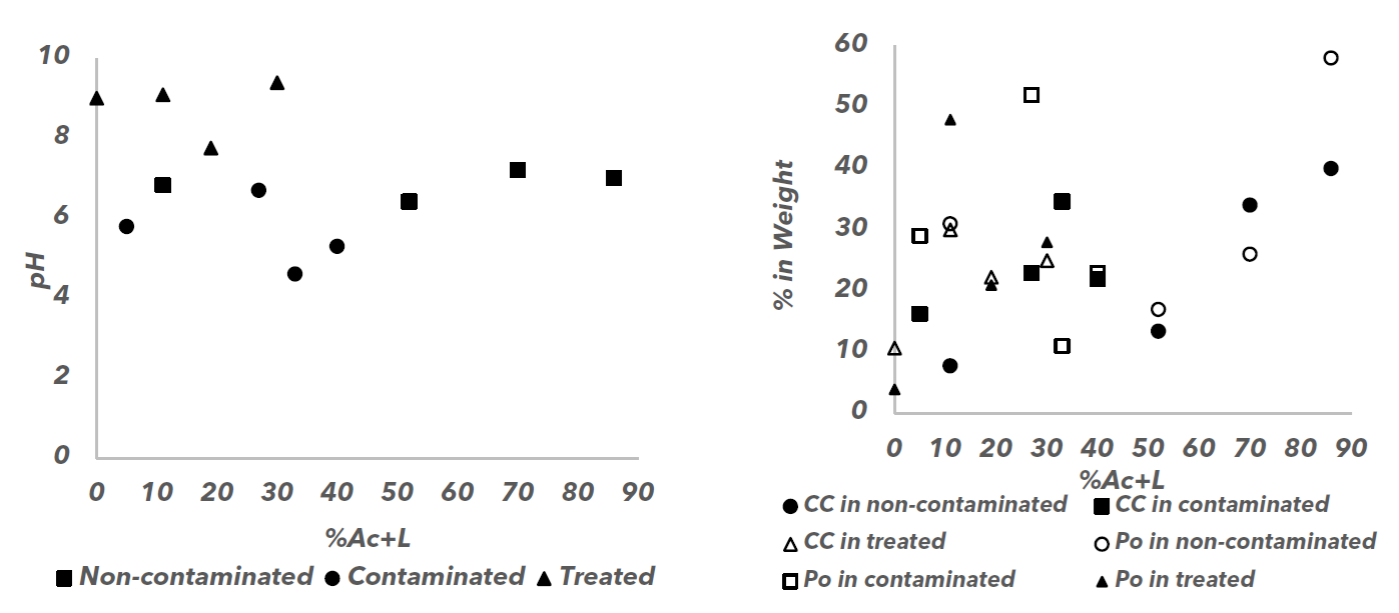
Figure 4: Changes in texture and effects on pH (a), as well as %Po and %CC in control, contaminated and treated soils.
In contrast, it was observed that soils with a certain %Ac content increased %Po and %CC (Figure 4b). However, when comparing the samples from Cunduacán and Cárdenas to those from Macuspana, it is observed that soils containing expandable clays increase %Po and %CC with respect to those containing non-expandable clays. Some studies estimate the reduction of %P and %CC is related to problems of compaction and reduction of water capacity and that this problem can be alleviated with the addition of organic and clay material (Landini et al., 2007). It is important to note that %CC and %Po are important parameters for the survival of plants (Sastre-Conde et al., 2015), so although CaO allows reducing the amount of Na, the treatment contributes to the reduction of these properties in soils with sandier textures. Some reports such as those by Degioann et al. (2020) and Gómez-Mellado et al. (2020) mention that soils with low porosity and field capacity may be related to plant water stress and rooting problems. Therefore, the feasibility of using this treatment is lower in soils with a coarse texture compared to those with a finer texture.
Conclusions
It is concluded that water discharges from oil production cause an increase in EC in soils and a reduction in pH, but this depends on the type of soil, with soils with higher clay content being the most affected. Additionally, remediating soils with CaO reduces the EC, but each soil has different periods to reduce the EC to non-saline values; It was proposed that this behavior depends on the texture of the soil, in which sandy soils have better removal times compared to clay soils. However, this time could also depend on the type of soil, since it was observed that fine-textured soils (clayey and silty) require a longer treatment time compared to coarser-textured ones. It is important to mention that when comparing the properties of treated soils to uncontaminated soils, the initial properties are not recovered, such as pH, porosity, and field capacity, which are important for crops, so they must be considered in post-remediation work for the adaptation of the place or plant to be induced. The soils that show the most post-treatment changes are those with a sandy texture. Likewise, there are differences in the response of the contaminant and CaO in clay soils, which could be related to the type of clay present in them, since soils with expandable clays present fewer EC reduction problems concerning soils with not expandable clays.

