1. Introduction
A significant deterioration due to atmospheric corrosion of reinforced concrete structures built with metallic materials, more often used in the construction industry as carbon steel and galvanized steel, is observed in the tropical coastal climate in Havana City. It is a consequence of high (C4), very high (C5) and extreme (CX) corrosivity categories of the atmosphere at coastal locations without shielding conditions (Castañeda et al., 2013, 2014). High corrosivity categories of the atmosphere were expected due to high levels of chloride deposition rate (Cl - DR). However, penetration studies carried out in Cuba and some Latin-American countries about marine aerosol as a factor in the initiation and propagation of atmospheric corrosion have not been taken into account in previous research.
One example of this is the Ibero-American Map of Atmospheric Corrosion (MICAT), which was set up in 1988 with the sponsorship of the International Ibero-American program Science and Technology for Development (CYTED) and ended in 1994 after six years of activities. Fourteen countries were involved in this project: Argentina, Brazil, Chile, Colombia, Costa Rica, Cuba, Ecuador, Mexico, Panama, Peru, Portugal, Spain, Uruguay, and Venezuela (Morcillo et al., 2000). Research was conducted both at laboratories and in a network of 75 outdoor exposure sites throughout the Ibero-American region, thus considering a broad spectrum of climatological and pollution conditions. Results of the MICAT project were obtained for carbon steel, zinc, copper, and aluminum specimens exposed for one year in different rural, urban, and coastal atmospheres. However, studies concerning penetration of marine aerosol at different distances from the sea were not performed.
On the other hand, the influence of atmospheric environment on different types of concrete was the main study of the CYTED project DURACON, conducted throughout 11 Ibero-American countries (Argentina, Bolivia, Brazil, Chile, Colombia, Costa Rica, Mexico, Spain, Uruguay, Portugal and Venezuela). The initial results showed that under the influence of marine atmospheres, Cl - DR should be considered a decisive factor to asses the corrosion probability of steel reinforced concrete during the first years of study (Trocónis de Rincón, 2006, Trocónis de Rincón et al., 2007). Studies of marine aerosol penetration in different coastal sites located at short distances from the sea have not been carried out either.
A study based on the annual atmospheric corrosion rate for carbon steel was recently completed in Bogotá, Colombia (Ríos-Rojas et al., 2017). It was found that the west part of the city showed the greatest aggressiveness due to highest levels of dust and sulphur compounds deposition rates, related with the distribution of anthropogenic emissions across the city.
Few studies about penetration of marine aerosol based on changes of the chloride deposition rate (Cl - DR) vs. distance from the sea have been performed in the coastal areas of different countries. Research has been generally carried out in flat territories, not in cities (Mustafa and Yusof, 1994; Harkel, 1997; Petelski and Chomba, 2000; Cole et al., 2003a; Meira et al., 2006, 2008, 2010). In a coastal city like Havana, at short distances from the sea, building structures and tall, natural vegetation may cause a significant shielding effect. As it is well known, chloride deposition is the main aggressive agent in the initiation and propagation of atmospheric corrosion in reinforced concrete, carbon steel and galvanized steel building structures. Wet candle has been the device more frequently used to determine chloride deposition.
Studies of the chloride deposition rate in Cuba started in 1979 at different flat coastal sites. However, its behavior with respect to distance from the sea as an indicator of marine aerosol penetration in Cuban cities with shielding conditions has not been studied. The method used for Cl - DR evaluation was the dry plate (Corvo et al., 1995, 1997, 2008a, 2009).
Reports from the north coast of Sweden (Gustafsson and Franzén, 1996), as well as in a coastal area in the east of Brazil (Meira et al., 2007) and the shoreline of South Korea (Lee and Mon, 2006) proposed two statistical models to explain changes in the chloride deposition rate vs. distance from the sea. An exponential decreasing function:
and a bilogarithmic decreasing function:
where Cl - DR is the chloride deposition rate (mg m-2day-1), x is the distance from the sea (m), and a and b are the regression coefficients.
No previous reports have been found with respect to a comparison between bilogarithmic and exponential models applied to marine aerosol penetration and its distribution in a coastal city with shielding conditions. The statistical models were fitted using data corresponding to average chloride deposition at exposure times of six, 12 and 18 months, respectively. The chloride deposition effect vs. distance from the sea is not linear and weakens at distances farther from the sea; large particles are less numerous, due to the gravimetric effect. As a consequence, there is a strong tendency for sea salt concentrations to decrease with the distance from the sea. Salt measurements when aerosol is transported inland are also affected by land surface roughness.
Formation, transportation and deposition of marine aerosol strongly depend on wind speed. When wind speed increases, salt particles (including heavier ones) can reach longer distances from the sea in flat territories. Using the model C = ae bws , where C is the chloride concentration (µg m-3), WS is the annual average wind speed (m s-1), and α and b are the regression coefficients, a good fitness was obtained. A consensus to correlate chloride concentration and annual average wind speed was established by Taylor and Wu (1992), McKay et al. (1994), and Wai et al. (2004). Models in other coastal zones without shielding conditions were fitted. Cl - DR was determined instead of chloride concentration.
An equivalent model is Cl - DR = ae bws where Cl - DR is the chloride deposition rate (mg m-2 day-1). Good data fit was obtained with this equivalent model. No consensus was found about the necessary wind speed threshold to increase Cl - DR in coastal zones of flat territories (Gustafsson and Franzén, 2000; Meira et al., 2007; Morcillo et al., 2000; Strekalov, 2000).The influence of wind speed on the increase of chloride concentration or chloride deposition rate has been studied, in general, only at specific distances from the sea in flat and open sites, not at different distances from the sea in a city like Havana with shielding conditions.
Regarding other factors that influence the chloride depositions rate, Zezza and Macri (1995) proposed that salt particles become rapidly equilibrated with the environment in the marine aerosol when they are generated, and depending on temperature and relative humidity (RH) conditions, they can turn into saline solutions or salt crystals. If RH is higher than 70% (RH for sodium chloride deliquescence is 75%), aerosol particles are deposited as saline solution and not as crystals. RH may increase the corrosivity level of the atmosphere causing a more advanced deterioration of the structures due to atmospheric corrosion. The hygroscopicity of chloride salts increases particles size and promotes their deposition.
Cole et al. (2003b) illustrated that the influence of RH on salt concentration is particularly important within the range of 50-70% due to salt wetting. These authors also observed that the washout effect due to rainfall is more effective at higher RH levels. It is concluded that salinity wetting increases the size of salt particles, favoring a major deposition, and also that rainfall removes a great amount of salt aerosol.
Nevertheless, the influence of decreasing air temperature (due to the entry of cold fronts) on salt particles or chloride deposition rate has not been taken into account previously. The second edition of the ISO 9223:2012 (ISO, 2012a) standard establishes: “The airborne salinity, based on chloride deposition rate, is strongly dependent on the variables influencing the transport inland of sea-salt, such as wind direction, wind speed, local topography, distance of the exposure site from the sea”. This standard does not consider the influence of air temperature decrease in the penetration of marine aerosol. The main objective of the present paper is to determine the penetration of marine aerosol, evaluated by Cl - DR, taking into account shielding conditions (caused by building structures and tall, natural vegetation), as well as to determine factors influencing Cl - DR in a tropical coastal city (Havana).
2. Data and methodology
2.1. Climatology of Havana
Havana is a coastal city located in the west region of Cuba between 23.53º N and 82.35º W. It is the 15th province of Cuba by extension (of 16 provinces) with an area of 727.4 km2, representing 0.7% of the total Cuban territory. It occupies a coastal fringe on the north of approximately 20 km long. According to the data obtained from the Meteorological Center of Havana, seasonal variability has not been significant. Coefficient of variation (CV) of temperature (T), relative humidity (RH), and wind direction (WS) have been low during the last 27 years (between 1990 and 2016) (Table I).
Table I Average values of different climatic parameters in Havana City from 1990 to 2016.

Av: average value; SD: standard deviation; CV: coefficient of variation.
Therefore, according to the average values of these climatic parameters (Av), between 1990 and 2016 (n), climate in Havana City can be classified as tropical wet with two climatic seasons: a dry period (October-April) in winter and a wet period (May-September) in summer. Both seasons have approximately an equal duration and relatively few differences of temperature and relative humidity.
The predominant wind direction is between east-northeast and north-east, being the latter the most predominant from 1990 to 2016. A wind rose is presented in Figure 1 .
2.2. Outdoor exposure sites and experimental conditions
Seven outdoor exposure sites (S1, S2, S3, S4, S5, S6 and S7) at different distances from the sea were selected in a study zone of Havana City. Only site 1 was located in the open atmosphere in front of the sea, that is, without the shielding effect caused by building structures and tall, natural vegetation (Fig. 2).

Fig. 2 Map of the Cuban archipelago showing the location of Havana City (left); map of Havana City showing the seven outdoor exposure sites located at different distances from the sea (center); and the area where outdoor exposure site 1 was placed (right).
Outdoor exposure sites were selected without considering the NE direction, corresponding to the predominant wind direction. The selected area corresponds to relatively recent building structures. All sites are located in a straight line of almost 5 km in the N direction, starting from the coastline. Site 4 does not fit into the selected transect, but it was included in the evaluation because it represents the influence of Havana Bay, a location with high population and high commercial activity, very near to old Havana. Other points of the transect are located in the west side of the city. As the general objective of the paper is to characterize chloride penetration in Havana, the inclusion of a site on the east side of the city is considered adequate to obtain more information.
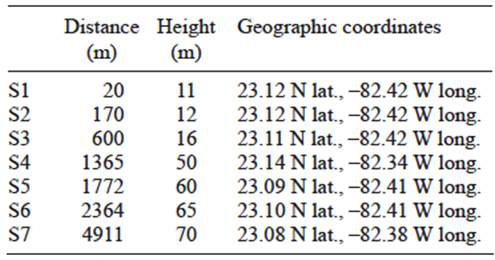
Distances from the sea with respect to the N direction from the outdoor exposure sites to the shoreline, altitude above sea level and geographic locations were determined using Google maps software (Table II). Although the outdoor exposure site 4 was about 10 km away from the transect of outdoor exposure sites 1 and 7, changes in geographic coordinates are noted. Outdoor exposure site 4 was included in the study as representative of old Havana (Table II).We considered that the inclusion of site 4 is valuable to obtain a more representative result of the city, although it is not strictly in the profile of chloride deposition.
Table II Distance from the sea, altitude above sea level and geographical coordinates for each selected outdoor exposure site.
A wooden rack with two dry plate devices was placed on each outdoor exposure site. The dry plate device is composed of an absorbent cloth oriented to the sea and used to determine the chloride deposition rate during the period of measurement (Fig. 3).
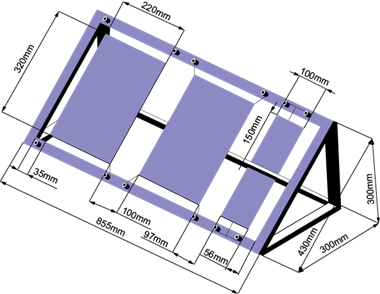
Fig. 3 Wooden rack with two dry plate devices fixed used for the determination of the chloride deposition rate. It should be noted that devices are positioned with a 45º tilt.
The devices (positioned with a 45º tilt) were oriented toward the predominant wind direction (northeast) in order to assure the impact of marine aerosol on the surface of the absorbent cloth located in each outdoor exposure site at different distances from the sea. Devices were located at a 3 m height above the ground under a shed with gabled roof and protected from the rain to avoid the washing effect. The measurement period span form October 2007 to September 2008. Cl - DR was determined monthly during the year of study.
2.3 Method to determine the chloride deposition rate
The chloride deposition rate (Cl - DR) was determined monthly based on the Cuban standard, which establishes the use of the dry plate method (Cuban Standard 12-01-09). The dry plate device consisted of a 320 × 220 mm piece of absorbent cloth placed at 45º to the horizontal and facing the predominant wind direction. Two pieces of cloth, perfectly cleaned and washed with distilled water for every site, were used (Fig. 3).The clothes were exposed monthly during the year of study. The chloride amount deposited on the clothes was determined by chemical analysis, which was carried out with the potentiometric method, using a silver electrode as ion selective electrode and a saturated calomel electrode as reference. A high impedance potentiometer (>108 Ω) was used for the measurements. A silver nitrate solution was used for titration.
After being retired, the clothes were kept in plastic bags until the chemical analysis was performed. Two measurements of the chloride deposition rate (mg m-2 d-1) were performed in each of the outdoor exposure sites for every month of exposure (within the period October 2007-September 2008): one for the device 1 (Cl - DR 1 ) and the other for the device 2 (Cl - DR 2 ), for a total of 24 records of the chloride deposition rate throughout the year. The principle of this method is the same as described on ISO 9225:2012 (ISO, 2012b). Monthly and annual average values of Cl - DR were plotted with respect to the distance from the sea. Two statistical models were used to explain changes in chloride deposition rate vs. distance from the sea: an exponential decreasing function (Cl - DR = ae (-b)x ) and a bilogarithmic decreasing function (Cl - DR = ax -b ). Both were fitted monthly and annually.
2.4 Relative humidity, air temperature and wind speed determination
Relative humidity (RH), air temperature (T) and wind speed (WS) data were obtained from the main meteorological station of the Meteorological Center of Havana, selected as outdoor exposure site number 4 in the present research (Fig. 2). Monthly average values of RH, T and WS for the year of period of interest (October 2007 to September 2008) were plotted. Annual average values of RH, T and WS reported for the period 1990-2016 were taken into account. A multivariate regression (Cl - DR = a ± bRH ± cT ± dWS) to show the influence of monthly average values of RH, T and WS over Cl - DR in each outdoor exposure site was fitted. The monthly average value of Cl - DR for each outdoor exposure site located at different distances from the sea with respect to monthly average values of wind speed was plotted. An exponential increasing function (Cl - DR = ae bws ) to obtain the monthly average values of WS from which Cl - DR increased was also fitted. The processed wind speed data corresponded to the east-northeast direction, that is, to wind speed coming from the sea. Speed data for wind coming from the south and east-southeast directions were not taken into account. Figure 4 shows a wind rose for the year of study.
3. Results and discussion
3.1 Chloride deposition rate vs. distance from the sea
Significant differences in monthly Cl - DR depending on the climatic season were found. Monthly Cl - DR data was divided into two sets according to the two main climatic seasons in Cuba, a dry period (October-April) in winter and a wet period (May-September) in summer (Fig. 5a, b, c, d).
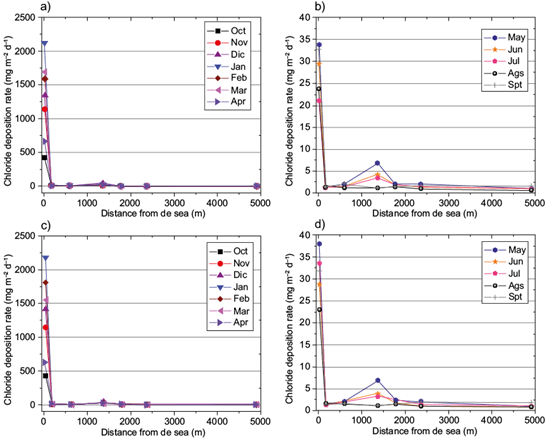
Fig. 5 Chloride deposition rate determined at different distances from the sea during the dry period (October-April) (a and c) and the wet period (May-September) (b and d).
It is important to note that monthly Cl - DR data remained almost constant in outdoor exposure sites 2 to 7 during the dry period (Fig. 5a, c). The influence of building structures as artificial shielding and tall, natural vegetation as natural shielding, constitute an obstacle for wind speed at these six outdoor exposure sites. Small changes for the summer period (Fig. 5b, d) are observed particularly in the outdoor exposure site number 4 located about 1365 m from the sea. As can be seen in Figure 2, this site is located close to the entrance of Havana Bay. There is not only influence of the open sea at this geographical location, but also of the bay itself. Relatively small buildings surround this site. This condition explains why higher changes in Cl - DR are reported for this site.
As expected, higher Cl - DR were recorder at outdoor exposure site 1 located 20 m from the sea without shielding conditions. There are no obstacles to the wind speed at this outdoor exposure site. Higher values of Cl - DR were reported during the dry period (October-April) in winter, that is, the months having lower monthly average values of temperature (Fig. 5a, c).
Data from the Meteorological Center of Havana showed the arrival of 17 cold fronts during the period of this study, which penetrated over the coastal fringe north of Havana City (Table III). Despite the fact that these cold fronts did not attain a strong intensity category, very high values of monthly Cl - DR were determined during the dry period (October-April) in winter in the outdoor exposure site 1 (Fig. 5a, c). Higher values of Cl - DR were obtained precisely in the period showing a higher number of cold fronts (January-March) with moderate intensity. Thus, monthly Cl - DR depends on the cold fronts behavior in areas of Havana without shielding effect. Significant deterioration due to atmospheric corrosion of reinforced concrete structures built with metallic materials such as carbon and galvanized steel (which are more often used in the construction industry) is observed in these areas of Havana.
Table III Cold fronts reported to penetrate over the coastal fringe north of Havana City during the dry testing period (October-April) in winter.
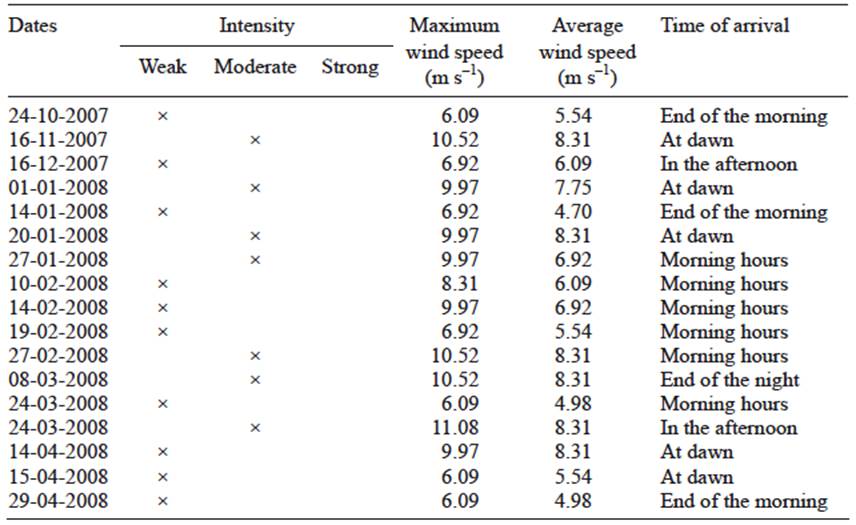
The north coastal fringe of Havana is characterized by intense waves, especially in the surf break zone during the dry period (October-April) in winter. There was no influence of tropical cyclones that significantly increased monthly Cl - DR in the year of study during the summer wet period (May-September) due to high wind speed influence. However, the cyclonic season in Cuba begins on June 1 and ends on November 30.
Monthly Cl - DR at outdoor exposure site 1 (S1-20 m) is determined in the open atmosphere, due to the absence of a shielding effect. Monthly Cl - DR in the city is lower in the rest of the selected sites. Marine aerosol distribution was calculated as the ratio, in percentage, between monthly Cl - DR in outdoor exposure site 1 with respect to the sum of chloride deposition rate on the seven outdoor exposure sites for the same month, according to the following expression:
Monthly Cl - DR (S1-20 m)/monthly Cl - DR (S1-20 m + S2-170 m + S3-S600 m + S4-1365 m + S5-1772 m + S6-2364 m + S7-4911 m) × 100 % = per cent of monthly Cl - DR deposited in the open atmosphere with respect to other outdoor exposure sites inside the city.
It is important to note that in the dry period (October-April), more than 90% of the chloride salts are deposited in the outdoor exposure site 1 without shielding condition (Table IV).
Table IV Percentage of salts deposited in the outdoor exposure site located 20 m from the sea with respect to the sum of chloride deposition rate on the seven outdoor exposure sites.

In the wet period (May-September), a decrease in monthly chloride deposition rate can be seen. Salt particles have smaller weight and size in the absence of cold fronts. These particles can travel longer distances from the sea. This behavior can prove the existence of a greater variation of monthly Cl - DR in the wet period (May-September).
This result is another indicator of the high impact of coastal tropical climate in Havana City, which affects the reinforced concrete and metallic structures located at short distances from the sea without shielding conditions.
A linear relationship between annual average values of Cl - DR data determined with the dry plate method ([Cl - DR] D.P ) and annual values determined with the wet candle method ([Cl - DR] W.C ) is established in ISO 9225:2012 (ISO, 2012b):
Annual average values of Cl - DR data for every dry plate device exposed 20 m from the shoreline were 760.05 and 778.81 mg m-2 d-1, respectively. Converting these values to wet candle data, an estimate of 1824.12 and 1869.14 mg m-2 d-1 for a total average of 1846.63 mg m-2 d-1 is obtained for every dry plate device. The annual average value of Cl - DR is over the range of 300 < S3 ≤ 1500, which is the limit established by the ISO 9225:2012 standard (ISO, 2012b).
Annual average values of Cl - DR higher than the criteria established by ISO 9225:2012 (ISO, 2012b) have only been reported at three outdoor exposure sites located in cities with coastal tropical climates (all around the world) without shielding condition (Table V).
Therefore, the northern coastline of Havana City can be considered one of the areas having higher atmospheric corrosivity categories around the world due to the direct influence of marine aerosol penetration from Cl - DR.
A significant high variability of chloride deposition rate is confirmed in the outdoor exposure site S1 (Fig. 6).
The chloride deposition rate in outdoor exposure sites different from S1 remained almost invariable during the year of study, including the outdoor exposure site S4, despite the fact that it was not placed in the selected transect.
A higher variability of chloride deposition rate in the outdoor exposure site S1 is due to non-shielding conditions, as well as major influence of relative humidity, air temperature and wind speed. Significant increase in deterioration is observed in site S1, coinciding with high variability and direct influence of the sea.
3.2 Changes in annual average chloride deposition rate depending on distance from the sea
The statistical model corresponding to an exponential decreasing function for annual average values of Cl - DR data (Fig.7a) provides a better fit compared with the statistical model corresponding to a bilogarithmic decreasing function (Fig. 7b).
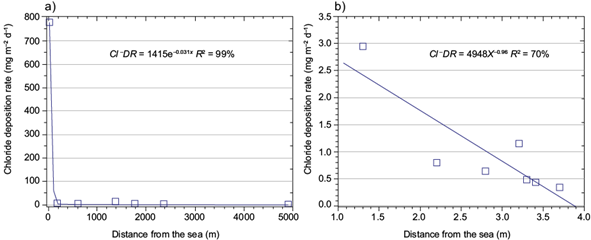
Fig. 7 Data fit for the two statistical models proposed to represent the coerelation between average annual chloride depositions and distance from the sea. (a) Cl - DR = ae (-b)x ; (b) Cl - DR = a x-b .
A considerable decrease in annual average Cl - DR with the increase of distance from the sea is observed at a short distance from the ocean. Difference in chloride deposition rate between outdoor exposure sites S1-20 m and S2, the last one located 170 m from the sea (Fig. 7a) is observed. It can be explained under the assumption that deposition of heavier and higher saline particles coming from the ocean and wave breaking area reaches only a distance lower than 170 m from the sea due to shielding conditions in Havana City.
Big chloride nuclei formed in the ocean and in the wave breaking zone reach up to a given distance from the sea. Afterwards, annual average values of Cl - DR continuously decrease. The area located less than 170 m from the sea can be considered as pure coastal atmosphere. Beyond this point, only small chloride aerosol particles coming from the ocean continue penetrating inland. A statistical model based on an exponential decreasing function is recommended to explain this behavior.
The distance from the sea in which the annual average Cl - DR decrease stabilizes can be estimated from coefficient b corresponding to a statistical model based on an exponential decreasing function, that is, the distance from the sea where the atmosphere can be defined as coastal. This feature has not been reported previously.
According to the mathematical properties of the statistical models corresponding to an exponential decreasing function, it is possible to define the parameter t (t = 1/ b ) considered as the distance from the sea where the annual average Cl - DR decrease stabilizes. The statistical model is transformed into Cl - DR = ae -x/t . Based on this assumption, the estimated distance is about 32 m, which can be used to establish two corrosivity categories of the atmosphere for reinforced concrete structures built with the most common metallic materials used in the construction industry, such as carbon and galvanized steel. At distances longer than 32 m, deposited aerosol particles are originated in the ocean and should have smaller size and weight. After this distance, the level of atmospheric corrosivity falls into a different category. Reports corresponding to flat territories and open coastal atmospheres in Cuba (Corvo, 2008a, 2008b) and Spain (Morcillo et al., 2000) established longer distances from the sea for the deposition of big particles: 150-250 m. No statistical model was fitted.
Annual average Cl - DR obtained with dry plate devices and reported for two Cuban areas without building structures and tall, natural vegetation (one in the western zone and another one in the eastern zone of the island), represented as a function of distance from the sea (Fig. 8a, b), is fitted to a model corresponding to an exponential decreasing function.
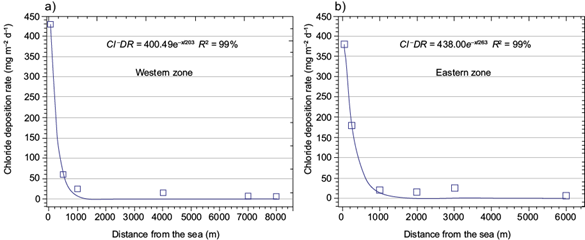
Fig. 8 Chloride deposition rate vs. distance from the sea reported for western and eastern zones in Cuba. The model fitted is Cl - DR = ae -x/t
Parameter t is within the 150-250 m range in the western zone (Fig. 8a). It shows a small increase in the eastern zone (Fig. 8b), which is indicative of the distance from the sea where decreasing annual average values of Cl - DR are stabilized. As can be seen, in zones without artificial and natural shielding, annual average Cl - DR tends to reach longer distances from the sea. This confirms that deposition or concentration of chloride could be affected by the presence of building structures and tall, natural vegetation. This feature is not referred in the ISO 9223:2012 (ISO, 2012a). In order to use the annual average Cl - DR classification established in the ISO standard, data corresponding to dry plates were converted into wet candle device data (Cl - DR wc1 , Cl - DR wc2 ) using the linear relationship established in the ISO 9225:2012 (ISO, 2012b).
It is important to note that in eastern and western zones of Cuba, outside of Havana City, without building structures and tall, natural vegetation, the annual average Cl - DR classification S 1 reaches longer distances from the sea. In the western zone (no mountains, flat and narrow territory) annual average Cl - DR can reach a distance up to 8000 m (Table VI), although the real influence of Cl - DR could be up to 7000 m (the maximum distance in the S 1 salinity classification). The S o classification is considered a bottom level of deposition where the influence of chloride is negligible.
Table VI Chloride deposition rate classification for outdoor exposure sites located in Havana City and sites outside the city (in eastern and western Cuba) with respect to distance from the sea (Havana City is located in the western zone).

It is interesting to observe that, in Havana City, the chloride deposition rate classifications S3 and S2 are not determined in outdoor exposure sites. Outdoor exposure site S 1 is classified as S 3 and the other outdoor exposure sites are classified as S 1 . Data corresponding to the open atmosphere outside the city show outdoor exposure sites classified as S 3 and S 2 , which confirms that the shielding condition due to building structures and tall, natural vegetation induces changes in the Cl - DR distribution. The classification of outdoor exposure site S 1 (located 20 m from the sea) as level S 3 could be due to the joint effect of the wave breaking zone and its impact on the building structures, which is not present in the open atmosphere. Outdoor exposure site 1 should be classified in the extreme corrosivity category of the atmosphere with respect to metallic materials commonly used in the construction industry, such as carbon and galvanized steel, as well as zinc, copper and aluminum.
3.3 Climatic factors influencing the chloride deposition rate
3.3.1 Wind speed
Monthly average Cl - DR in the seven outdoor exposure sites increased when monthly average wind speed coming from the sea also increased (Fig. 9a, b).
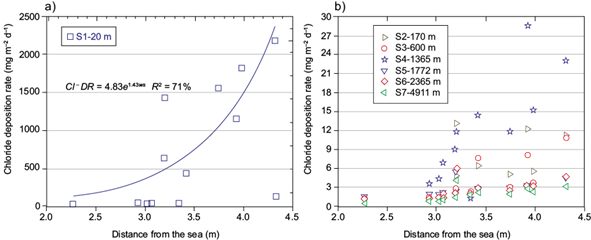
Fig. 9 Behavior of monthly average Cl- DR depending on monthly average wind speed coming from the sea (Cl- DR = ae bws ). (a) Exposure site S1. (b) Exposure sites S2-S7.
The processed monthly average wind speed data correspond to the east and northeast directions, that is, wind speed coming from the sea during the year of study (Fig. 4). Wind speed monthly average values of about 3 m s-1 show a trend toward increased monthly average values of Cl- DR data (Fig. 9a, b). These results are in agreement with other reports from sites without shielding conditions in the Australian coasts (Cole, 2003a), the Mediterranean coasts of Tarragona, Spain (Morcillo, 2000), and the city of Joao Pessoa in the east coast of Brazil (Meira, 2007).
Different threshold monthly average values of wind speed in the north coast of Sweden (Gustafsson and Franzén, 1996) and for the glacial Arctic and Pacific Ocean in Russia (Strekalov, 2000) have been reported in the open atmosphere, without shielding conditions. The necessary wind speed to observe an increase in monthly average Cl - DR was 5 and 6 m s-1, respectively. In the city of Chittagong, Bangladesh (located in the Indian Ocean coast), in presence of shielding conditions by building structures, the necessary monthly average wind speed to observe an increase in Cl - DR, determined by the wet candle method, was 5.5 m s-1 (Khandaker et al., 2009). The study was based on the evaluation of the effectiveness of protective mortars designed to resist penetration of sea salt, in order to increase the durability and service life of structures directly exposed to the action of chloride. Therefore, there is no confirmed consensus in the monthly average wind speed threshold to increase chloride deposition rate.
A trend to increase the model fit (Cl - DR =4.83e bws ) (R2) describing monthly average chloride deposition with the increase of average wind speed coming from the sea, is observed (Table VII). The best fit was obtained on the outdoor exposure sites having small shielding effects, like S1-20 m, where fundamentally there are not shielding conditions (Fig. 9a, b, as well as in the outdoor exposure sites S3-600 m and S4-1 365 m (Table VII).
3.3.2 Influence of relative humidity and air temperature on chloride deposition rate
Monthly average relative humidity (RH [%]) and air temperature (T [ºC]) data during the year of study was lower in the dry period (October-April), with the exception of October (Fig. 10). Heavy rain occurred in this month due to a combination of cold fronts entry and tropical depressions. The highest monthly RH was recorded.
Monthly RH is always over 70%. At this level of humidity, Cl - DR occurs mainly as saline solution and not as crystals. Heavy rain occurs during the wet period (May-September) due to the occurrence of tropical depressions. On the other hand, heavy rain occurs also during the entry of cold (stationary) fronts. Under these conditions, high (C4), very high (C5) and extreme (CX) corrosivity categories of the atmosphere are originated, not only for reinforced concrete structures, but also for every metallic material exposed to the atmosphere. Monthly average values of wind speed (WS m s-1) were higher in the dry period (October-April) with respect to the wet period (May-September) (Fig. 10). This could be one of the reasons that higher monthly Cl - DR data were obtained in the dry (winter) season.
In general, it can be seen that the three meteorological parameters mentioned above have not shown significant variations regarding annual average values during the last 27 years (Fig. 11).
This result confirms that chloride salts from the horizontal flow of marine aerosol have been usually deposited in the city as saline solutions and not as crystal salts at temperatures about 25 ºC. Therefore, high (C4), very high (C5) and extreme (CX) corrosivity categories of the atmosphere in Havana City were expected, especially in zones without shielding conditions. It is noted that the annual average wind speed measured in the same direction is about 3 m s-1. At this value, the chloride deposition rate increases.
The influence of the monthly RH-T complex, as well as, wind speed (WS) in monthly Cl - DR for every dry plate device is observed through multivariate regressions for seven outdoor exposure sites (Table VIII). The obtained multivariate regressions show the dependence between monthly Cl - DR and monthly RH, T, and WS.
Table VIII Multivariate regressions showing the influence of the monthly RH-T complex and wind speed (WS) in monthly Cl - DR for seven outdoor exposure sites.
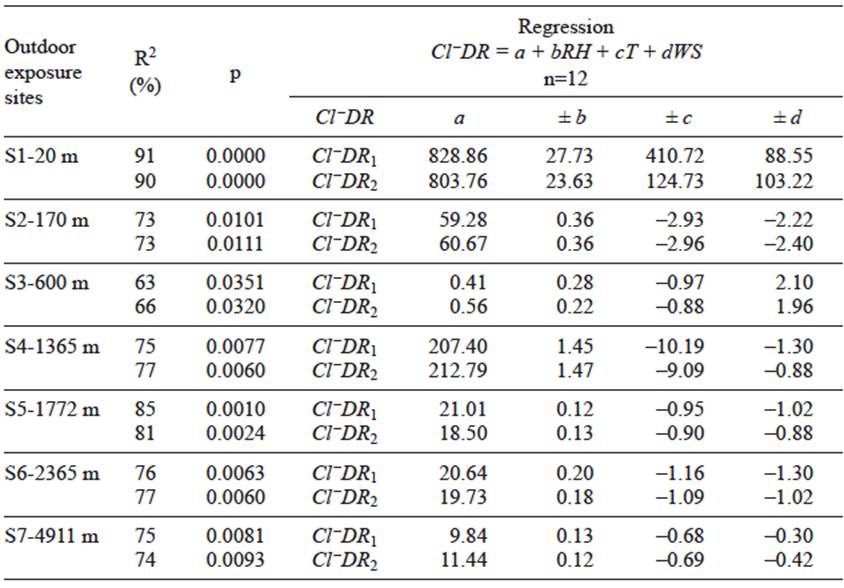
The best fit was obtained for the outdoor exposure site located 20 m from the sea. According to the regression coefficients and their sign, a different influence of RH and temperature is observed for the exposure sites at 20 and 600 m from the sea, that is, two of the outdoor exposure sites where a small extent of shielding condition is observed, particularly with respect to building structures.
Multivariate regressions obtained for outdoor exposure sites located at 20 and 600 m from the sea show an increase in monthly Cl - DR when WS increases if RH and T remain constant. In the other outdoor exposure sites, monthly Cl - DR decreases when WS increases if T and RH remain constant. In the outdoor exposure site located in front of the sea, wind speed can bring chloride aerosol directly from the sea, which clearly shows the influence of this feature
The same could occur in the outdoor exposure site located at 600 m from the sea. Perhaps wind in the other five outdoor exposure sites does not come directly from the sea and when wind speed increases, marine aerosol is dispersed. For both outdoor exposure sites (S1 and S2), it appears that monthly Cl - DR as saline solution is not only dependent on wind speed increase but also on an increase in RH and a decrease in T. For the rest of the outdoor exposure sites, when RH increases and T decreases, the chloride deposition as saline solution can occur due to a decrease in wind speed. At these sites, only small particles of chloride aerosol could be present.
Monthly Cl - DR increased when RH increased for all multivariate regressions obtained. Cl - DR as saline solution may occur when RH > 70%. In the case of T, a decrease causes an increase in the chloride deposition rate. It is very well known that normally RH increases when temperature decreases, so the influence of the T-RH complex in Cl - DR is very clear. The regression coefficients affecting temperature show higher values (Table VIII), indicating temperature is a very significant parameter for improving the fit of statistical models. However, the multivariate regressions obtained show the dependence between monthly Cl - DR vs. monthly RH, T, and WS (Table VIII).
For statistical significance, RH and WS can be eliminated to obtain a more accurate and precise result. It is observed that the influence of air temperature is remarkable in determining the chloride deposition rate as saline solution.
A linear regression between monthly Cl - DR and temperature shows a good statistical significance (Fig. 12a, b, c, d). It is observed in all sites that a decrease in monthly temperature causes a significant increase in monthly Cl - DR, probably as saline solution. The best fit is obtained for the outdoor exposure site located 20 m from the sea (Fig. 12a, b). The same occurs in the exposure site located 170 m from the sea (S2-S7), but in this case considering the annual average chloride deposition for each device (Fig. 12c, d).
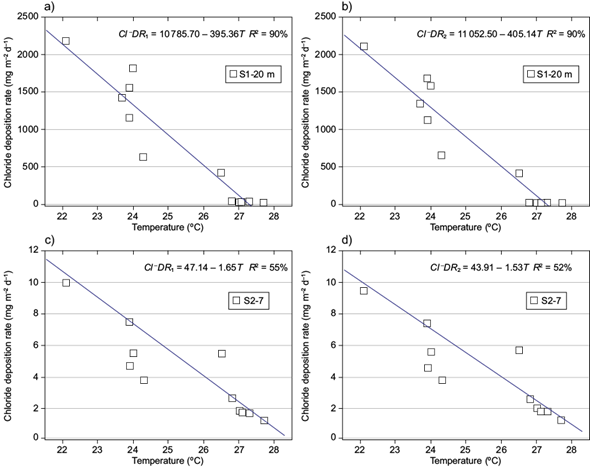
Fig. 12 Linear regression of monthly Cl - DR vs. monthly temperature. (a) and (b) outdoor exposure site located 20 m from the sea. (c) and (d) outdoor exposure site located at a distance of 170 m from the sea.
A linear fit shows that higher monthly Cl - DR as saline solution occurs at temperatures lower than 25 ºC, corresponding to the dry period (October-April), which is the cold fronts season. Their influence is more significant in the exposure site located 20 m from the sea. Thus, high (C4), very high (C5) and extreme (CX) corrosivity categories of the atmosphere in zones of Havana City is expected, showing that temperature decreases due to the occurrence of transitory meteorological phenomena such as entry of cold fronts it is a significant factor in Cl - DR. Influence of decreasing air temperature (due to entry of cold fronts) on salt particles or chloride deposition rate has not been taken into account previously.
4. Conclusions
In Havana City, at a distance from the sea about 32 m, deposition of heavier and bigger chloride particles reaches a minimum. Data was fitted to a decreasing exponential function established between chloride deposition and distance from the sea. An extreme corrosivity category of the atmospheres is predicted for the outdoor exposure site located in the open atmosphere in front of the sea.
Annual average wind speed showed a higher influence on corrosivity categories of the atmosphere in the outdoor exposure site close to the sea and without obstacles to the wind. Threshold annual average wind speed for increasing Cl - DR at different distances from the sea in Havana is about 3 m s-1.
Based on the behavior of the T-RH complex, it is proposed that Cl - DR in the city occurs more probably as drops of saline solution and not as crystallized particles at a temperature of 25 ºC or lower.
Wind speed is not the only meteorological variable influencing the Cl - DR, but also the T-RH complex, whose influence is higher in the outdoor exposure site close to the seashore without obstacles.
A decrease in air temperature, due to transitory meteorological phenomena, such as the entrance of cold fronts, is the climatic factor with higher influence on Cl - DR in the city. Its significance is higher in the outdoor exposure site close to the shoreline (S1 [20 m]).
Penetration of marine aerosol (measured by Cl - DR) in outdoor exposure sites near Havana but outside the city shows a longer distance for chloride deposition to reach a minimum. Parameter t changes from 32 m in the city to 263 m in the outskirts, that is, penetration of chloride is eight times higher outside the city. The distribution of Cl - DR is different in and outside the city.


 nueva página del texto (beta)


