


 nueva página del texto (beta)
 Inglés (pdf)
 Artículo en XML
 Referencias del artículo
 Enviar artículo por email
 Citado por SciELO
  Similares en
SciELO
Similares en
SciELO 
 Permalink
1. Introduction
Carbon is present as gaseous and condensed phases in the atmosphere and both of them are associated with anthropogenic and biogenic sources (Siudek et al., 2015). Atmospheric aerosols contain inorganic (IC) and organic carbon (OC). More than 2300 Tg of OC are emitted annually into the atmosphere and a significant fraction remains in the condensed aerosol phase (Yan and Kim, 2012; Nozière et al., 2015), affecting air quality and the radiative balance of the atmosphere (Gilardoni et al., 2016), both in urban and rural locations (Putaud et al., 2004; Zhang et al., 2007). The organic fraction includes saturated and unsaturated aliphatic compounds, aromatics, alcohols, ketones, aldehydes, carboxylic acids, amines, sugars, polyols, and organic sulphur compounds (Seinfeld and Pandis, 2006). OC is ubiquitous in urban locations (e.g., Zhang et al., 2007) and constitutes a major component (20-90% of the total mass) of the sub-micron atmospheric aerosol particles (Kanakidou et al., 2005; Moffet et al., 2010). Furthermore, it has been shown that water-soluble organic compounds (WSOC) represent 20-70% of the total organic aerosol mass (Saxena and Hildemann, 1996; Facchini et al., 1999) and can reach a considerable fraction (~50%) of the total water-soluble materials in the size range of the cloud condensation nuclei (Huang et al., 2006).
Wet deposition processes (e.g., rainout and washout) remove particulate material and pollutants from the atmosphere (Guidotti et al., 2000; Kawamura et al., 2001; Seinfeld and Pandis, 2006; Balla et al., 2014). Therefore, OC is a typical constituent of rainwater (Balla et al., 2014) and it can be used as an initial screening of air quality in different urban and/or industrial areas (Guidotti et al., 2000), and to infer some of its effects on ecosystems (Santos et al., 2009). WSOC are poorly understood due to their inherent complexity and difficulties in chemical analysis, even though they are essential components of atmospheric aerosols. The organic fraction consists of low-molecular weight (MW) polar compounds (Saxena and Hildemann, 1996; Kawamura et al., 2001) as well as high-MW, polydisperse macromolecules, termed as humic-like substances (HULIS) due to their similarities to terrestrial humic acids (Graber and Rudich, 2006). During the last two decades, OC present in the atmosphere was characterized using chromatographic techniques, mass and UV spectrometry, and nuclear magnetic resonance, among others; however, there remain many challenges in this research field (Nozière et al., 2015). Studies of OC in precipitation are scarce compared to those for other atmospheric substrates, but results indicate that OC in rainwater is lower compared to concentrations observed in snow and fog (Iavorivska et al., 2016 and references therein). Some of the previous reports have focused on the measurement of total WSOC concentrations (Coehlo et al., 2008; Pan et al., 2010; Yan and Kim, 2012; Siudek et al., 2015) and others have characterized the different fractions by using gas, liquid, and UV-visible chromatographies; molecular fluorescence; FTIR-ATR, and 1H NMR spectroscopies (Santos et al., 2009; Xu et al., 2008; Guidotti et al., 2000; Ćosović et al., 2007; Chon et al., 2015).
Previous studies on rainwater characterization in samples from Mexico City were conducted by analyzing major inorganic ions and trace elements (Báez et al., 2006, 2007; 2009; García et al., 2006). Báez et al. (1989, 1993, 2008) measured organic compounds in rainwater samples but focused only on carbonyl compounds. Balla et al. (2014, and references therein) reported that aldehydes constitute up to 16% of dissolved OC in rainwater samples. This study aims to measure the total organic content and characterize the organic compounds present in rainwater samples collected in an urban area of Mexico City during 2016. As rain collects air pollutants in gaseous and liquid phase, the determination and characterization of OC could be used as a screening of air quality in the area and for the study of surface-active effects (a key factor in the collision-coalescence process) in fog and cloud droplets due to the presence of these organic compounds.
2. Experimental
Mexico City’s metropolitan area (MCMA) is located to the southwest of the basin of Mexico. Except for the northeast, this basin is surrounded by mountains, some of them with altitudes higher than 4500 masl. Due to the subtropical latitude and the mean altitude (2250 m) of the basin, the intense solar radiation promotes the formation of photochemical pollutants in the area (Salcedo et al., 2006). The main rainy season - in terms of accumulated rain - occurs from May to October (summer and autumn), and it is characterized by the development of convective clouds with warm bases and cold tops (Kucieńska et al., 2010) with predominant winds coming from north-northeast (Jáuregui, 2000). Furthermore, the passage of cold fronts during the winter produces a second rainy season, although its contribution in terms of precipitated water quantity is much lower (Montero et al., 2011).
The sampling site is located on the roof of the Centro de Ciencias de la Atmósfera (Atmospheric Sciences Center, CCA) building (19.33º N, 99.18º W, 2280 masl) of the National Autonomous University of Mexico (Fig. 1), in the southwestern part of Mexico City. Instrumentation includes diverse sensors for the measurement of common meteorological parameters (temperature, pressure, wind direction and intensity, etc.) and evaluation of air quality. A Texas Electronics TR-525M tipping bucket rain gauge records rainfall intensity with a resolution of 0.1 mm and an accuracy of 1%. Rainwater samples were gathered from May to October 2016 on an event basis. Sample collection was made with a stainless steel funnel in order to avoid problems of absorption of organic compounds on the surface (Decesari et al., 2000) and amber glass bottles (washed with both deionized and grade HPLC water and combusted at 280 ºC during 24 h to remove volatile organic compounds). All the samples were filtered and stored in amber bottles - sealed with an aluminum foil baked at 280 ºC - and kept in refrigeration at 4 ºC after collection until analyzed. Filtration was done using filters TITAN3 (manufactured by Thermo Scientific) with nylon membrane and a diameter pore of 0.45 mm previously washed with deionized water.
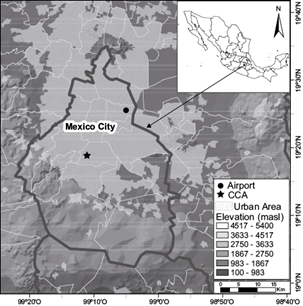
Fig. 1 Geographical location of the basin of Mexico, its main orographic features as well as the locations mentioned in the text.
2.1 Characterization of organic compounds
Proton nuclear magnetic resonance (1H NMR) spectroscopic analysis was done to obtain preliminary information about the organic matter dissolved in rainwater and aerosol samples. Some important characteristics of this technique include that good results - spectra - can be acquired to identify the functional groups of organics in one sample and the small amount (about 5 to 30 mg) necessary to perform the assays (Suzuki et al., 2001). Rain samples were dried using a rotary evaporator with a high purity nitrogen flow at ambient temperature (ca. 20 ºC). 1H NMR spectra were recorded in deuterated water (~0.6 mL) with an Eclipse JEOL 300 spectrometer.
2.2 Carbon analysis
Concentrations of total carbon (TC) and organic carbon (OC) dissolved in the rainwater samples were estimated by high temperature non-catalytic temperature using a Thermo Scientific HiperTOC carbon analyzer with an auto-sampler. The HiperTOC uses a dual NDIR approach (15.2 and 38.1 cm sample cells) to detect CO2 levels. Both detectors are calibrated to 1% CO2 full scale and operate reliably in the 0-1000 ppm CO2 gas range (Thermo Scientific, 2007). All results were gathered from the detector with the longest cell (low bench detector). Total OC was measured as Non-purgeable organic carbon (NPOC), which estimates the non-volatile OC (Saarikoski et al., 2008). The procedure involves removal of inorganic carbon (IC) by treatment with acid (Na2S2O8, also known as persulfate) prior to measuring the OC (Bisutti et al., 2004). The reference solutions for OC determinations were prepared from reagent grade anhydrous potassium hydrogen phthalate (KHP), while a mixture of anhydrous sodium carbonate and anhydrous sodium hydrogen carbonate was used for TC measurements. To perform carbon analyses, 0.25 mL of solution (sample) was injected into the analyzer, which oxidizes carbon at 1000 ºC without a catalyst. In particular, for NPOC measurements, the acidified samples were sparged with CO2 free carrier gas (UHP oxygen [99.8% purity] with < 0.5 ppm of total hydrocarbons) at a flow rate of 200 mL/min for 5 min to remove inorganic carbon prior to the actual analysis. Total IC can be estimated as the difference between TC and NPOC.
2.3 Back trajectory analysis
Backward trajectories of the air masses were calculated based on the hybrid single-particle Lagrangian integrated trajectory model - NOAA HYSPLIT (Stein et al., 2015) - to study a potential association between air masses and the organic contents in rainwater. The input parameters were as follows: meteorological database, NARR; trajectory duration, 48-h; vertical motion based on model vertical velocity, and starting heights, 500 and 1500 m above the ground level. Both height levels are within the air layer below the cloud base of the storms that occur in the area during the sampling period (Montero et al., 2011). The lowest level aims to facilitate studying the differences in the air mass trajectories closest to the superficial pollution sources with respect to those at higher levels.
The Red Automática de Monitoreo Ambiental (Automated Environmental Monitoring Network, RAMA) (http://www.aire.cdmx.gob.mx) employs 29 stations distributed throughout Mexico City to provide information about the pollutant levels. The hourly air pollution data from a RAMA station installed in the sampling site (CCA) was used in this study.
3. Results and discussion
3.1 Characterization of organics by 1H NMR
Based on the results of previous reports for urban areas worldwide (a few dozens of mg of carbon per liter of rainwater) and volumes of the collected samples during the first part of this study (less than 500 mL), it was decided to mix a pair of samples in order to get enough material for the 1H NMR analysis. The selected samples correspond to events occurred during the first part of the rainy season. The mixture of rainwater samples was injected into the 1H NMR instrument to obtain a proxy of the diversity of soluble compounds contained in the precipitation over the study area. Fig. 2 shows the gathered spectrum for the solution prepared after mixture two rainwater samples. Four or five categories of functional groups have usually been identified in aerosol and fog water samples (Decesari et al., 2000; Graham et al., 2002; Cavalli et al., 2006; Duarte and Duarte, 2011). The peak at 9.67 ppm can be attributed to aldehyde protons. Chemical shifts in the spectral rexgion between 7.25 and 7.9 ppm suggest protons in aromatics with electron-attractor substituents such as -CHO and -COOH. On the other hand, the shifts at about 6.8 ppm may be attributed to hydroxyl- and methoxyl- substituents in the aromatic hydrocarbons. Signals between 3.59 and 4.36 ppm correspond to aliphatic protons adjacent to alcohols and ethers. In addition, there are signals between 2.02 and 2.77 ppm corresponding to aliphatic protons adjacent to aromatic rings or carbonyl groups. Aliphatic protons adjacent to methylene groups and/or alcohols are abundant in the 1.25-1.5 ppm spectral region. Finally, the presence of methyl groups is evidenced by the 0.93 ppm signal (Decesari et al., 2000; Suzuki et al., 2001; Pretsch et al., 2009).

Fig. 2 1H NMR spectrum at 300 MHz for the rainwater extract. The reported chemical shifts are referred to deuterated water used to dissolve the remnants after the extraction.
The results from the 1H NMR spectrum show that the composition of the water-soluble organic fraction in rainwater samples is in agreement with other previously published reports about the composition of aerosols in Mexico City, with aliphatic saturated and carboxylic acids groups as major components in sub-micron particles (Gilardoni et al., 2009) and other atmospheric pollutants. This suggests that composition of the water-soluble organic fraction in rainwater over the sampling site is due to the occurrence of wet deposition processes.
Báez et al. (1989, 1993, 2008) detected carbonyl compounds, especially formaldehyde, both in rainwater and particulate samples from Mexico City and other near places. They associated the presence of these compounds with anthropogenic emissions (motor vehicles exhaust). Aromatic and aliphatic acids have also been detected in rainwater samples from urban areas around the world (Chon et al., 2015). It is known that gaseous aliphatic and aromatic anthropogenic volatile organic compounds (VOCs) can produce particulate aliphatic and aromatic carboxylic acids and aldehydes via secondary organic aerosols (SOA) formation, but these organic acids and aldehydes can also be emitted directly by motor vehicles (Sullivan et al., 2006 and references therein) and cigarette emissions (Chon et al., 2015). Low molecular weight carboxylic acids mainly originate from vehicular exhaust but can also be produced by photo-oxidation of terpenes emitted from biological organisms (Sun and Ariya, 2006). Aliphatic acids have their origin from both primary natural (microbial activity and vegetation) as well as anthropogenic sources (biomass burning and traffic exhaust). Finally, the organic carbon in aerosol particles produced from biomass burning has been shown to be predominately aliphatic, composed mainly of oxygenated compounds with a minor content of aromatic compounds containing poly acidic compounds and phenols (Graham et al., 2002; Sullivan et al., 2006). This analysis and the report of Tsimpidi et al. (2011)) indicate that the main sources of organic compounds in Mexico City are anthropogenic pollution (motor vehicles, including diesel and gasoline) and biomass burning.
3.2 TC and NPOC results
Former storage experiments at 4 ºC refer that rainwater dissolved organic carbon (DOC) concentrations were stable (3%) for a week (Willey et al., 2000). On the other hand, Campos et al. (2007) reported that DOC loss in rainwater samples may be smooth or even not significant in samples with storage periods up to 21 days under the same conditions. In this study, the maximum variability for the analysis performed of a pair of samples with four weeks storage was of 17 and 25% for TC and NPOC, respectively. In the case of a sample with up to six weeks of storage, the depletion of organics (NPOC) amount was of 38%. Our results for loss of organics are comparable to those from Campos et al. (2007). Table I presents the contents of TC and NPOC in rainwater samples with a storage period up to three weeks at 4 ºC. Carbon concentrations are expressed as ( ± unc), where () is the mean value of the instrument measurements and unc is the standard deviation of the mean (SDOM) - calculated by dividing the standard deviation (σx) with squared root of the number of injections (
 ) - plus the variability due to storage. For those rainwater samples with storage period up to one week, unc does not include the storage variability. The limit of detection for TC and NPOC are 10.6 and 2.40 mgC L-1, respectively. The accumulated rain data (R
ac
) correspond to the amount of precipitation event estimated by the TR-525M rain gauge.
) - plus the variability due to storage. For those rainwater samples with storage period up to one week, unc does not include the storage variability. The limit of detection for TC and NPOC are 10.6 and 2.40 mgC L-1, respectively. The accumulated rain data (R
ac
) correspond to the amount of precipitation event estimated by the TR-525M rain gauge.
Table I TC and NPOC concentrations, pH and accumulated rain data for samples collected during the field campaign. Accumulated rain is expressed in mm while carbon contents are reported in mgC L-1 (mean ± unc). N1 and N2 correspond to the number of analysis performed by the analyzer.
| Date | Rac (mm) | pH | N1 | TC (mgC L-1) | N2 | NPOC (mgC L-1) |
| 26/05/2016 | 2.9 | 5.3 | 3 | 24.8 ± 4.3 | 3 | 16.6 ± 4.2 |
| 02/06/2016 | 1.8 | 6.2 | 3 | 20.3 ± 3.5 | 3 | 15.1 ± 4.0 |
| 07/06/2016 | 7.2 | 4.2 | 3 | 20.6 ± 3.5 | 3 | 11.9 ± 0.2 |
| 14/06/2016 | 1.6 | 6.7 | 3 | 24.0 ± 4.2 | 3 | 15.4 ± 4.1 |
| 20/06/2016 | 3.3 | 5.1 | 3 | 21.5 ± 3.7 | 3 | 19.4 ± 4.9 |
| 08/08/2016 | 1.4 | 5.7 | 3 | 8.9 ± 1.6 | 3 | 3.5 ± 0.9 |
| 10/08/2016 | 4.7 | 5.5 | 3 | 9.1 ± 1.7 | 3 | 3.5 ± 0.9 |
| 16/08/2016 | 16.7 | 6.2 | 2 | 13.4 ± 2.4 | 1 | 3.3 |
| 24/08/2016 | 23.8 | 5.2 | 3 | 13.3 ± 2.5 | 3 | 3.4 ± 0.9 |
| 06/09/2016 | 2.9 | 7.3 | 3 | 11.8 ± 1.2 | 2 | 6.6 ± 1.9 |
| 12/09/2016 | 14.6 | 6.3 | 3 | 14.4 ± 0.6 | 3 | 3.9 ± 0.9 |
| 13/09/2016 | 0.4 | 6.8 | 3 | 14.9 ± 1.5 | 3 | 4.3 ± 0.4 |
| 19/09/2016 | 1 | 6.7 | 3 | 15.5 ± 2.7 | 3 | 7.8 ± 1.9 |
| 28/09/2016 | 6.9 | 4.4 | 3 | 11 ± 2.2 | 3 | 3.2 ± 0.8 |
| 12/10/2016 | 10.8 | 7.1 | 3 | 10.4 ± 0.5a | 3 | 2.5 ± 0.1 |
aThis value is just below the limit of detection for TC; unc: sum of the standard deviation of the mean plus the variability due to sample storage.
Concentrations of TC and NPOC divide the samples into two different groups. The first one corresponds to samples collected between May and July with higher mean values of TC (22.2 mgC L-1) and NPOC (15.7 mgC L-1) compared to the samples obtained for the second period between August and October (TC, 15.7 mgC L-1; NPOC, 4.2 mgC L-1). The difference is more evident in the case of NPOC, since concentrations are reduced significantly during the second period. A similar behavior between spring and summer is observed in Pan et al. (2010). Although the authors do not mention a clear justification for their observations during this particular period, they refer that emission changes from diverse sources during the study as well as variability in rain amounts may be responsible for the organic concentration differences. Moreover, the results for NPOC in Table I are higher than the continental rain (1.9 mgC L-1; Willey et al., 2000), indicating that the occurrence of rain is associated with terrestrial and local features.
The relation NPOC/TC suggests that contribution of organic carbon to total carbon in rainwater fluctuated along the year. The proportion NPOC/TC was 0.7 on average during the first part of the campaign and it is comparable to the observed by Pan et al. (2010) but lower than the value reported by Siudek et al. (2015). Organic levels in our sampling site are comparable to those reported for other urban areas in China and Poland, although the larger concentrations gathered in Mexico City were not so large compared to those reported in the mentioned studies. The NPOC/TC ratio in the sampling site decreases to 0.3 during the August-October period; plausible explanations regarding this difference can be that air masses were more photochemically processed during the first part of the campaign (Kondo et al., 2007) or that there was a change in the source contributions for WSOC during the sampling period (Saarikoski et al., 2008). It is worthy of note that the amount of inorganic carbon, reported as water-soluble inorganic carbon (WSIC = TC - NPOC) in the rainwater samples for Mexico City remained similar for the whole campaign. Mexico City’s rainwater has an average of 7.6 ± 3.5 mgC L-1 of WSIC, which is higher than the values reported for Poland and China and explains the larger NPOC/TC values for Poland (Siudek et al., 2015) respect to those found in our sampling site. The WSIC content found in this study is higher than the continental rain expected from Henry’s Law and carbonic dissociation (0.2 mgC L-1; Willey et al., 2000) and global average (1.9 mgC L-1; Liu et al., 2004), but comparable to levels reported for urban and polluted areas (up to 10 mgC L-1; Pan et al., 2010). It suggests that local sources contribute dominantly to this carbonaceous fraction.
A comparison of the results obtained in this study with organic concentrations measured in rainwater from several urban areas around the world is presented in Table II. Except for Los Angeles (USA), most of the studies used TOC analyzers for the measurements of carbon. Kawamura et al. (2001) oxidized the samples from Los Angeles with K2Cr2O4 and determined the resultant CO2 by a coulometric detector. Organic carbon (NPOC) content in rainwater samples from Mexico City shows a range comparable to dissolved organic concentrations reported from Tokyo (Japan), Los Angeles and Thessaloniki (Greece). However, the higher values of our study are higher compared to urban areas located at Guangzhou (southern China), Zagreb (Croatia), Seoul and Gwangju (Korea). Some of the rainwater samples from northern China and Poznań (Poland) exhibited much higher DOC concentrations (above 44 and 48 mg L-1, respectively) than in Mexico City.
Table II Organic concentrations in rainwater from this study compared with other studies performed at urban areas of different parts of the world. Data show the minimum and maximum values obtained for the collected samples.
| Location | DOC range (mgC L-1) | Reference |
| Tokio, Japan | 15.4 - 1.2 | Sempere and Kawamura (1994) |
| Los Angeles, USA | 18 - 2.0 | Kawamura et al. (2001) |
| Guangzhou, China | 8.3 - 0.93 | Xu et al. (2008) |
| Northern China | 44.1 - 0.3 | Pan et al. (2010) |
| Zagreb, Croatia | 7.84 - 0.19 | Orlović-Leko et al. (2010) |
| Seoul, Korea | 9.36 - 0.18 | Yan and Kim (2012) |
| Thessaloniki, Greece | 21.3 - 0.46 | Balla et al. (2014) |
| Poznań, Poland | 48.3 - 0.1 | Siudek et al. (2015) |
| Gwangju, Korea | 6.9 - 0.15 | Chon et al. (2015) |
| Mexico City | 19.5 - 2.4 | This study |
Table III shows maximum concentrations of tropospheric O3 in the atmosphere for the sampling period of this study. It also has the average concentration of PM2.5 three hours before the rain event (i.e., PM2.5[-3h]) - calculated from the measurements registered by the RAMA station installed at Atmospheric Sciences Center (CCA) - and the scavenging efficiencies (ηm) for ozone and particulate matter estimated according to Collett et al. (2008) as, 1 - (Conc m, intersticial /Conc m, pre-rain ) where the prefix m refers to O3 and particulate matter. Reported concentrations of O3 during the months of May and first half of June - corresponding to some of the highest pollution levels for 2016 - have a similar behavior to TC and NPOC results. Moreover, it is found that O3 is well correlated (R2 = 0.69) with PM2.5 concentrations.
Table III Maximum concentrations of O3 (ppb) in the atmosphere, as well as 3-h mean levels of PM2.5 registered by the CCA station (source, RAMA website) before precipitation in the sampling site. Scavenging efficiencies estimates for particulate matter and ozone are also shown.
| Date | O3 (ppb) | PM2.5(-3h) µg m-3 | η PM2.5 (%) | η O3 (%) |
| 26/05/2016 | 123 | 31.3 | 56.7 | 40.4 |
| 02/06/2016 | 104 | 24.7 | 64.7 | 29.4 |
| 07/06/2016 | 140 | 44.7 | 43.5 | 43.6 |
| 14/06/2016 | 98 | 13.7 | 26.7 | 9.7 |
| 20/06/2016 | 47 | 24.3 | 46.2 | 36.8 |
| 08/08/2016 | 55 | 7.3 | 25.0 | 39.2 |
| 10/08/2016 | 81 | 15.0 | 27.8 | 55.6 |
| 16/08/2016 | 62 | 12.0 | 42.9 | 38.2 |
| 24/08/2016 | 93 | 21.3 | 28.6 | 63.9 |
| 06/09/2016 | 95 | 15.7 | 14.3 | 25.0 |
| 12/09/2016 | 111 | 37.7 | 54.5 | 40.0 |
| 13/09/2016 | 91 | 25.3 | 47.6 | 17.6 |
| 19/09/2016 | 67 | 14.0 | 28.6 | 13.3 |
| 28/09/2016 | 50 | 20.3 | 44.0 | 42.9 |
| 12/10/2016 | NA | 39.3 | 66.1 | NA |
NA: not available.
It can be observed that concentrations of the organic fraction in rainwater samples decrease as precipitation increases (Fig. 3). This behavior is similar to that reported by Pan et al. (2010) and Yan and Kim (2012), indicating that organics are washed out effectively during the initial stages of rain events. Precipitation is among the key factors controlling the pollution levels in the study area since it is considered to be the dominant scavenging mechanism in the atmosphere (Yan and Kim, 2012); therefore, it should represent an important cleansing mechanism. Associations between O3 and PM2.5 scavenging efficiencies with the amount of precipitation are shown in Fig. 3b, c. Displayed results in these panels indicate higher efficiencies for O3 and PM2.5 scavenging as the amount of rain from an event increases, which is in agreement with the expected role of precipitation as an atmospheric cleansing process. However, there seems to be an apparent limit for the scavenging efficiency value, but the obtained data are insufficient to confirm this observation. The correlation between PM2.5 and rainfall, however, is not clear (Fig. 3c). This weak association may be due to a continuous supply of particulate matter during rain events (Kieber et al., 2002; Yan and Kim, 2012).

Fig. 3 (a) NPOC concentration and O3 and (b, c) PM2.5 scavenging factors as function of rain amount for precipitation events collected in the sampling site.
Figure 4 exhibits the association of NPOC observations with sulfur dioxide (SO2) and carbon monoxide (CO). SO2 emissions from anthropogenic and natural sources are oxidized quickly in the atmosphere, leading to aerosol formation and acid deposition through sulfuric acid (Lee et al., 2011; He et al., 2012). Although SO2 emission have been reduced since 2006 due to changes in fuel formulations, the main sources of SO2 in the Mexico City area are industrial activities - especially power plants and the oil refinery in Tula, Hidalgo (northwest of the city). On the other hand, carbon monoxide (CO) is emitted from methane and non-methane hydrocarbon oxidation, from fossil fuel combustion (associated with car traffic, industry and domestic heating), and from vegetation burning for agricultural purposes or from wildfires (Clerbaux et al., 2008). CO in Mexico is mainly emitted from vehicles (Benítez at al., 2014). Data displayed in Figure 4 show a trend to larger NPOC concentrations as the amount of these pollutants increases. The association between NPOC and CO is more evident compared to the relation between NPOC and SO2, suggesting that the presence of water-soluble organic matter in the area is more dependent on local sources (vehicle emissions).

Fig. 4 Concentrations of sulfur dioxide (red diamonds) and carbon monoxide (blue squares) vs. NPOC for the studied rain events.
Meteorological and geographical conditions affect the evolution of pollutants (Sun et al., 2013; You et al., 2015) over the MCMA. The 48-h trajectories of air masses for 500 and 1500 m above the ground level for the studied rainstorms are shown in Figure 5. The trajectories evidence that air masses were located almost all the time over the continent, as suggested by the obtained results of organic and inorganic carbon contents in rainwater samples - which are higher than those representative for continental rain (Willey et al., 2000). With the aid of trajectory analyses, we tried to find a trend for the organic levels and pH values respect to the origin of air masses. The trajectory corresponding to 500 m above the ground was intended to look into the relation between the nearest (local) sources and the rainwater parameters studied in this work. The motivation for the corresponding trajectories at 1500 m above the ground was to study the influence of transport of pollutant sources located away from the sampling site. Panels (a) and (b) in Fig. 6 exhibit the NPOC results (concentric circles) for the rainstorms studied in this report in function of prevalent wind from the HYSPLIT diagrams. Although most of the storms were advected from the north-northeast, as expected according to Jáuregui (2000), data for the 500 and 1500 m levels do not show a clear relationship between the air masses’ origin and those cases with high (> 10 mgC L-1) carbon contents, since some of them arrived from north but others from other directions.

Fig. 5 (a) Air-mass back trajectories randomly selected for the field campaign observed during the rainy season of 2016. (b) Continuation of (a).
The pH varied from 4.2 to 7.3 and it is similar to the observations of Báez et al. (2007). Panels (c) and (d) in Fig. 6 display the pH values for the rainwater samples collected during the field campaign in function of wind direction for the selected height levels in the back-trajectory diagrams. Due to limited data, it is only possible to speculate about the location of pollutants sources near or within Mexico City that control the constituent levels in rainwater. A meticulous analysis of the pH and the mass air origin shows that most of the rainwater samples had pH greater than 5.6 (pH of rainwater in equilibrium with atmospheric CO2; Shukla and Sharma, 2010) when the wind pattern had a dominant northern or northeastern component. On the other hand, there is not any specific prevailing wind direction for those rainwater samples that had pH in the acidic range.
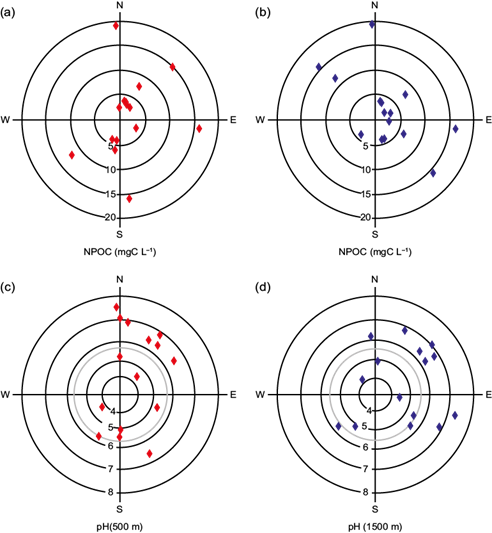
Fig. 6 Measurements of NPOC concentrations and pH (in concentric circles) for the rainwater samples collected during the field campaign in function of wind direction for the 500 (red diamonds) and 1500 m (blue diamonds) above the ground. Vertical and horizontal lines refer to the cardinal coordinates. The wind direction corresponds to the component 6 h before rain occurrence. The grey circles in pH panels indicate the limit for neutral pH of atmospheric water with CO2 equilibrium. Points outside this circle identify rainwater samples from alkaline events.
Physical and chemical interactions between aerosols and gases with cloud droplets and raindrops represent many uncertainties for the prediction of pH in rainwater. Even though there are important sources of SO2 in Tula, located north of the city, the pH of rainwater was not affected by these sources. Our results and other previous studies suggest that sources situated north of the sampling site have more influence on the rain neutralization processes reflected by decreasing pH. Báez et al. (2007) indicated that particles with NH4 + and Ca2+ were among the main agents for rain neutralization in the basin of Mexico. NH4 + is derived from cleaning items, industry, excrements and pet urine, and agricultural activities, whilst Ca2+ is sourced from soils located northeast of Mexico City. Furthermore, another plausible element for rain neutralization may be the scavenging of ammonia emitted by more than 4.8 million vehicles, most of them with catalytic converters (Perrino et al., 2002; INEGI, 2015).
4. Summary and conclusions
The present study reports water-soluble total and organic carbon contents in rainwater samples collected from the southwestern part of Mexico City during 2016 (May-October) and their chemical characteristics through a preliminary study. 1H NMR analysis indicates the presence of aldehydes, carboxylic and other oxygenated groups present in aromatic and aliphatic hydrocarbons. Carbon analyses were performed using a Thermo Scientific HiperTOC analyzer to gather data of total as well as organic carbon, measured as NPOC. Results show notable changes in concentrations of both TC and OC during May-June (first part) and August-October (second part). Mean values for TC (22.2 mgC L-1) and NPOC (15.7 mgC L-1) in the first part were higher compared to the second part (TC, 12.3 mgC L-1; NPOC, 4.2 mgC L-1). The chemical characteristics and concentration values are comparable to organic content observed in other urban areas throughout the world. Furthermore, the NPOC/TC ratio for rainwater samples decreased during the second part of the campaign (the amount of organics render the 71% of the total carbon detected during the first part of the campaign but it decreased to 34% during the last one). However, the inorganic carbon concentration was 7.6 mgC L-1 in average and it is higher than the continental rain, suggesting that local sources contribute to this carbonaceous fraction. Analysis of air trajectories for 500 and 1500 m above the ground level did not show an association between carbon contents in rainwater and the air mass origin. It suggests that most of the carbon detected in rain samples was produced by local sources. We observed that rainwater pH tends to be alkaline when the wind direction had a dominant north or northeast component. Similar to the observations of Báez et al. (2007), the industrial emissions and particles from sediments and soils from the northern parts of the city could be the neutralizing agents. Moreover, the scavenging of ammonia emitted by vehicles was another plausible element for rain neutralization. The organic compounds (aromatic and alkenes) control production of daytime ozone in the MCMA (e.g., Tie et al., 2007) and we observed some of the highest NPOC levels and higher concentrations of O3 during May and the first half of June. More data, however, is required to relate the organic concentrations in rainwater with the pollution levels in the basin.

