


 nueva página del texto (beta)
 Inglés (pdf)
 Artículo en XML
 Referencias del artículo
 Enviar artículo por email
 Citado por SciELO
  Similares en
SciELO
Similares en
SciELO 
 Permalink
1. Introduction
The adverse effects of atmospheric air pollution are currently well known (Tzanis et al., 2009, 2019; de la Fuente et al., 2011; Ganguly and Tzanis, 2011; Sinha et al., 2016; Fallahi et al., 2018). Air pollution occurs due to a number of factors such as interaction among local weather patterns, atmospheric circulation features, topography, human activities, emissions from vehicles, industries using coal for power, dust from construction activities and long-range transport of air pollutants (Rappengluck et al., 1999; Kossmann and Sturman, 2004; Mavrakou et al., 2012; Varotsos et al., 2012; Deligiorgi et al., 2013; Amanollahi et al., 2013, 2016; Alimissis et al., 2018). Large-scale airflows interact with mountain and valley winds to increase pollutant concentrations (Triantafyllou, 2001; Kitada and Regmi, 2003). Meteorological conditions also influence the chemical and physical processes involved in the formation of secondary pollutants (Nilsson et al., 2001a, b; Tzanis, 2005, 2009a, b). India is the seventh largest country in the world spanning between 8º 4’-37º 6’ N and 68º 7’-97º 25’ E. It is also the world’s second largest populated nation. Primary sources of air pollution in India include industries, power plants, biomass burning and vehicular transport. The growth in urban population and extensive development activities have further added to the increased levels of air pollution. The lack of an efficient public transport system in most cities and growing travel demands have fuelled the growth of private vehicles, thereby increasing pollutants concentrations. Particulate matter and NOx are the major pollutants that have been reported (Mahtta, 2015). An alarming increase in air pollution was observed in India during late October to the end of November in the year 2016. As the frequency and intensity of similar pollution events has increased in the recent years, the causes for this observed high pollution event are examined.
A possible cause of these high pollution levels could be the ignition of fireworks during the Diwali festival, which was celebrated on October 30, 2016 (Attri et al., 2001; Kulshrestha et al., 2004; Ganguly, 2009; Deka and Hoque, 2014; Saha et al., 2014; Ganguly, 2015). Another possible cause of the high pollution levels could be the burning of stubble in paddy fields in the states of Punjab, Haryana and Uttar Pradesh during the months of October and November (Mittal et al., 2009) to prepare the field for the next crop. It is an uncontrolled combustion process during which several tones of CO2, NOx, CH4, CO, NH3, NMHC, SO2 and particulate matter are emitted (Streets et al., 2003; Gadde et al., 2009; Sahai et al., 2011; Jain et al., 2014). Finally, the high levels of pollution could also be due to long-distance transport of various air pollutants. The predominant cause for the observed pollution in different cities of India is examined in this study.
2. Methods
2.1. Methodology
The unique characteristics of the Diwali festival and its effects on air pollution levels over India require a nation-wide approach according to the following steps:
Analysis of air pollution concentration levels for multiple air pollutants, using a representative air quality network in a countrywide level for two time frames (pre and during the Diwali festival). Association of air pollution levels and health impacts using indices (i.e., the Air Quality Index [AQI] - Table I).Analysis of the effects of principal factors that determine air pollution dispersion conditions, focusing on the effect of synoptic scale and local meteorological conditions.Assessment of the effect of additional air pollution sources. In the case of India during the Diwali festival the effect of uncontrolled combustion and long-range air pollution transport is evaluated.
Table I Air Quality Index categories and associated health impacts.
| AQI | Health impacts. | |
| Good | 0-50 | Minimal impact. |
| Satisfactory | 51-100 | May cause minor breathing discomfort to sensitive people. |
| Moderately polluted | 101-200 | May cause breathing discomfort to people with lung disease such as asthma, and discomfort to people with heart disease, children and older adults. |
| Poor | 201-300 | May cause breathing discomfort to people on prolonged exposure, and discomfort to people with heart disease. |
| Ver poor | 301-400 | May cause respiratory illness to the people on prolonged exposure. Effect may be more pronounced in people with lung and heart diseases. |
| Severe | 401-500 | May cause respiratory effects even on healthy people and serious health impacts on people with lung/heart diseases. The health impacts may be experienced even during light physical activity. |
2.2. Area of study and data
The case study is based on a nation-wide analysis of air pollution concentration levels due to the significant effect of the Diwali festival in every part of the country (Fig. 1).
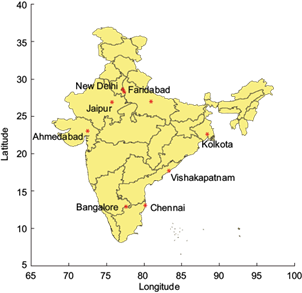
The selected sites are presented in Table II along with the availability of air pollutant concentrations and wind speed data. In more detail, mean daily particulate matter (PM2.5), sulfur dioxide (SO2), ozone (O3), nitrogen oxides (NOx), benzene (C6H6) concentrations and wind speed and direction data are extracted from the database of the Indian Central Pollution Control Board (CPCB). According to the national ambient air quality standards, the permissible levels for NOx and SO2 concentrations are 80 µg m-3 for a 24-h average; 60 µg m-3 for PM2.5, 100 µg m-3 for O3, and 2 µg m-3 of CO for an 8-h average; and 5 µg m-3 for C6H6 in an annual average.
Table II Air monitoring stations and availability of air quality and wind data.
| City | State | PM2.5 | SO2 | O3 | CO | NOx | C6H6 | WS |
| Faridabad | Haryana | ✓ | ✓ | ✓ | ✓ | ✓ | ✓ | ✓ |
| New Delhi | Delhi | ✓ | ✓ | ✓ | ✓ | ✓ | ✓ | ✓ |
| Lucknow | Uttar Pradesh | ✓ | ✓ | ✓ | ✓ | ✓ | ✓ | ✓ |
| Jaipur | Rajasthan | ✓ | ✓ | ✓ | ✓ | ✓ | ✓ | ✓ |
| Ahmedabad | Gujarat | ✓ | ✓ | ✓ | ✓ | ✓ | ✓ | ✓ |
| Kolkata | West Bengal | ✗ | ✗ | ✓ | ✓ | ✓ | ✗ | ✗ |
| Chennai | Tamilnadu | ✓ | ✓ | ✓ | ✓ | ✓ | ✓ | ✗ |
| Bangalore | Karnataka | ✓ | ✓ | ✓ | ✓ | ✓ | ✓ | ✗ |
| Vishakapatnam | Andhra Pradesh | ✓ | ✓ | ✓ | ✓ | ✓ | ✓ | ✗ |
Additionally to the above-mentioned ambient air pollutant concentrations, the daily AQI is also extracted from the CPCB database. The AQI in India is developed to inform the public about the exposure risk to air pollution and to help authorities to adopt effective air pollution control measures. The AQI system considers eight pollutants (PM10, PM2.5, NO2, SO2, CO, O3, NH3, and Pb), calculates a sub-index for one of them and the overall AQI corresponds to the maximum value of the individual sub-indices. The proposed AQI index, based on the dose-response relationships for each pollutant, has six categories ranging from good to severe that relate to specific health impacts (Akolkar, 2014).
The effect of synoptic conditions is examined in terms of mean sea level pressure (MSLP), and the resulting wind field at 10 m is obtained from the NCEP/NCAR Reanalysis I (Kalnay et al., 1996), whereas local wind conditions are extracted from the Indian Environment Network. The 5-day back trajectories at different altitudes have been retrieved from the HYSPLIT model of NOAA Air Resources Laboratory (Stein et al., 2015) based on Global Forecast System (GFS) meteorological data, while biomass burning has been visualized from EOSDIS Worldview (https://earthdata.nasa.gov/labs/worldview).
3. Results
3.1. Air quality assessment
The AQI time series for the period under study and the selected sites over India are presented in figure 2. The overall air quality conditions over Faridabad, New Delhi and Lucknow range from very poor to severe (greater than 300 and 400, respectively) for significant number of days with important health implications even on healthy people. The conditions at Jaipur and Ahmedabad are considered poor or very poor for a small fraction of days whereas for the remaining sites (Kolkata, Chennai, Bangalore and Vishakapatnam) the conditions are considered healthier with very few days exceeding the 200 and 300 limits. It should be noted that the higher AQI values are associated with the sites located at the northern and western parts of India (Faridabad, New Delhi, Lucknow, Jaipur and Ahmedabad) and lower at the southern and eastern parts (Kolkata, Chennai, Vishakapatnam and Bangalore).
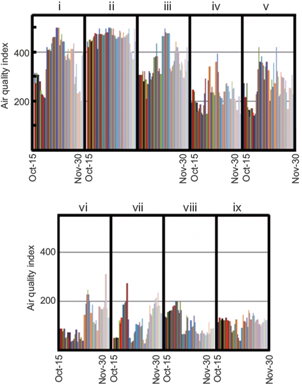
Fig. 2 Air Quality Index for the selected sites and period of study for Faridabad (i), New Delhi (ii), Lucknow (iii), Jaipuir (iv), Ahmedabad (v), Kolkota (vi), Chennai (vii), Bangalore (viii) and Vishakapatnam (ix).
Regarding the mean daily PM2.5, SO2, O3, CO, NOx and C6H6 concentrations for a normal day prior and post the Diwali festival (October 24 and November 5, 2016) and for the Diwali day (October 30, 2016), in Table III it is observed that in most cases for the Faridabad, New Delhi, Lucknow, Jaipur and Ahmedabad sites the concentrations during the Diwali day increased compared to normal days before and after Diwali. On the contrary, for the rest of the sites either minor increases or even decreases in air pollutant concentrations are observed.
Table III Comparison of normal days pre and post-Diwali to Diwali day air pollutant concentrations.
| PM2.5 | SO2 | O3 | CO | NOx | C6H6 | ||
| Faridabad | Pre-Diwali | 326.05 | 12.38 | 16.02 | 2.88 | 68.05 | 11.84 |
| Diwali | 338.86 | 52.34 | 40.91 | 2.35 | 96.21 | 16.38 | |
| Post-Diwali | 915.15 | 38.28 | 33.31 | 4 | 101.66 | 18.26 | |
| New Delhi | Pre-Diwali | 209.37 | 20.51 | 23.13 | 3.38 | 372.42 | 1.63 |
| Diwali | 350.21 | 46.97 | 77.07 | 4.25 | 361.11 | 2.42 | |
| Post-Diwali | 783.31 | 23.36 | 39.8 | 5.52 | 627.72 | 7.86 | |
| Lucknow | Pre-Diwali | 149.18 | 8.21 | 45 | 0.43 | 46.78 | 0.19 |
| Diwali | 270.39 | 9.6 | 34.16 | 0.28 | 48.25 | 1.51 | |
| Post-Diwali | 248.27 | 4.7 | 45.65 | 0.31 | 74.82 | 3.1 | |
| Jaipur | Pre-Diwali | 71.42 | 12.09 | 31.77 | 1.63 | 5.39 | 7.1 |
| Diwali | 185.56 | 16.95 | 23.86 | 2.6 | 25.48 | 2.95 | |
| Post-Diwali | 39.77 | 15.65 | 11.66 | 1.37 | 62.83 | 2.07 | |
| Ahmedabad | Pre-Diwali | 74.22 | 115.96 | 86.66 | 1.13 | 15.7 | 7 |
| Diwali | 1055.72 | 66.88 | 87.76 | 4.24 | 44.49 | 24.67 | |
| Post-Diwali | 260.27 | 68.01 | 92.1 | 5.82 | 55.28 | 30.48 | |
| Kolkata | Pre-Diwali | NA | NA | 11.64 | 0.93 | 80.02 | NA |
| Diwali | NA | NA | 5.38 | 1.12 | 45.74 | NA | |
| Post-Diwali | NA | NA | 2.7 | NA | 28.48 | NA | |
| Chennai | Pre-Diwali | 56.71 | 2.21 | 42.59 | 0.49 | 17.77 | NA |
| Diwali | 30.7 | 7.08 | 21.42 | 0.7 | 5.54 | NA | |
| Post-Diwali | 46.61 | 2.36 | 27.45 | 0.47 | 25.71 | NA | |
| Bangalore | Pre-Diwali | 46.77 | 2.37 | 34.72 | 0.81 | 11.12 | NA |
| Diwali | 52.35 | 9.1 | 19.08 | 1.56 | 6.07 | NA | |
| Post-Diwali | 41.17 | 3.07 | 38.58 | 1.54 | 15.64 | NA | |
| Vishakapatnam | Pre-Diwali | 63.19 | 32.65 | 58.71 | 1.54 | 77.2 | 9.85 |
| Diwali | 45.56 | 15.19 | 46.06 | 0.77 | 57.94 | 3.65 | |
| Post-Diwali | 19.17 | 8.71 | 31.98 | 0.75 | 75.46 | 3.08 |
Values in bold type: lower Diwali day air pollutant concentrations; NA: not available data.
Figure 3 shows the time series of air pollutant concentrations for the selected sites. A general remark is that, instead of subsiding after the Diwali festivities, pollution levels remained high from several days to about a month. In more detail, PM2.5 concentrations maxima are observed at the Ahmedabad site during the Diwali day (1056 µg m-3) and on November 14 and 23 (1183 and 883 µg m-3, respectively). High PM2.5 concentrations are also observed at the Faridabad, New Delhi and Jaipur sites from October 27 to mid-November. The PM2.5 pollution levels at the Vishakapatnam and Bangalore sites are considered normal with maximum values not exceeding 80 µg m-3 during the entire period of study. Regarding SO2 concentration levels, the maximum values are also reported at the Faridabad site prior and after the Diwali festival and at the New Delhi site from October 29-31. High levels of O3 concentrations are observed only at the Ahmedabad site from the Diwali day to November 22, while its maximum value (235 µg m-3) is observed on November 15. For the remaining sites, concentration levels were below the 100 µg m-3 permissible level during the majority of days. Maximum CO concentrations were observed at Jaipur (8.39 µg m-3) on the October 29, whereas high pollution levels were observed in New Delhi throughout the study period. Furthermore, high CO concentrations were reported on October 17 and 19 at the Kolkata site (6.24 and 8.06 µg m-3, respectively) from October 25 to November 23 at Ahmedabad, between October 17 to November 30 at Faridabad, and about November 15 at Lucknow. For the remaining sites (Chennai, Vishakapatnam and Bangalore), CO concentrations were below the 2 µg m-3 level. The NOx pollution levels exhibit significant differences between the New Delhi site and the remaining stations. Between October 15 to November 13, NOx values ranged from 302 to 773 µg m-3. High NOx concentrations were also observed on November 9 and between November 16 to 21 at Ahmedabad; in the Kolkata site, an increasing trend is observed after November 18. NOx concentrations were below the 80 µg m-3 level at the Jaipur, Chennai and Bangalore sites. Regarding C6H6 concentrations, the highest pollution levels were observed at the Ahmedabad site between October 18 and November 30, with a maximum value of 46 µg m-3. Days with higher than 100 µg m-3 were also observed at the Faridabad, Lucknow, New Delhi and Vishakapatnam sites, which may be attributed to emissions from vehicles and from coal combustion industries for power generation (Mahtta, 2015).
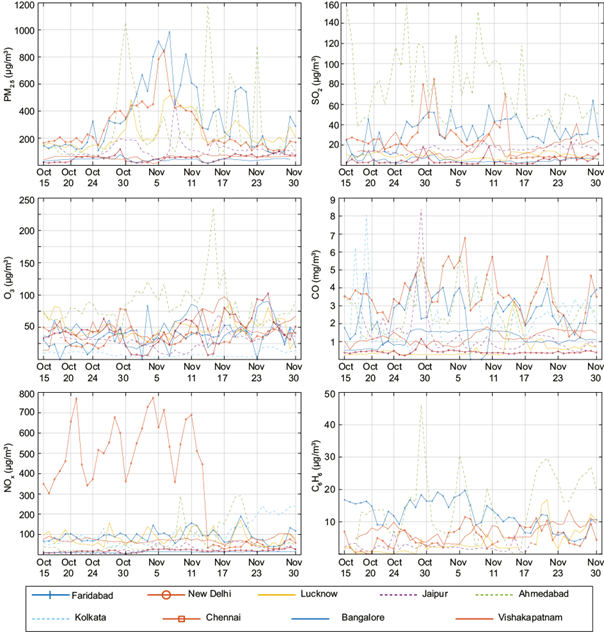
Fig. 3 Time series of air pollutant concentrations from October 15 to November 30, 2016 (pre-Diwali [October 24], Diwali [October 30] and post-Diwali [November 5]).
The above findings indicate that firework emissions during the Diwali festival are not the primary cause of pollution, but they might have added to already existing polluting sources. It should be noted that, compared to previous years, in 2016 fewer firecrackers were ignited due to a government ban on firecrackers to control noise and air pollution. There was no increase in sound levels, but the levels of atmospheric pollutants (CO, NOx, O3, C6H6, SO2 and PM2.5) increased significantly in the states of Haryana, Uttar Pradesh and Delhi (in northern India), and at Rajasthan and Gujarat (in western India).
Under this assumption, the effect of emissions from biomass burning is also examined. The fire events during October and November are evident in the EOSDIS Worldview images (Fig. 4). Intense active fires (marked with red dots) associated with the burning of agricultural crop residues over Punjab, Haryana, Uttar Pradesh and New Delhi in north India, as well as the scattered occurrence of fires over Rajasthan and Gujarat in west India, and West Bengal in east India are easily identified, validating the importance of biomass burning emissions. The AQI results are consistent with findings of the biomass burning fire events, highlighting their importance in the increased levels of pollution over specific areas of India. Other studies have also identified the effect of crop residues burning fires in north India during October and November (Mittal et al., 2009). This indicates that the high levels of CO, NOx, SO2 and particulate matter can also be attributed to the burning of agriculture crop residues, in addition to the Diwali festival and other local sources such as vehicle emissions, coal burning power generation, and dust emissions from construction activities.

Fig. 4 Intense active fires (marked with red dots) associated with the burning of agricultural crop residues over Punjab, Haryana, Uttar Pradesh and New Delhi in north India, as well as scattered occurrence of fires over Rajasthan, Gujarat in west India, and West Bengal in east India, during October-November 2016.
3.2. Meteorological conditions and long- range transport of air pollution
The synoptic conditions and the resulting surface wind field are considered the most important factor in the conditions for air pollution dispersion. The daily MSLP, along with the wind field over India are examined for the entire period of study and visualized in figure 5 during the Diwali festival and for two representative normal days prior and after the festival (a normal day is a day where pollutant concentrations have the same air pollution levels as the average of a 10-day period prior and after the Diwali day). As it can be observed, unfavorable dispersion conditions prevail over India during the Diwali festival, as a result of a smooth pressure field. Higher wind speed values are only observed at the southern part of the Indian peninsula with an easterly direction. During normal days, a low-pressure center is located at the Bengal Bay leading to better dispersion conditions at the southern and eastern parts of India, and to stagnation of pollutants and higher resulting pollution levels at the northern and eastern parts.

Fig. 5 Synoptic conditions and associated wind field in terms of MSLP, u and v wind components at 10 m over India during the Diwali festival (October 30, 2016), and before and after Diwali (October 24 and November 5, 2016, respectively).
Wind time series for the New Delhi, Jaipur, Ahmedabad, and Chennai sites are presented in figure 6. Figure 7 presents the NOAA HYSPLIT derived five-day back trajectories ending at the Indian cities of Faridabad, New Delhi, Lucknow, Jaipur, Ahmedabad, Kolkata and Vishakapatnam at three altitudes (0, 500 and 1000 m) at 12:00 UTC on October 27 and November 7, 2016. The back trajectories indicate transport from the north, north-west and west at Faridabad, New Delhi, Lucknow, Jaipur, Ahmedabad, Kolkata and Vishakapatnam during the study period at three altitudes. Low wind speed values are denoted for each experimental site. The above findings are also in accordance with the assumption that high pollution levels of AQI, CO, NOx, SO2 and PM over northern, western and eastern India may be attributed to the transport of polluted air associated with the burning of agriculture crop residues in the states of Punjab, Haryana and Uttar Pradesh. Badarinath et al. (2009a, b) also present similar findings. These authors state that aerosols/trace gases from regions where agriculture crop residues are burnt, are transported to the urban regions of Hyderabad and the Arabian Sea.
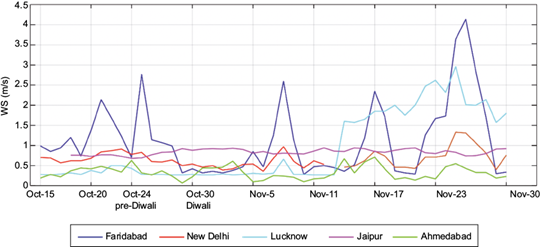
Fig. 6 Wind time series for New Delhi, Jaipur, Ahmedabad, and Chennai sites during the study period.

Fig. 7 NOAA HYSPLIT derived 5-day back trajectories ending at Indian cities Faridabad (Haryana), New Delhi and Lucknow (Uttar Pradesh), Jaipur (Rajasthan), Ahmedabad (Gujarat), Kolkata (West Bengal), and Vishakapatnam (Andhra Pradesh) at three altitudes (0, 500 and 1000 m) at 12:00 UTC on October 27 and November 7, 2016.
4. Conclusions
The predominant cause for the sudden degradation of ambient air quality in the year 2016 at Faridabad and Lucknow was biomass burning emissions in Uttar Pradesh, Punjab and Haryana. Long range transport of this polluted air led to the deterioration of air quality in Ahmedabad, New Delhi, Jaipur and Kolkata (with approximately 35 million inhabitants). Ignition of fireworks, emissions from vehicles, industries using coal for power and dust from construction activities have further added to the existing pollution. Low wind speed at Ahmedabad and New Delhi might have caused lower dispersive capacity in the atmosphere, leading to stagnation of these pollutants. Future work will be focused on numerical modeling for supporting the observational findings.

