1. Introduction
The south-central region of Chile (SCC; 37º-42º S) is characterized by a meridional transition from the Mediterranean climate to the north, to the west coast climate to the south, with a marked oceanic influence along its western part (Sarricolea et al., 2017). This area has been experiencing a persistent dry period (called “mega-drought”, MD) since 2010, with only few similar events in a millennial context (Garreaud et al., 2017). This extreme dry interval is framed within a severe multidecadal reduction in annual precipitation in SCC (Quintana and Aceituno, 2012; González-Reyes and Muñoz, 2013; Boisier et al., 2018), and marked streamflow reductions of the main rivers of the region (Muñoz et al., 2016; Fernández et al., 2018). One point to note is that the most important inter-annual climate mode for SCC climate is El Niño Southern Oscillation (ENSO), the leading large-scale mode inducing droughts in many regions of the globe (Schubert et al., 2016). ENSO has shown mainly neutral conditions during this MD extreme period, except for the winters of 2010 (La Niña) and 2015 (strong El Niño), which did not induce a departure from the dry conditions (Garreaud et al., 2017; Muñoz et al., 2020).
The year-to-year precipitation variability in SCC is related to the frequency of frontal systems arriving from the Pacific Ocean. Such frequency is, in turn, modulated by the interannual variability associated with ENSO, in particular by the dynamics of the Southeast Pacific Subtropical Anticyclone (SPSA) and blocking in the Amundsen-Bellingshausen sector (Aceituno, 1988; Montecinos and Aceituno, 2003). When El Niño (La Niña) events occur, a reduction (increase) of precipitation is expected in SSC during the ENSO peak in summer (Montecinos and Aceituno, 2003). Additionally, high latitude climatic forcing, such as that represented by the Southern Annular Mode (SAM)-also called Antarctic Oscillation (AAO)-has also been related to the seasonal precipitation variability and its reduction trend in SCC (Garreaud et al., 2009; Villalba et al., 2012; González-Reyes and Muñoz, 2013; Boisier et al., 2018). Previous hydroclimatic reconstructions using tree rings have shown decadal to multi-decadal features in the SCC hydroclimate. For instance, Muñoz et al. (2016) and Barria et al. (2018) identified significant and positive signals between streamflow variations of the Bio Bio River and the Pacific Decadal Oscillation (PDO) over the last-half millennia. In addition, Boisier et al. (2018) have shown that temporal precipitation variability in many regions of Chile (including SCC) responds to positive and negative PDO phases. However, climate variability modes of periods longer than those of the PDO and rooted in further Pacific regions (e.g., the tropics and New Zealand), such as those expressed by the Interdecadal Pacific Oscillation (IPO) and the Tripole Index (TPI, Henley et al., 2015), have not been explored for the SCC region yet. Recently, the IPO activity has been shown to be related to inter-annual precipitation variations in Chile, e.g., in the southern sub-region of the Mediterranean Andes (~ 34º-37º S), particularly since 1975 onwards (González-Reyes et al., 2017).
Historical precipitation measurements present a high relevance to explore the temporal behavior of dry and wet seasonal extreme events (SEE) in a long-term context. In addition, understanding the temporal variations of SEE in annual, decadal, and multi-decadal contexts is also highly useful, because such variability delivers a broad temporal view of phenomena that could be associated with natural and/or anthropogenic climate forcing. Although several articles have assessed changes in precipitation in SCC (e.g., Quintana and Aceituno, 2012; González-Reyes and Muñoz, 2013; Boisier et al., 2018), they have not attempted a robust evaluation of return periods of wet and dry SEE. A fundamental climate change manifestation in meteorological variables such as precipitation is its alteration at multiple time scales (e.g., from seasonal to multi-decadal) and also spatial scales (e.g., from local to global). In this sense, understanding changes in seasonal precipitation in regions such as SCC is relevant due to a broad diversity of socio-ecological implications. In particular, SCC concentrates more than 55% of agro-industrial activities (CDEC-SIC, 2011; INE, 2019). Concerning power generation, over 50 hydroelectric complexes supplying more than 70% of the hydroelectric power to the Chilean electric grid (SIC) are located within SCC. Within this framework, the specific goals of this study are: i) to determine the return periods of dry and wet SEE in SCC for 1900-2019, and ii) to evaluate the relationship between seasonal precipitation variability in SCC and large-scale climatic mechanisms.
2. Data and methodology
The study area is located in Chile, along the southwestern coast of South America, between 37º and 42º S (Fig. 1). Precipitation concentrates during austral winter months (July to August, JJA), with an increasing gradient southward.
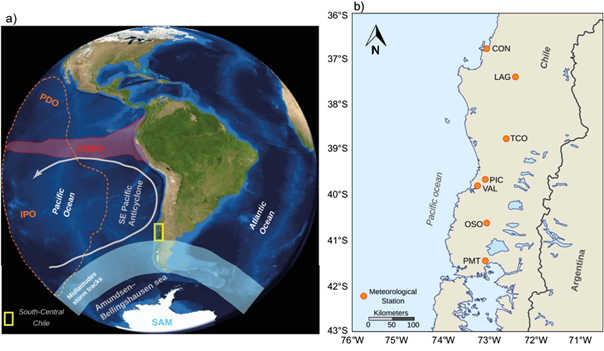
Fig. 1 (a) Spatial representation of the main large-scale climate modes that affect precipitation variability over south central Chile (SCC). ENSO refers to El Niño Southern Oscillation, PDO to Pacific Decadal Oscillation, IPO to Interdecadal Pacific Oscillation, and SAM to Southern Annular Mode or Antarctic Oscillation (AAO). (b) Location of the seven meteorological stations used in this study. All meteorological stations are managed by Dirección Meteorológica de Chile (DMC). More details of each station are summarized in Table I.
In order to study the seasonal variations of precipitation in SCC, we analyze precipitation measurements from seven meteorological stations located in the cities of Concepción, Los Ángeles, Temuco, Valdivia, Osorno, and Puerto Montt. All of them are managed by the Chilean Meteorological Directorate (DMC, Fig. 1). Together, these stations cover the period 1900-2019 (Table I). Based on the significant inter-station Pearson correlation coefficients obtained for the interannual scale for 1961-1990 (r range between 0.6 and 0.87; critical r = ± 0.55; P < 0.001), we grouped the seven precipitation records to generate 12 monthly and four seasonal regional SCC time series. A similar clustering of precipitation records was used by Montecinos and Aceituno (2003) based on PCA. The precipitation records used present low levels of missing values (0 to 3.7%, see Table I), which is why these records were not previously gap-filled.Moreover, although these records comprise different measurement periods, the high inter-station Pearson correlation coefficients (0.6 to 0.87) indicate that the variance of the regional SCC series should not present significant variations (Osborn et al., 1997). This point supports the methodology for the proper estimation of extreme events. To form the seasons, summer was considered as December of the previous year, and January and February of the assigned year (e.g., December 1901 plus January and February 1902 were used to construct the 1902 summer precipitation); autumn was considered from March to May (MAM), winter from June to August (JJA), and spring from September to November (SON). By construction, only summer covers the period 1901-2019; the rest of the seasons cover 1900-2019. Because of the differences between the average amounts of precipitation between individual records (Table I), each month of each station was standardized with respect to its monthly average during 1961-1990, which was assigned 100%. In this way, four seasonal series were extracted for each station and, subsequently, a seasonal mean was calculated with respect to the value obtained (in percentage) for each station.
Table I List of the meteorological stations used in this study.*
| Code | Station name (latitude; longitude) | Start year/ end year (% missing) | Total annual precipitation (1961-2000) (mm) | Altitude (m) |
| CON | Concepción, Carriel Sur (36.78 S; 73.05 W) | 1900/ 2019(0) | 1100 | 12 |
| LAG | María Dolores, Los Ángeles (37.40 S; 72.42 W) | 1918/ 2019(3.2) | 1059 | 120 |
| TCO | Temuco, Maquehue (38.76 S; 72.62 W) | 1950/ 2019(2.4) | 1135 | 86 |
| PIC | Valdivia, Pichoy (39.65 S; 73.08 W ) | 1958/ 2019(1.5) | 2287 | 18 |
| VAL | Valdivia, Isla Teja (39.79S; 73.25W) | 1900/ 2005(0) | 1823 | 15 |
| OSO | Cañal Bajo (40.61 S; 73.05 W) | 1960/ 2019(0.3) | 1318 | 61 |
| PMT | Puerto Montt, El Tepual (41.44 S; 73.08 W) | 1900/ 2019(3.7) | 1739 | 87 |
*The Valdivia Isla Teja precipitation record (VAL) has been compiled and managed by Universidad Austral de Chile. The rest of stations are managed by Dirección Meteorológica de Chile (DMC). Latitude and longitude are expressed in decimal degrees.
To evaluate the return period of dry and wet SEE, we used values less than the 20th percentile (< P20; dry seasons) and values greater than the 80th percentile (> P80; wet seasons), where P20 and P80 were calculated from each seasonal precipitation time series. For the estimation of the return periods of dry and wet SEE, we used a kernel estimation technique with a Gaussian function and 15-year bandwidth. The kernel-based estimation allows for the detection of nonlinear and non-monotonic trends without imposing parametric restrictions. A smooth kernel function produces a more realistic estimation of extreme events such as droughts and wet spells. We calculated a confidence interval at P < 0.05 based on 2000 bootstrap resampling steps to estimate bias and variance properties (Cowling et al., 1996). We computed the kernel estimation and bootstrap algorithm in the free R Project platform software (R Core Team, 2020).
To evaluate potential relationships between seasonal precipitation and large-scale climate modes that affect the SCC region, we considered two climatic indexes that represent the decadal variability related to the Pacific basin and the high latitudes, respectively. For the former, we used the TPI proposed by Henley et al. (2015), which is based on the difference between SST over the central equatorial Pacific and the average of SST in the Northwest and Southwest Pacific. We used the unfiltered monthly TPI index based on the ERSST V4 data set (Huang et al., 2014). For the latter, we explore possible relationships between SEE in SCC and the SAM. We used the SAM index calculated by Visbeck (2009), available from 1860 onwards. SAM consists of a barotropic meridional pressure dipole between latitude circles centered at 45º and 60º S, and represents the first mode of extra-tropical climate variability in a wide range of time scales in the southern hemisphere (Thompson et al., 2000; Marshall, 2003). For this exploration, we correlate our seasonal precipitation time series with two gridded products: geopotential height at 500 hPa from NCEP-NCAR (Kalnay et al., 1996; Z500, 2º × 2º horizontal resolution) for 1948-2019, and monthly SST (ERSST V4; 2º × 2º horizontal resolution; Huang et al., 2014) for 1900-2019. Additionally, in order to detect possible non-linear relationships between SEE events and their climate forcings, we calculated Z500 and SST composite maps for the wettest (> P80) and driest (< P10) subsets from each season. Finally, we explore the existence of common and significant cycles between seasonal precipitation and the climate modes using a multi-taper spectrum estimator, implemented in the R PowerSpectrum package.
3. Results
The regional long-term instrumental precipitation record from SCC allows us to analyze the return periods of dry and wet SEE for each season during 1900-2019. For summer, we identify a return period (RP) reduction for wet SEE, specifically from ~ 7 to ~ 4 years during 1920-1950, followed by an increase up to of ~ 20 years from 1950 to the present (Fig. 2a). Conversely, summer dry SEE exhibits a sustained RP reduction during the whole period, from ~ 15 years around 1900 to ~ 3 years in 2019. For autumn (Fig. 2b), wet SEE exhibits a notable RP increase during the first 50 years of the 20th century, from ~ 2.5 years in 1900 to ~ 7.5 years around 1950. After this, a less pronounced increase reaches ~ 20 years in recent decades. The RP of autumn dry SEE shows an approximately steady value of 7.5 years during 1900-1910, with an increase around 1940 and a subsequent sustained reduction towards the present, reaching values of ~ 3 years in 2019 (Fig. 2b). For winter (Fig. 2c), wet SEE exhibits an RP increase from 1900-1950, from 3 years in the early 1900s to ~ 5 years around 1950. During the second half of the 20th century until today, this season shows an RP increase for wet SEE. A different pattern was observed for the RP of winter dry SEE, for which a sustained reduction has been observed from 1900 to date, decreasing from ~ 8 years at the beginning of the 20th century to ~ 3 years. For spring (Fig. 2d), the RP of wet SEE shows values of ~ 4 years during 1900-1930, followed by a marked increase towards the present, with values of ~ 15 years in 2019. Contrastingly, the dry SEE shows a quite stable RP (~ 7 years) during 1900-1950, which decreases slowly towards the present. In addition, we identified a notorious RP reduction of dry SEE since 1950 followed a constant value from 1990 onwards, reaching values of ~ 4 years in 2019.
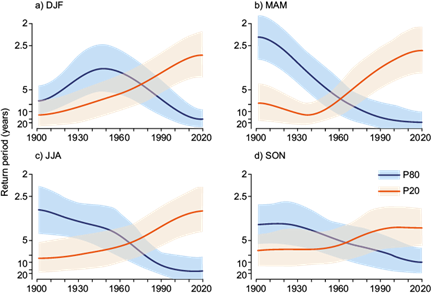
Fig. 2 Return period of dry (orange) and wet (light blue) precipitation extreme events on a seasonal scale: (a) summer, (b) autumn, (c) winter, and (d) spring. Dry/wet events have been obtained using values lower than the 20th and greater than the 80th percentiles. Note the orientation of the y axis, which represents the return period in years of these events. In all panels, shaded bands represent the confidence limit (P < 0.05) obtained for each of the kernel functions. These values were obtained through 2000 bootstrap simulations.
On the one hand, we identified significant relationships between the SCC seasonal precipitation time series and large-scale climate modes, in particular SAM for the high latitudes, and the TPI, which accounts for SST multidecadal variations in the Pacific basin. For summer (Fig. 3a), we identified that precipitation presents a significant negative relationship with synchronous SAM during 1901-2011 (r = -0.33, P < 0.001). For this relationship, we identified common and significant periodicities of ~ 6 and 11 years (P < 0.10). The relationship between both series increases in terms of Pearson correlation when using a cubic spline filter of 11 years (r = -0.59, P < 0.001). For autumn (Fig. 3b), a significant negative relationship is obtained when using February to May SAM activity (e.g., SAM leading SCC precipitation by one month) for 1900-2011 (r = -0.45, P < 0.001), with significant periodicities of ~ 6, 8, 11 and ~ 15 years, and a stronger Pearson correlation when a cubic spline filter of 11 years is applied (r = -0.62, P < 0.001). In the case of winter precipitation (Fig. 3c), a significant relationship is found with the synchronous TPI during 1900-2019 (r = 0.30, P < 0.001), with common and significant periodicities of ~ 6, 9 and 13 years (P < 0.10). During spring (Fig. 3d), we identified a significant relationship between the precipitation variability and the concurrent TPI (r = 0.45, P < 0.001), with common and significant periodicities of ~ 6, 14, 17 and 32 years (P < 0.10). We did not identify significant correlations between the summer and autumn precipitation time series and the TPI during 1900-2019.
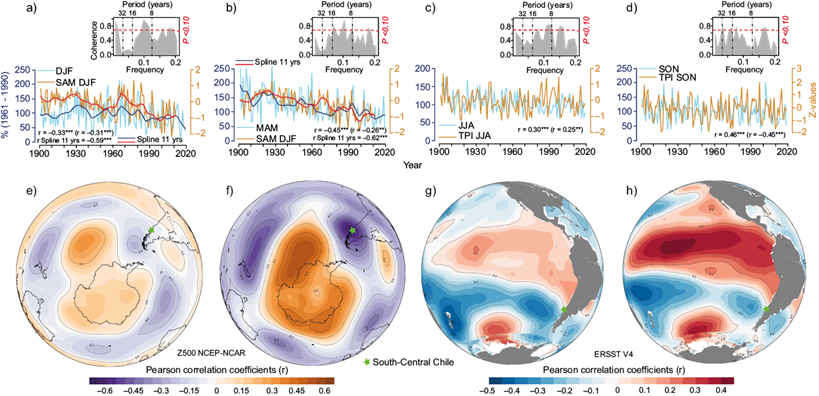
Fig. 3 Time series of: (a) summer precipitation and synchronous Southern Annular Mode (SAM) index from Visbeck (2009) for 1901-2011, and (b) autumn precipitation and February to May SAM index for 1900-2011. Interannual Pearson correlation coefficients are shown, with values after a linear regression detrending shown in parenthesis. An 11-yr cubic spline filter is also shown to highlight decadal relationships between seasonal precipitation and SAM, along with their corresponding Pearson correlation coefficient. In both panels, the SAM index has been inverted to facilitate comparison with summer and autumn precipitation. (c, d) Time series of winter and spring precipitation and the unfiltered tripole index (TPI) from Henley et al. (2015) based on ERSST V4, as an indicator of interdecadal SST variability in the Pacific Ocean. In each panel, a spectral coherence between the respective time series is shown to exhibit common and significant signals at P < 0.10. Significance levels: *P < 0.05, **P < 0.01, ***P < 0.001. Lower panels represent the correlation fields between summer and autumn precipitation and 500 hPa geopotential height (Z500) using (e) DJF Z500 and (f) February to May Z500. Correlations were computed for 1949-2019 and 1948-2019, respectively. Critical Pearson r coefficients are significant at P < 0.05 with r = ± 0.23. (f, g) Synchronous correlation fields between winter and spring precipitation and ERSST V4 for 1900-2019. Critical Pearson r coefficients are significant at P < 0.05 with r = ± 0.18. The green star over the lower panels indicates the South-Central Chile (SCC) region.
On the other hand, the spatial correlation field using Z500 exhibits significant relationships with summer and autumn precipitation variability. Summer precipitation shows significant correlations with synchronous Z500 mostly over the Amundsen-Bellingshausen Sea (ABS) (Fig 3e; critical r = ± 0.23; P < 0.05). In contrast, high correlations are found with Z500 for autumn, when this field leads by one month (February to May). Correlations are mostly positive and significant over Antarctica and ABS, while over SCC, southern South America, and eastward from New Zealand, correlation coefficients are significant but negative (Fig. 3f; critical r = ± 0.23; P < 0.05). In the case of winter precipitation, we find significant positive correlation coefficients with SST over ABS and the El Niño 3.4 region on the Equatorial Pacific for 1900-2019 (Fig. 3g; critical r = ± 0.18; P < 0.05). In addition, significant negative correlation values are mostly identified around New Zealand. During spring, our precipitation time series shows stronger correlation values compared with winter, with significant positive values over ABS and Equatorial and North Pacific (Fig. 3h; critical r = ± 0.18; P < 0.05). Furthermore, significant negative correlation values are obtained in the Pacific Ocean north of New Zealand. Besides, significant correlations were obtained between precipitation and Z500 from NCEP-NCAR during the period 1948-2019 for winter and spring (Fig. S1 in the supplementary material), although not between precipitation and the SAM index from Visbeck (2009) for the longer 1900-2011 period. Specifically, a spatial structure similar to the one obtained for autumn was found, i.e., negative coefficients in mid-latitudes and positive values in high latitudes, in particular over the ABS. In turn, the correlation map obtained between precipitation and SST exhibits lower values for summer and autumn than for spring within 1900-2019 (see Fig. 3h). For autumn, significant negative correlation coefficients are found north of New Zealand (Fig. S1).
4. Discussion
Due to the long and complete precipitation records along the SCC region, we have been able to analyze the seasonal precipitation variability during 1900-2019 in this temperate ecoregion of South America. Our results exhibit an RP reduction of dry SEE for all seasons towards the present, especially after 1950. We identified that SAM plays a relevant role on the SCC precipitation variability during summer and, in particular, autumn (Fig. 3a, b). Indeed, a significant relationship between precipitation and SAM for autumn was identified by González-Reyes and Muñoz (2013) using the historical precipitation record of Valdivia that starts in 1853. However, to our best knowledge, neither the decadal linkage with SAM described in this study, nor the significant spatial correlations over the ABS had been previously reported. Similarly, the significant relationships for summer and autumn between precipitation and the synchronous SAM activity are novel contributions. However, the wide spatial range of this climatic relationship was also identified by, e.g., Holz et al. (2017) by assessing the climatic control of forest fires in Chile and Argentina within 37º-54º S, thus confirming the strong influence on dry and warm conditions and consquently on climate risk in southern South America.
We suggest also that the current positive decadal trend of SAM observed in some months, as reported in several studies (e.g., Villalba et al., 2012; Eyring et al., 2013; Gillett et al., 2013; Abram et al., 2014), has caused the reduction in RP of dry SEE in SCC towards the present, particularly for summer and autumn. The positive SAM trend has been attributed to stratospheric ozone depletion and increased greenhouse gases concentration (Eyring et al., 2013; Gillett et al., 2013). Our results show a dipole in the Z500 correlation field, with strongest values for autumn (Fig. 3e). This points to variability in the mid- to high-latitudes circulation of the southeastern Pacific Ocean, where an anomalous equatorward (poleward) gradient of Z500 values induces a southward (northward) migration of the westerly storm track, hence resulting in anomalously dry (wet) conditions over SCC (Gillett et al., 2006; Garreaud et al., 2009). In fact, our results show more recurrent dry conditions along SCC for autumn. Moreover, winter and spring modes of precipitation variability within SCC show teleconnections with SST patterns from different regions along the Pacific and the southern oceans (ABS). In addition, we identify a marked teleconnection (negative correlation values) between winter and spring precipitation and the SST around New Zealand. Explaining the dynamics of the current MD in Chile, a recent work by Garreaud et al. (2020) has shown a similar teleconnection with SST around New Zealand at the interannual scale. Furthermore, our work supports previous studies that have shown the relationship between precipitation in SCC and SST within the tropical Pacific (Aceituno, 1988; Montecinos and Aceituno, 2003; Garreaud et al., 2009; Quintana and Aceituno, 2012).
Additionally, composite maps of Z500 and SST anomalies with respect to the 1981-2010 period, based on the wettest (> P80) and driest (< P10) SEE years, show a clear spatial structure. On the one hand, for the wettest summer events, we identified positive Z500 anomalies in high latitudes (e.g., Antarctica and ABS), and negative values in the mid-latitudes (e.g., SCC, Fig. 4a). For the wettest autumn SEE (February to May), a similar but more intense pattern as in summer is recognized on Z500 (Fig. 4b). In the case of the wettest winter SEE, positive SST anomalies are observed in high latitudes (e.g., ABS), while negative values are obtained across the equatorial Pacific and east of New Zealand (Fig. 4c). For the spring wettest events, their SST composite exhibits positive anomalies along the equatorial Pacific (e.g., Niño 3.4 region) and high latitudes (e.g., ABS), while negative SST values are particularly identified north of New Zealand (Fig. 4d). On the other hand, the driest SEE exhibits positive Z500 composite anomalies on the Southern Ocean during summer, while negative anomalies are identified on high latitudes (such as Antarctica and ABS) and mid-latitudes (e.g, SCC, Fig. 4e). The autumn (February to May) driest SEE exhibits negative Z500 anomalies on high latitudes (e.g., ABS), while it displays positive anomalies over New Zealand and the southern portion of South America (Fig. 4f). The composite of driest winter SEE shows positive SST anomalies to the south and north of New Zealand, and also on the Chilean Pacific coast; by contrast, negative SST values are identified along the equatorial Pacific (Fig. 4g). For the driest spring events, the composite of SST anomalies exhibits strong negative SST values along the equatorial Pacific, while positive anomalies are particularly observed to the north of New Zealand (Fig. 4h).
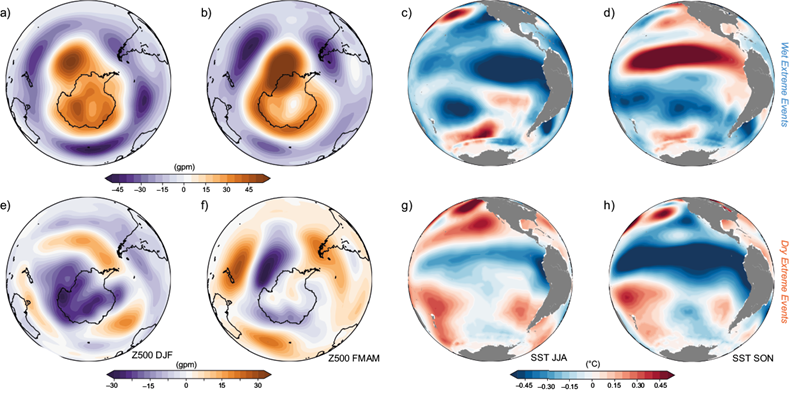
Fig. 4 Composite maps of Z500 and SST anomalies showing the mean conditions for (upper row) the wettest (> P80) and (lower row) the driest (< P10) SSE years, defined with respect to the 1981-2010 period. (a, b) Z500 composites for the wettest summers (1949, 1953, 1955, 1956, 1961, 1965, 1967, 1971, 1980, 1981, 1982, 1992 and 2000) and autumns (February to May; 1949, 1950, 1956, 1959, 1980, 1993, and 2002), respectively. (c, d) SST composites for the wettest winters (1950, 1951, 1953, 1954, 1961, 1963, 1965, 1969, 2000, and 2006) and springs (1950, 1963, 1965, 1972, 1977, 1978, 1986, 1997, 2002, and 2003), respectively. (e, f) Analog to (a) and (b), respectively, but for the opposite conditions: the driest summers (1957, 1962, 1979, 1987, 1998, 2008, 2015, 2016, and 2019), and driest autumns (1976, 1978, 1989, 1998, 2000, 2003, 2010, 2012, 2015, and 2019). (g, h) SST composite of anomalies for the driest winters (1968, 1981, 1985, 1990, 1996, 1998, 2013, 2016, and 2018) and the driest summers (1949, 1955, 1981, 1988, 1989, 1998, 2008, 2012, and 2019), respectively.
As a novel contribution, we present evidence that variations at the interdecadal scale within different regions of the Pacific, as quantified by the TPI index, correlate well with the RP reduction of dry SEE in SCC for winter and spring. This process also supports the intensification of the Southeast Pacific subtropical anticyclone, particularly in winter (Garreaud et al., 2020). The seasonal control of tropical and extra-tropical climate modes over the SCC precipitation variability was also found by Barria et al. (2018), comparing streamflow reconstructions from tree-rings in the Bio Bio River basin. In the same basin, Muñoz et al. (2016) found interannual and interdecadal signals of ENSO and SAM analyzing an annual streamflow reconstruction of the Bio Bio River. Both in that work and also in the study by Fernández et al. (2018), the extremely low flows of the Maule (36º-37º S), Bio Bio (37º-38º S), Imperial (39º S) and Puelo (42º-43º S) rivers showed an increase in their frequency and a consequent shortening of their RP down to one to two consecutive years. Also, Muñoz et al. (2016) proposed a strengthening in the SAM signal towards the south, which was also demonstrated in the annual Baker streamflow reconstruction (~48º S) developed by Lara et al. (2015), which showed a strong SAM signal.
Some of these findings open new questions about the future evolution of SEE and the complexity associated with their attribution to anthropic and natural causes. This type of information is key to informing climate change policies and adaptation actions (IPCC, 2014). The science of climate extreme events in the context of the current climate change scenario becomes more relevant for Chile, a country classified among the most vulnerable to climate change (NDC, 2015; MMA, 2017), especially due to the drought projected for this South American region (Bozkurt et al., 2018). Although the projected drier-than-normal conditions for Chile are very consistent (Boisier et al., 2018; Garreaud et al., 2020), a comprehensive understanding of the long-term evolution of wet SEE has direct effects on public infrastructure planning, since its design usually relies on risk assessments calculated from flood return periods.
Future research should focus on the interaction of decadal to synoptic anomalous conditions leading to SEE, in order to: 1) identify precursors, define thresholds, and generate early alarms of weather and climate extremes to protect the population and socio-ecological structures, and 2) contribute to adaptation strategies under climate change.
5. Conclusions
Our findings indicate that wet SEE in SCC showed a year-round reduction in their seasonal return periods during the first half of the 20th century, followed by an accelerated decrease until the present. Such virtual absence of wet SEE could be imposing new conditions for the ecosystems and the socio-hydrological frameworks used for risk aversion and planning. In the case of dry SEE, we found a marked reduction in their return periods for summer and winter since 1900, and since 1930 for autumn. For spring, a reduction has been observed since 1950, although a constant return period has been recorded from 1990 onwards. The increase of dry SEE is possibly the clearest signal of climate change recorded by this study, supporting the growing research evidence of drought occurrence in Chile and its impacts.
These SEE changes are apparently driven by distinct extra-tropical and tropical climate modes, respectively. We confirm that SAM is a main climate mode related to the precipitation variability in south-central Chile, especially for autumn. Furthermore, this relationship holds for summer and autumn both at interannual and decadal scales during the 20th century and the first decade of the 21st century. Besides, the winter and spring precipitation variability in south-central Chile presents significant linkages with SSTs of multiple regions throughout the Pacific basin (including the tropics and New Zealand) and the Southern Ocean (ABS), as quantified by the strong relationship with the TPI. These results provide new evidence on the relationship between climate variability rooted in the Pacific ocean and high latitudes, respectively, and changes in the seasonal precipitation regimes in south-central Chile and north Patagonia.
The changes and trends of the seasonal and annual extreme events, especially drought, combined with the climate projections for this region of Chile, which indicate a drier future under different climate change scenarios, reinforce the importance of developing and implementing climate change adaptation actions in Chile to reduce climate risk in the future.
Supplementary Material
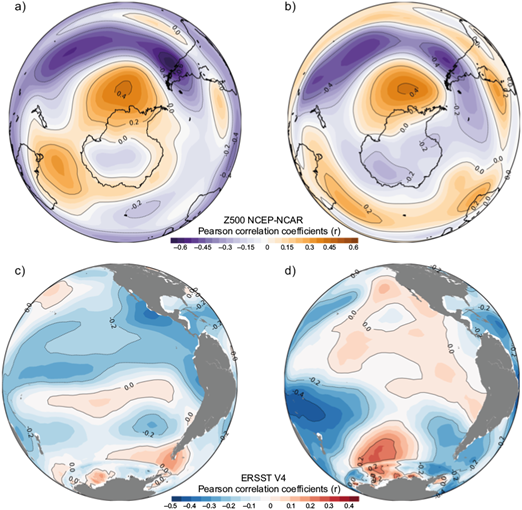
Fig. S1 Correlation fields between winter and spring precipitation and 500 hPa geopotential height (Z500) using (a) June to August Z500, and (b) September to December Z500. Correlations were computed for 1949-2019. Critical Pearson r coefficients are significant at P < 0.05 with r = ± 0.23. (c, d) Synchronous correlation fields between summer and autumn precipitation and ERSST V4 for 1901-2019 and 1900-2019, respectively. Critical Pearson r coefficients are significant at P < 0.05 with r = ± 0.18.


 nueva página del texto (beta)


