1. Introduction
Atmospheric aerosol is an essential component that strongly influences the Earth’s weather conditions and surface climate. These particles vary spatially and temporally worldwide and originate from natural sources such as sea salt (SS), mineral dust (MD) and volcano smoke, and anthropogenic sources like dust from land-use activities, biomass burning and fossil fuel combustion smoke (Boucher, 2015). Aerosols have direct, indirect and semi-direct effects on the Earth’s radiation budget through scattering, absorption of solar radiation, and the formation of cloud condensation nuclei (CCN) and ice nuclei (IC) in the process of cloud formation (Twomey, 1974; Albrecht, 1989; Ackerman et al., 2000). Depending on time, space, and type, the particles also exhibit varying optical characteristics (Falaiye et al., 2013), which include their ability to go through different processes such as coagulation, humidification, precipitation, and gas-to-particle phase conversion (Smirnov et al., 2002) in accordance to their lifespan.
Smoke from both natural and anthropogenic activities such as biomass burning and fossil fuel combustion is one of the most important sources of air pollution, hence, quantifying its effect on the energy budget constitutes a significant uncertainty (IPCC, 2014). Since smoke emissions from different sources differ in properties, they have different effects; for example, smoke from biomass burning is rich in light-absorbing aerosol like black carbon (BC), which increases warming, while scattering by organic carbon (OC) enhances a cooling effect. Besides, the inability to quantify the amount of smoke attributable to natural or anthropogenic origin makes its understanding ambiguous (Reid et al., 2005; IPCC, 2014; Hodnebrog et al., 2016).
Smoke aerosol, especially from biomass burning, is observed to possess a negative impact on climate by altering the precipitation pattern (Khain et al., 2005; Ban-Weiss et al., 2011; Thornhill, 2018). Through warming of the upper cloud by absorbing aerosol and cooling at the surface, biomass-burning aerosol reduces atmospheric instability and convective cloud formation, thereby suppressing precipitation (Feingold et al., 2005; Kolusu et al., 2015). This property is well observed in studies carried out in different regions of the world, such as the influence of boreal fire on precipitation drop in Canada and East China (Smirnov et al., 2002; Huang et al., 2016). On the other hand, in the global estimation Africa is a substantial source of biomass burning aerosol compared to other continents, as a result of incessant biomass burning during land-use activities such as agriculture, animal hunting and land clearing (Hao and Liu, 1994; Sinha et al., 2004; Haywood et al., 2008). Specifically Southern Africa is recognized as the highest single source of biomass burning region in the world (Giglio et al., 2006; Eck et al., 2013).
Biomass burning from forest fires (often called veld fires) or bush-burning activities for land use, constitutes a common phenomenon in the Western Cape region, particularly during the summer-autumn period (December-May). This event is one of the leading causes of air pollution and accounts for substantial yearly economic losses in the area. Previous studies have shown that biomass burning can affect the weather and surface climate within a shorter timeframe (Rosenfeld, 1999; Giglio et al., 2006) and may become a threat to coral reefs (Abram et al., 2003), thereby altering the carbon cycle. Apart from biomass burning, another atmospheric phenomenon that induces air pollution in the region is smog, which results mainly from the emission of fossil combustion within the region and also from its transport from the northern part of Southern Africa (Wicking-Baird et al., 1997; Abiodun et al., 2014). Both biomass burning and smog events are known to have different consequences on humans, such as reduced visibility and health hazards, but the relationship between them is not well understood. Therefore, such events deserve substantial investigation towards a comprehensive assessment of the risk factors and the general information of its effects on health and the environment.
Generally, ground-based remote sensing using a sun photometer provides aerosol optical depth (AOD) measurements with high accuracy (Eck et al., 1999, 2013; Holben et al., 2001), and satellite sensors such as radar and lidar offer more features on aerosol profiles (Kaufman et al., 1998). Also, satellite observations provide more spatiotemporal coverage of aerosol measurements to enhance regional and global aerosol studies. Hence, the combination of both techniques is commonly used to study aerosol properties and has yielded good results.
This study intends to use data from the Aerosol Robotic Network (AERONET) and the Moderate Resolution Imaging Spectroradiometer (MODIS) onboard the Aqua and Terra satellites to investigate the physical properties of atmospheric aerosol over Cape Town. The relationships between AOD, the Ångström exponent (AE) and water vapor content (WVC), and also between particle size distribution, single scattering albedo (SSA) and refractive index, will be examined. The we address the effects of local biomass burning on AOD and black carbon (BC) concentration.
2. Data and methods
2.1. Ground remote sensing data
AERONET is an automatic ground-based remote sensing network of Cimel sun photometers established in collaboration by NASA and LOA-PHOTONS. The Cimel radiometers measure direct solar radiation and sky radiance to provide information on the global distribution of aerosols (Dubovik and King, 2000). AERONET operates within the spectral bands of 340-1020 nm (340, 380, 440, 500, 675, 870, 940, and 1020 nm) and provides AOD measurements at a nominal uncertainty of ~ ±0.01-0.02 (Eck et al., 1999, 2013; Formenti et al., 2002). AOD retrieved from AERONET measurements involves seven of the eight bands, while the eighth band shows the estimation of precipitable water (940 nm). Also, sky brightness measurements from the spectral bands 440, 500, 675, and 1020 nm provide additional aerosol properties such as single scattering albedo (SSA), refractive indices and volume size distribution (Holben et al., 1998). Apart from columnar water vapor content (WVC) or precipitable water, AOD at two different wavelengths can be used to estimate aerosol size using the AE parameter relationship α = -dlnτ/dlnλ for comprehensive information on atmospheric aerosol activities globally, since the sensitivity of particle extinction to the wavelength increases with decreasing particle size (Holben et al., 1998; Tesfaye et al., 2011).
Besides AE, which only provides size information, AERONET produces parameters such as fine (τ f ) and coarse (τ c ) AOD modes that provide further details about aerosol size and quantity in terms of total AOD from the spectral deconvolution algorithm (SDA). This algorithm, developed by O’Neill et al. (2001, 2003), uses the spectral characteristics of total aerosol optical depth to infer τ f and τ c . Having recognized that aerosol particle size distribution (PSD) is effectively bimodal, SDA uses AOD spectra to separate aerosol particles into fine and coarse modes based on their composition in the atmosphere. The algorithm depends on the polynomial fit to three or more wavelengths of the first and second derivative of total AOD.
The retrieval of SSA, refractive index, and volume size distribution over a range of 0.05-15 µm from the spectral sun and sky radiance measurements follow the flexible inversion algorithm developed by Dubovik and King (2000). The inversion function involves a search for the best fit of all input data based on a theoretical model that considers the different levels of accuracy of the fitted data. With an initial guess: dV/dlnR = 0.0001, n(λ i ) = 1.50, and k(λ i ) = 0.005, where dV/dlnR is the volume size distribution, n(λ i ) and k(λ i ) are respectively the real and imaginary part of the refractive index, and λ i is the wavelength, additional aerosol properties were retrieved using the algorithm. Dubovik and King (2000) demonstrated a more effective method for retrieving the optical properties of the total atmospheric column, which modeled aerosol particles as polydisperse homogeneous spheres. They further show that the size distribution of non-spherical aerosols is practically retrievable when the sky radiances angular range is limited to scattering angles < 30º-40º (Smirnov et al., 2002). Nevertheless, the sky radiance acquired in the entire almucantar is required in addition to the direct sun measurements to retrieve the SSA.
Also, the particle size distribution of aerosols is associated with several distinct modes and each mode is defined by a lognormal function (Whitby, 1978; Remer et al., 1998; Dubovik and King, 2000) as
where dV⁄dlnR is the volume distribution, R is the particle radius, C v is the volume concentration, R v is the volume geometric mean radius, and σ is the geometric standard deviation. Here, values of R < 0.6 are assigned to fine mode, and R > 0.6 are deemed as coarse mode following Dubovik and King (2000) and Smirnov et al. (2002).
AERONET provides three quality levels of data (1.0, 1.5, and 2.0). For this study, standard data including AOD, AE, WVC, fine (τ f ) and coarse (τ c ) AOD at a 1.5 level were extracted from the AERONET data archive then analyzed to obtain the results presented in this work. Evaluation of parameter AOD (τ) is at a reference wavelength of 500 nm, AE (α) at 440-870 nm, and WVC at 940 nm.
2.2. Satellite remote sensing data
The MODIS instrument onboard the Aqua and Terra satellites is equipped with high radiometric sensitivity. It overpasses the earth every 1-2 days viewing the entire surface and acquires data at 36-spectral bands to provide useful information about events on the land, ocean and the lower atmosphere (Kaufman et al., 1998). This instrument captures events at each band at a spatial resolution of 250, 500, and 1000 m to provide different levels of aerosol and cloud products over the Earth’s surface. MOD IS also detects fire and thermal anomalies at various spatial resolutions, such that it captures daytime (at visible wavelength) and nighttime (at infrared wavelength) near real-time images of active fire, including activities of smoke and thermal anomalies across the globe (Morisette et al., 2005; Giglio et al., 2016). The application of a fire detection algorithm to MODIS active fire data offers the possibility to retrieve datasets including corrected fire pixels (CFP) and fire radiative power (FRP). The algorithm employs the swath 4, 11, and 12 µm brightness temperatures (T4, T11 and T12) derived from the 1-km MODIS channels for daytime and nighttime to identify fire pixels containing one or more actively burning fires at satellite overpass. Besides the brightness temperatures, support of the reflectance (ρ 0.65 , ρ 0.86 and ρ 2.1 ) at 0.65, 0.86 and 2.1 µm are only required for daytime. The fire detection algorithm process involves the conceptual scanning through MODIS swath pixels and their classification as either missing data, cloud, water, non-fire, fire or unknown, to eliminate non-fire pixels. A further threshold test is performed by looking up to certain conditions defined by T4 - T12 (for both daytime and nighttime), with the addition of ρ 0.65 - ρ 2.1 in the case of daytime, to distinguish false alarms from real fire events. The raw fire pixel data is retrieved at this point to provide CFP. Subsequently, FRP is retrieved using the approximation of Wooster et al. (2003), given by
where L 4 is the 4 µm radiance of the fire pixel, L̅ the 4 µm background radiance, A pix the area of the MODIS pixel that varies with the scan angle, σ (5.6704 × 10⁻⁹ Wm-2K-4) the Stefan-Boltzmann constant, τ 4 the atmospheric transmittance of the 4 µm channel, and a the sensor specific empirical constant (Giglio et al., 2016; Wooster et al., 2003).
This study used CFP and FRP representing fire or thermal anomalies at a 250 m resolution from the level-3 MODIS active fire products MOD14CMQ and MYD14CMQ through the combined Aqua-Terra satellite measurements. In addition, data including AOD (550 nm) deep-blue land only, AE (470-660nm), and WVC acquired from the MOD08-M3 level-3 product was employed for other results presented.
2.3 Site
Cape Town (33º 29’-34º 23’ S, 18º 17’ -18º 59’ E, using standard GPS coordinate system) is located along the coastal front in the Western Cape province of South Africa, as shown in Figure 1. Surrounding the region are two prominent oceans: the Atlantic on the west and the Indian on the east. Hence, it experiences the warm south-easterly Agulhas and the cold north-westerly Benguela air currents (Walker, 1990; Lutjeharms et al., 2001) throughout the year, which bring a significant amount of marine aerosols to the shore. The region is endowed with diverse topography such as sandy, rocky, and mountainous lands, making it a famous destination for tourists. Apart from tourism, as one of the metropolitan cities in South Africa, Cape Town is known for several other industrial activities which include manufacturing, mining, fishing, and agriculture, despite being a mountainous area. The city shares the same climate as other parts of Western Cape and is characterized by four seasons according to the long-term climatology of South Africa (Tesfaye et al., 2011; SAWS, 2017), namely summer (December-February), autumn (March-May), winter (June-August) and spring (September-November). The region also possesses a diverse climatology due to its Mediterranean climate characteristics, with a cold, wet winter and a hot, dry summer (Kruger, 1984).
Annually, incidences of biomass burning during the summer-autumn season are registered in the Western Cape province, due to natural events of forest fire and anthropogenic activities of bush burning for land-use purposes (Forsyth et al., 2010), which along with other activities (movements of agricultural machinery and vehicles, human and industrial pollution, between others) often contribute different forms of aerosol particulates to its atmosphere. These processes often result in poor visibility coupled with air pollution and environmental degradation leading to health challenges and changes in the climate pattern. For many years, the region has been experiencing events of smog (Cape Town brown haze), which covers most parts of the city during the winter-spring season due to the accumulation of pollutants released into its atmosphere (Wicking-Baird et al., 1997). Recently (2015-2016), the region was declared to be faced with potential drought due to low precipitation and a decrease in water levels (Botai et al., 2016, 2017), thus raising concerns. The main objective of this study is to investigate the general optical characteristics of the atmosphere over the region and the effect of biomass burning and smog formation.
3. Results and discussion
3.1. Optical parameters
The atmospheric aerosol condition of Cape Town is described by the parameters AOD, AE, WVC, fine and coarse mode AOD, and the particle size distribution for the period of study. The statistical summary of five AOD channels (440, 500, 675, 870 and 1020 nm), AE (440-870) and WVC for the study period (June 2015-December 2019) as obtained from AERONET is shown in Table I.
Table I AERONET multiyear (June 2015-December 2019) mean, SD, median, maximum, and minimum values of AOD, AE and WVC.
| Statistics | AOD (440 nm) | AOD 500 (nm) | AOD (675 nm) | AOD (870 nm) | AOD (1020 nm) | AE (440-870) | WVC/cm |
| Mean | 0.084 | 0.075 | 0.058 | 0.056 | 0.046 | 0.630 | 1.562 |
| SD | 0.024 | 0.022 | 0.019 | 0.017 | 0.017 | 0.190 | 0.315 |
| Min. | 0.041 | 0.040 | 0.027 | 0.029 | 0.019 | 0.258 | 0.990 |
| Max. | 0.143 | 0.132 | 0.120 | 0.114 | 0.109 | 1.134 | 2.407 |
| Median | 0.079 | 0.071 | 0.055 | 0.054 | 0.044 | 0.632 | 1.470 |
AOD: aerosol optical depth; AE: Ångström exponent; WVC: water vapor content.
Figure 2a shows the monthly average AOD (500 nm) with the error bars representing their SD around the mean for AERONET sun photometer measurements during the period June 2015-December 2019 (including intervals without data). AOD is generally low over the region, with values typically < 0.2. The average AOD for the entire study period over the area was 0.075 (± 0.022), which is well within the range of values for clean marine aerosol. An important feature of the monthly AOD variation is the typical high AOD values (> 0.07) during the periods June 2015-August 2016 and June 2018-December 2019, hereafter referred to as high aerosol regime (HAR), and the episode of low values (< 0.07) from September 2016 to May 2018, hereafter referred to as low aerosol regime (LAR). LAR indicates the prevalence of background and industrial/urban aerosols conditions, and HAR demonstrates the increasing events of plumes either transported (e.g., smoke and dust) or generated internally from biomass burning. The maximum AOD 0.132 (± 0.053) for the entire study period occurred in May 2016 during HAR while the minimum 0.040 (± 0.017) in February 2018 within the LAR. Furthermore, several peaks occurred during the HAR and LAR, with the most significant occurring around May-September and then January. Although the data presented in this study did not consider the events between June-July 2016 due to unavailable data on account of instrument maintenance, reocurring increments in aerosol loading about the same period seem evident. The high turbidity around May-September was mostly liable to transported air masses from neighboring countries along the northern border and across the ocean. In addition, smog (Cape Town brown haze) resulting from stagnant locally generated aerosols mainly by fossil fuel combustion, aggravates the increase in AOD during August-September. Meanwhile, the January rise is the direct consequence of local biomass burning combined with particles from fossil combustion and background aerosols such as mineral dust (MD) and sea salt (SS). Apart from the above-listed aerosols, the effect of mist/fog also increases AOD and reduces visibility during the summer (December-February). Conversely, AOD decrease is mainly associated to aerosol removal by the atmospheric sink process, so that wet deposition occurs in winter and dry deposition during summer. Daily average AOD in Figure 3a shows similar variations: AOD is mainly < 0.08 during LAR, signifying less polluted atmospheric conditions, while AOD > 0.08 mostly during HAR represents the opposite. The maximum daily AOD (0.809 ± 0.027) occured in August 2015 at a period known to be highly turbid during the HAR, while the minimum (0.014 ± 0.001), typical of pristine days, was observed in April 2017 during LAR. Moreover, the occurrence of both maximum and minimum daily AOD differs from monthly averages due to the consistently high and low aerosol loading for different months. These results reflect the findings of Adesina et al. (2016), who reported that tropospheric aerosol over the region is maximum during the spring, followed by summer. However, in their study, the effects of atmospheric sink process and smog were not quantified.
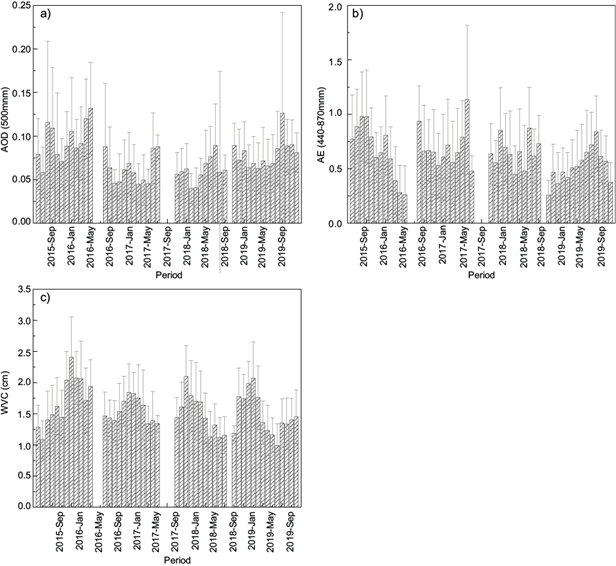
Fig. 2 AERONET average monthly values of (a) aerosol optical depth (AOD) (500 nm), (b) Ångström exponent α (440-870 nm), and (c) water vapor content (WVC) with error bars representing the SD about the mean.
Generally, the lower parts of South Africa (including Cape Town) are known to be less dusty because mineral dust generation is mainly limited to local ablation by wind (Tesfaye et al., 2011). Therefore, we could rule out mineral dust as a principal constituent of the background aerosols. Besides, based on the variations of daily AOD, the clustering around values < 0.08, which represents about 70% of the entire population data, is consistent with the expectation of a coastal marine site (Mulcahy et al., 2009; Reid et al., 2006; Smirnov et al., 2003).
The effect of aerosol removal by wet and dry deposition is well documented in the literature (see Boucher, 2015). Some studies over South Africa have also indicated that aerosol particles are removed by wet deposition during the rainy season (Tesfaye et al., 2011; Hersey et al., 2015). Also, detailed studies of several regions (such as India and South Korea) have inferred that wet deposition removes more than 65% of suspended aerosol from the atmosphere (Jacobson, 2003; Saha and Moorthy, 2004; Yoo et al., 2014). Therefore, the need to conduct a comprehensive study to determine the efficiency of aerosol removal by wet deposition over South Africa becomes imperative. On the other hand, high AOD during the winter-spring season results from the incursion of long-range transport aerosol and smog cover (brown haze) over Cape Town during this period. Transported aerosol mainly emerges from the motion of air masses from the northern and border parts of South Africa (Tesfaye et al., 2011; Hersey et al., 2015), and is comprised mainly of aged smoke (e.g. from biomass and fossil fuel burning) and MD. Also, various studies have linked haze formation over the region to both transport and accumulation of locally generated pollutants from fossil fuels combustion such as vehicle exhaust and industrial emission (Wicking-Baird et al., 1997; Abiodun et al., 2014). This observation is similar to trends observed from studies conducted in other regions such as India and China, where events of smog increased AOD and were mainly associated to highly populated and industrialized cities (Xue et al., 2011; Sati and Mohan, 2014; Tao et al., 2016).
Despite evidence that intense biomass burning aerosol often results in less atmospheric instability, deters convective cloud formation and suppresses precipitation (Rosenfeld, 1999; Kolusu et al., 2015; Hodnebrog et al., 2016; Huang et al., 2016), its role over this region is not clear, particularly concerning rainfall and smog. The period 2015-2016 was marked by the presence of drought over this region and other parts of South Africa, following a descent in rainfall and water level (Botai et al., 2016, 2017), with a slight recovery during 2017. This event coincides with the transition from HAR to LAR. Nevertheless, the role played by the characteristic change in aerosol due to biomass burning remains unclear. Studies have shown that aerosols generated from biomass burning often affect the microphysics of convective clouds and suppress precipitation (Fan et al., 2016; Alizadeh-Choobari and Gharaylo, 2017), since particles such as black carbon (a good absorber of incoming solar radiation) may warm up the cloud and suppress the formation of rain-bearing clouds (Hansen et al., 1997; O’Neill et al., 2002). Similarly, studies have shown that a large concentration of aerosol could modify the cloud droplet size, thereby influencing the precipitation efficiency (Twomey, 1974; Albrecht, 1989). Therefore, these two conditions could have an intense effect on the cloud microphysical process over the region. Nevertheless, their impact on precipitation and other climate parameters is immediately unclear, especially concerning the perceived drought and temperature rise experienced in recent times, thus further studies are needed to clarify this subject.
AE or α is a parameter that describes the wavelength dependency of the extinction coefficient and the average particle size (O’Neill et al., 2002; Smirnov et al., 2002), such that the higher the exponent value, the smaller the particle size and vice versa. Figure 2b illustrates the monthly averages of α (440-870 nm) for the region during the study period. This parameter was generally < 0.75 over the area during the entire period, with an overall average of 0.630 (± 0.192). This value again indicates the dominance of coarse mode aerosols and is typical of a coastal marine site. There are indications that these coarse mode aerosols are mostly made-up of SS aerosols due to the proximity of marine air masses and their transportation. Study results by Kaufman et al. (2001) on global coastal and maritime aerosols report median AE values of 0.77 for clean marine aerosols over the Atlantic and 1.1 for the Pacific Ocean. Similarly, Smirnov et al. (2003) report an AE limited to values < 1 for clean marine aerosols.
The monthly maximum mean value over the region was 1.134 (± 0.683) in June 2017, which coincides with the early rainfall period in the winter, while the minimum (0.258 ± 0.135) occurred in November 2018. Meanwhile, both aerosol modes are often observed during winter/spring, while the coarse aerosol mode is predominant around summer/autumn. The daily average α in Figure 3b displays a similar variation as the monthly average such that α almost evenly splits between fine and coarse mode aerosols during the winter-spring period. In contrast, α is mainly < 1.0 during the summer period, signifying the general dominance of coarse particle aerosol. The daily maximum value (1.737 ± 0.041) in January 2016 is typical of high AE during the summer months due to rising pollution, while the minimum (-0.146 ± 0.099) occurred in May 2018. Besides, daily values allow observations of the transition between smoke-influenced and smoke-free days, which agrees with the assertion that α decreases with smoke aging as smoke-free days are approached as observed by Kaufman et al. (1998) and O’Neill et al. (2002).
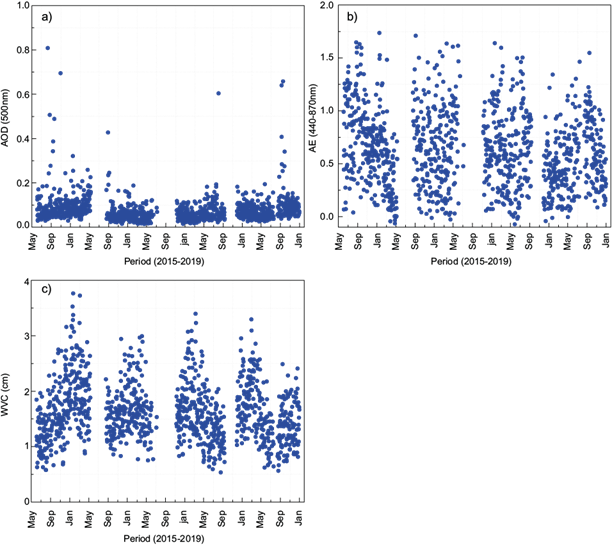
Fig. 3 Plots of AERONET average daily values: (a) aerosol optical depth (AOD) (500 nm), (b) Ångström exponent α (440-870 nm), and (c) water vapor content (WVC).
Following the variations of AOD and α, Figure 2c shows the monthly distribution of atmospheric water vapor over the region. The maximum monthly average WVC (2.407 ± 0.650 cm) in January 2016 represents a growth in the hygroscopic condition of the atmosphere. Conversely, the minimum average value of 0.990 ± 0.351 in August 2019 is the consequence of cold-wet atmospheric conditions over the region. This pattern mainly follows the process of decreasing vapor during the cold-wet winter since cold air holds less vapor, and saturation is more rapid. Consequently, this could be a contributing factor to the general low precipitation over the region compared to other parts of South Africa that experience rainfall during the summer. Also, the increase in vapor content towards the summer is linkable to dry-warm atmospheric conditions, because hot air holds more vapor and the saturation value is higher. Moreover, an increase in transpiration and evaporation rates is likely to enhance WVC during this period. Besides, fine particles rich in absorbing aerosols, mainly from biomass and fossil fuel burning, may constitute a contributing factor towards such enhancement. A similar variation could be observed from the daily average precipitable water pattern in Figure 3c. The unit (cm or g cm-1) for WVC are both consistent. (e.g., https://aeronet.gsfc.nasa.gov/new_web/units.html) during winter and spring, and mainly > 2.0 cm during autumn and summer. The minimum daily average WVC (0.535 ± 0.040 cm) occurred in August 2018 and the maximum (3.766 ± 0.069 cm) in January 2016. It is worth noting that atmospheric vapor increases non-uniformly from winter to summer, which is consistent with findings that vapor decreases in winter (Sioris et al., 2016) and increases in summer (Kim et al., 2007). Also, the WVC slightly increases under the influence of smog and biomass burning due to absorbing aerosols as observed from the daily variation of WVC. Results from daily and monthly changes suggest the enhancement of WVC over the region due to the rise of absorbing aerosol, which is consistent with the findings of other studies (e.g., Giles et al., 2012; Eck et al., 2013).
Figure 4 presents a comparison between data derived from MODIS satellite measurements and AERONET over the same period. The assessment becomes necessary for two main reasons: evaluating and validating the satellite measurements over the region. The AOD and AODav (average AOD) for both MODIS (550 nm) and AERONET (500 nm) from June 2015 to December 2019 are illustrated in Figure 4a, where it can be seen that both parameters increased during three main periods: April-June, August-September, and December-January. The first and second periods are associated to transported air mass and smog while the last is linked to biomass burning.
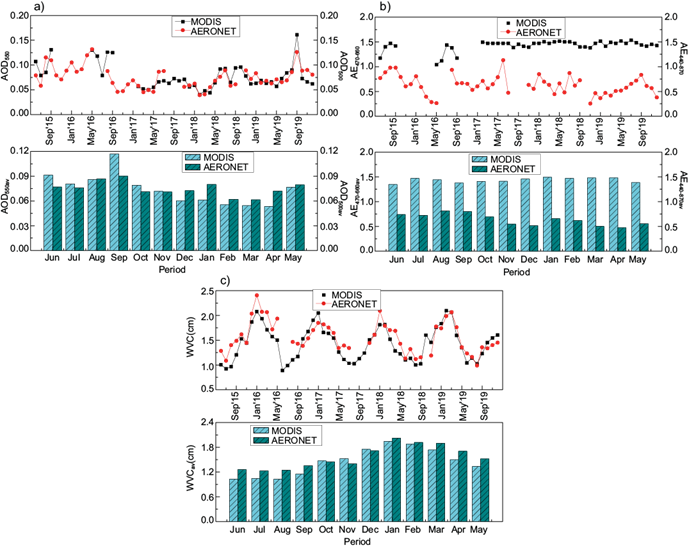
Fig. 4 A combined plot of AERONET and MODIS time-series (top) and averages (bottom) of the parameters (a) AOD, (b) AE, and (c) WVC for the study period (2015-2019).
The decrease in AOD during winter, spring, and autumn is the direct consequence of aerosol removal through atmospheric sink processes, while dry deposition accounts for significant aerosol removal during spring and autumn and wet deposition dominates the particles sink process in winter. The minimum AODav during the 55-month study period occurred in April (MODIS) and March (AERONET), while the maximum AODav occurred in September for both sources, associated to the atmospheric sink process (minimum) and the combined transport of air mass and smog (maximum). In general, the patterns displayed in Figure 4a show significant consistency between AERONET and MODIS measurements with a positive correlation (r = 0.72). The observed disparities between AOD measurements obtained from both platforms are due to higher AOD uncertainty by MODIS and other retrieval biases, as observed from various studies (e.g., Drury et al., 2008; Loría-Salazar et al., 2016; Sherman et al., 2016).
Figure 4b shows the comparison between MODIS and AERONET α and α av measurements for the study period. A high level of inconsistency existed between the measurements from the two sensors. Contrary to AERONET data, which shows the predominance of coarse mode aerosol such that mostly α < 0.75, MODIS tends more towards fine mode aerosol with generally high values of α av . Hence, not much significant correlation existed between the two measurements (r = 0.11), indicating a considerable disparity. This discrepancy must have resulted from several uncertainties inherited from the retrieval of MODIS AOD, since α is computed based on AOD at two reference wavelengths. Nevertheless, α av for both instruments showed an increase in values during the periods June-September and January-February, linked to the rise of fine mode particles primarily from smoke aerosols.
A robust agreement between WVC and WVCav can be seen in Figure 4c with r > 0.8. An increase in the atmospheric vapor content from winter to summer is evident following the increase in precipitable water from June to January (winter-summer), then it decreases through February-May (summer-winter). The maximum and minimum WVCav for the two instruments coincide and respectively occur in January and July. The maximum and general increase in the atmospheric vapor is accountable to dryness and high air temperature, thereby intensifying the water holding capacities of air and saturation levels. Meanwhile, low and minimum atmospheric vapor during the winter is the direct consequence of low water-holding capabilities by cold air and more rapid saturation, as earlier described. This result is consistent with the general synoptic pattern of the region and in good agreement with findings from other studies (e.g., Smirnov et al., 2002) where high WVC is observed during summertime and the opposite in winter.
To identify the primary sources of aerosol liable to the observed transported airmass to the region, a five-days back trajectory analysis is performed based on NOAA’s Hybrid Single-Particle Lagrangian Integrated Trajectory (HYSPLIT) model. The trajectories calculated at three altitudes (500, 750 and 1000 m above the ground level) are for days mainly associated with high AOD values. Figure 5 presents six examples of the three most frequent airflow patterns selected based on days with high AOD. In the first pattern (Fig. 5a, b) air masses arrive in the region from upper South Africa and countries along the northern border (e.g., Namibia, Botswana, Zimbabwe and Mozambique) mainly during biomass burning events. This feature is common to the several occurrences of AOD peaks during August-September. The second (Fig. 5c, d) pattern is the most frequent, representing more than 70% of the cases considered and generally associated with a low AOD value. The inflow of air masses directly from the Atlantic Ocean and sometimes through the northwest direction offshore Namibia brings sea spray particles (majorly SS) and entrained MD to the region. This feature is noticeable year-round and constitutes one of the background aerosols over the area, hence accounts for the dominance of coarse mode aerosol in the particle size distribution. The third pattern (Fig. 5e, f) is the least occurring of transported air masses to the region but also linked with relatively high AOD. In this case, air masses originate from the South American region and they are most likely associated with the Amazon forest fire. Formenti et al. (2002) reported a similar pattern demonstrating transport of smokes from Brazil fires across the Atlantic Ocean to the shores of South Africa. Yearly, the Amazon forest experiences forest fires during the period June-October mainly due to deforestation (González-Alonso et al., 2019), whereby the prevailing south-easterly wind transports aerosols toward Africa. Due to timing, the trajectories shown by the first and last patterns suggest that the inflow of air masses, mostly aged smoke of biomass burning from the northern part of the region and the Amazon rainforest, influences precipitation rather than the local veld fire.
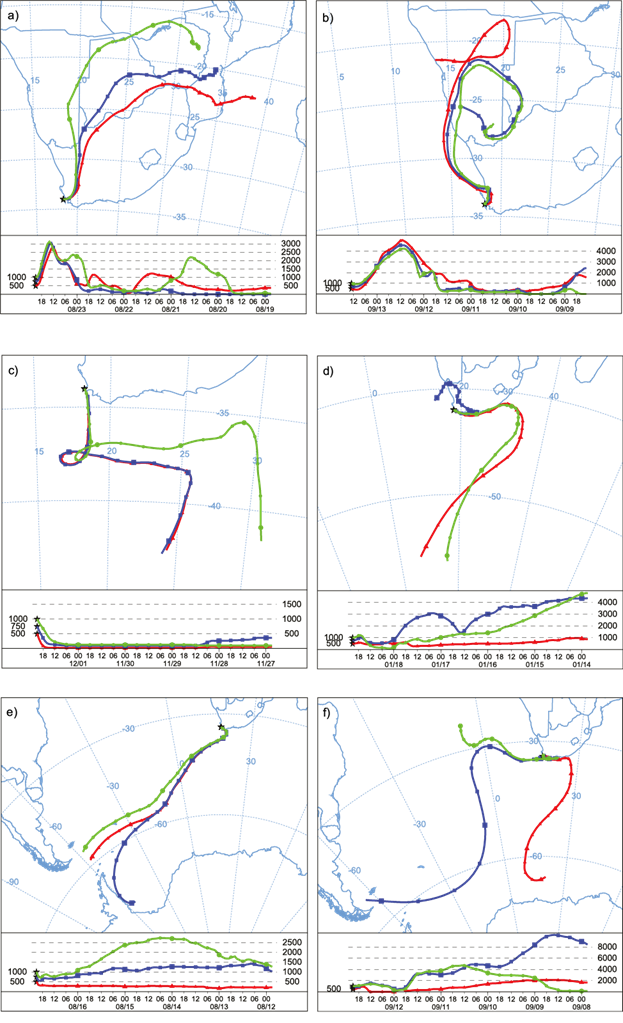
Fig. 5 Five-day back trajectories ending at Cape Town (solid black star) at heights 1000 m (green line), 750 m (blue line) and 500 m (red line) above the ground level calculated for (a) August 23, 2015 (τ = 0.506); (b) September 13, 2015 (τ = 0.387); (c) December 1, 2015 (τ = 0.244); (d) January 18, 2016 (τ = 0.255) (e) August 16, 2015 (τ = 0.809), and (f) September 12, 2015 (τ = 0.343).
Furthermore, during the recent drought years (2015-2016), precipitation declined to its minimum in 2015 (see Botai et al., 2016, 2017), coinciding with HAR, while the slight improvement seen around 2017 occurred during LAR. Therefore, a detailed study is required to determine the effect of increasing pollution caused by transported smoke on precipitation. As for smog, it is possible that the transported smoke mixes with stagnant aerosols to trigger a rise in pollution, especially during periods of low wind speed.
To further observe the aerosol distribution in terms of size and quantity over the region, the fine:coarse mode particle ratio in terms of the total AOD in the atmospheric column retrieved by the spectral deconvolution algorithm (SDA) is illustrated in Figure 6. The variation of fine (τf) and coarse (τc) mode AOD seems not so different from the patterns earlier described by comparing the change in AOD and AE. As expected, this figure shows that the distribution of aerosol over the region is predominantly made-up of τc particles; nonetheless, these are more present during the winter-spring period, especially in the presence of stagnant air masses and smog. The predominance of τc particles is most likely influenced by the coarse particles of SS aerosols transported along with other aerosols into the region from across the ocean by prevailing air masses.
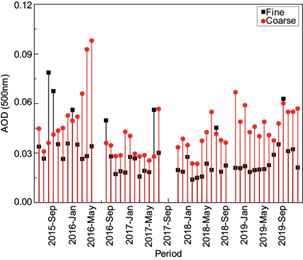
Fig. 6 Monthly average values of fine (τf) and coarse (τc) aerosol optical depth (AOD) from the AERONET spectral deconvolution algorithm (SDA) data.
Illustrated in Figure 7a is the relationship between daily average AOD and α. In most cases, this makes it possible to define explainable cluster regions for different aerosol types (Smirnov et al., 2002; Kumar et al., 2013). The dispersion of clusters across the values of α and AOD displays a very low positive correlation (r < 0.1) between the parameters, indicating an insignificant linear relationship. Nevertheless, from general observation α is mainly > 1 in the region of τ > 0.2, and α < 1 in the range of τ < 0.2, in which the latter represents > 80% of the data again signifying the predominance of coarse particles. This summary shows that the few cases of extremely high AOD over the region are most likely influenced by a high concentration of fine particle aerosols such as smoke and smog. Hence, there is a strong influence of particle size in the induction of high AOD values, which supports the results of prior observations (e.g., Twomey, 1974; Albrecht, 1989; Smirnov et al., 2002).
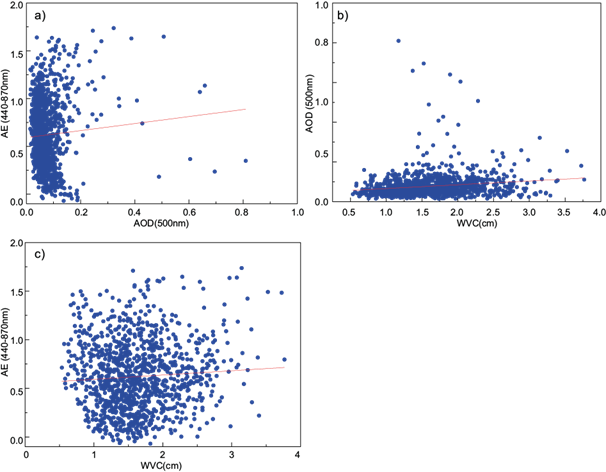
Fig. 7 Scatter plot of AERONET: (a) Ångström exponent (AE) vs. aerosol optical depth (AOD), (b) AOD vs. water vapor content (WVC), and (c) AE vs. WVC.
Similarly, a low positive correlation (r = 0.16) exists between daily average AOD and WVC, as shown in Figure 7b, indicating a fragile linear relationship between these parameters. In Figure 7c, average α and WVC also show a low relationship for the period of study, with r < 0.1, which is similar to the results of Smirnov et al. (2002). However, the cluster of scattering plots suggests the influence of specific aerosol types (e.g., absorbing aerosol) on vapor.
3.2. Particulate size distribution
The description of particle size distribution will follow the procedure of Dubovik and King (2000) iterative algorithm, earlier explained in section 2.1. Following the model, Figure 8a shows the average monthly particle size distribution for the period June 2015-December 2019. Coarse mode particles dominate the aerosol volume size distribution over Cape Town during the study period, which is consistent with the observations in previous sections. Coarse mode aerosols (in this case largely SS) can be associated with the inflow of long-range transported air masses from the surrounding seas. Another important feature from this figure is the observable peaks in the region of fine mode aerosols. These peaks representing a slight increase in fine aerosols occur during the months were identifie to be influenced by either biomass burning (local or transported) or smog, which again agrees well with findings from previous sections.
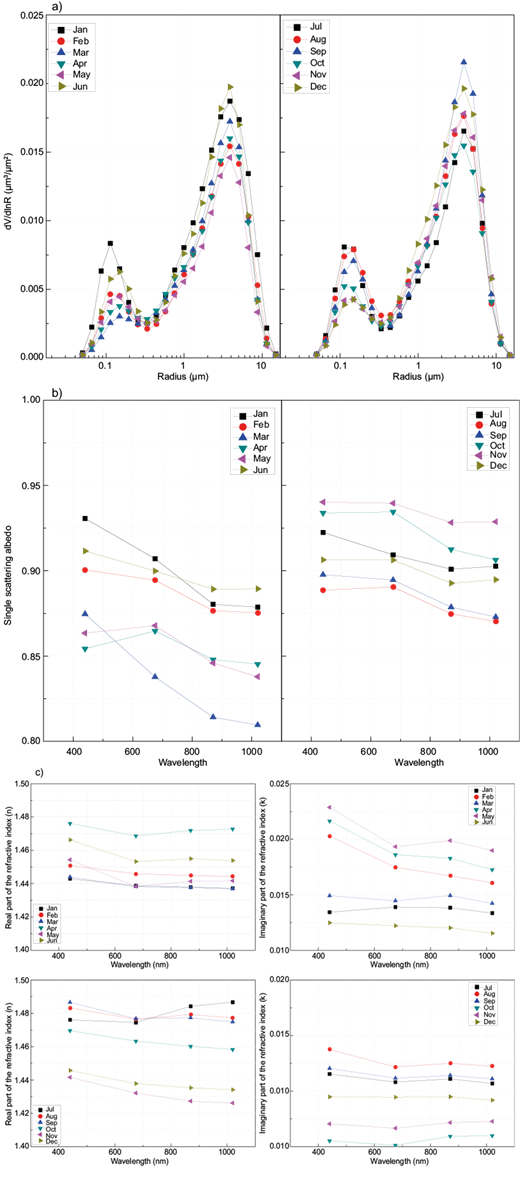
Fig. 8 Plots of: (a) particulate size distribution in the total atmospheric column, (b) single scattering albedo (SSA) at wavelength 440-1020 nm, (c) real and imaginary parts of the refractive index at wavelength 440-1020 nm.
Table II shows a summarized comparison between aerosol optical properties (AOD, AE, SSA, and refractive index) obtained in this study and reported values from other locations around the world.
Table II Comparison of aerosol optical properties for Cape Town with reported values from other studies.
| Location | Cape Town | Mexico City | Lanai, Hawaii |
| AOD (550 nm) | 0.08 ± 0.02 | 0.43 (440) | 0.078 |
| AE (440-870 nm) | 0.63 ± 0.19 | - | 0.65 |
| SSA (440/675/870/1020) | 0.90/0.90/0.88/0.88 ± 0.05 | 0.90/0.88/0.85/0.83 ± 0.02 | 0.98/0.97/0.97/0.97 ± 0.03 |
| RI (n;k) | 1.45 ± 0.06; 0.0127 ± 0.008 | 1.47 ± 0.03 0.014 ± 0.006 | 1.36 ± 0.01; 0.0015 ± 0.001 |
| Aerosol type | Urban-Industrial + Maritime | Urban-industrial | Maritime |
| Source | Present study | Dubovik et al., 2001 | Dubovik et al., 2001; Smirnov et al., 2003 |
Figure 8b exhibits the plot of single scattering albedos (SSA) for wavelengths between 440 and 1020 nm. High absorption with strong spectral dependence (SSA decrease with increasing wavelength) is the main feature of absorbing aerosols such as black carbon emitted in the process of biomass burning and fossil fuel combustion. In contrast, low absorption with neutral or less spectral dependence is characteristic of non-absorbing aerosols such as SS and MD. In this figure, the presence of absorbing particles linkable to urban-industrial activities in the region is evident in most of the months. The average SSA for the spectral channels of 440, 675, 870, and 1020 nm is 0.90, 0.90, 0.88, and 0.88 ± 0.05, respectively, which is typical of a coastal site polluted by urban-industrial aerosol (see Dubovik et al., 2001). A similar pattern of SSA (550 nm) variation in the range of 0.92-0.88 is noticeable during months associated to biomass burning and transported smoke, which is consistent with AERONET retrievals over the South Amazonian forest and the Brazilian Cerrado as reported by Dubovik et al. (2001).
To complement the observation from the SSA, Figure 8c shows the refractive index, which consists of the real n(λ) and imaginary k(λ) parts. The average refractive index for the region during the study period was 1.45 ± 0.06 and 0.0127 ± 0.008 for the real and imaginary parts, respectively. This value is more comparable to that of urban-industrial aerosol in the case of Mexico City (Table I); however, AOD and AE for Cape Town substantially deviate from the expected value for a typical urban-industrial dominated aerosol. Besides, the possibility ruled out dust aerosol since the optical depth is far below the expected value for MD polluted sites. Hence, a lower AOD value is an important characteristic that distinguishes maritime aerosol from desert dust, urban-industrial, and biomass burning aerosols (Dubovik et al., 2001; Smirnov et al., 2003).
3.3. The link between Western Cape fires and optical parameters
This section examines the influence of local biomass burning on the physical condition of the atmosphere over Cape Town and its effect on AOD, using data from the combined Aqua-Terra MODIS active fire satellite observations. The description follows the use of datasets including corrected fire pixels (CFPs) and fire radiative power (FRP) obtained from the MODIS climate modeling grid (CMG) active fire product at 250-m spatial resolution, as well as black carbon (BC) concentration data from the MERRA-2 reanalysis. FRP is a new parameter to characterize fire activities globally that was initially proposed by Kaufman et al. (1998) and later modified by Wooster et al. (2003).
Western Cape, including Cape Town, experiences events of veld fire during the summer (December-February). As expected, biomass burning events generate fine particles of smoke rich in BC, which is of enormous importance to estimate radiative forcing. To this end, Figure 9 illustrates the comparison between CFP and FRP as indicators of active fire and their magnitude, respectively, and the combined AOD-BC variations for the period June 2015-December 2018. Observations show that both AOD and BC mass concentration increased during the activities of biomass burning around the summer months. The event sometimes raises radiative forcing at the top of the atmosphere (TOA) by about 50% above average. However, due to difference in timing between events, the effect of local biomass burning on precipitation is not immediately known and requires more investigation.
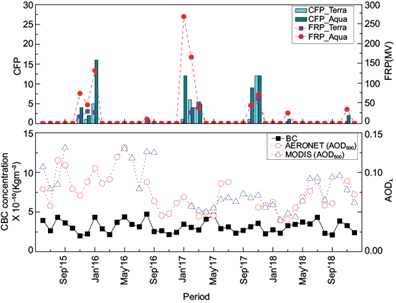
Fig. 9 Time-series of corrected fire pixels (CFP) and fire radiative power (FRP) (top), then AOD and black carbon (BC) mass concentration adopted from the MERRA-2 analysis (bottom).
Meanwhile, other sources of biomass burning linked to the region through the inflow of long-range transported aged smoke could potentially be of more influence on the precipitation due to period overlap. From Figure 9, a concurrent increase in AOD with BC suspension during the periods associated to transported aged smoke and smog is noticeable. Perhaps, this could result in the formation of smaller cloud droplets due to BC particle size, thus reducing the coalescence rate. Alternatively, BC being a strong absorbent of solar radiation, could warm the inner cloud during interaction with cloud droplets, thus deterring the formation of convective clouds. This whole process can seriously hamper precipitation efficiency over the region and consistently lead to drought. Although this work did not elaborate on the role of biomass burning on rainfall patterns, the results suggest that biomass burning aerosols from external sources are more liable to influence the precipitation decline over the region than localized ones.
4. Conclusions
This work examined the optical characteristics of aerosol over Cape Town and the role of biomass burning in the distribution over 55 months, including months without data. AERONET ground and MODIS satellite remote sensing datasets for the site constitute the basis of the study, including the evaluation and validation of satellite measurements. Subsequently, we compared observations at different stages with results from studies conducted over similar sites.
The general condition of the atmosphere over the region is associated with low aerosol loading of AOD values, mostly < 0.2 and predominantly made up of coarse mode particles. However, the few cases of high AOD values (τ ≥ 0.2) are either connected to the event of local biomass burning, to smog or to transported aerosol encapsulated with aged smoke and predominantly fine mode particles. For the entire study period, the mean AOD and AE were 0.075 and 0.63, respectively, and represented more than 50% of the dataset.
Two distinct aerosol regimes occurred during the study period such that LAR (September 2016-May 2018) with AOD generally < 0.08 separates two HARs (June 2015-August 2016 and June 2018-December 2019) characterized mostly by AOD > 0.08. The latter coincides with the period of low precipitation and drop in water level, while the former overlaps with the period of slight recovery. Besides, three main events influenced the general aerosol distribution in addition to background particles. They include local biomass burning (during summer-autumn), particle removal through atmospheric sink processes (wet deposition in winter and dry deposition during late spring), and inflow of transported aerosol complemented by smog (early spring).
Two sources of biomass burning aerosol accounted for the considerable amount of smoke emission to the atmosphere. The first one is local biomass burning, such as veld fires and bush burning that occur during summer (December-February); however, the second source represents transported aged smoke of biomass burning mostly from the border communities around Western Cape and countries north of South Africa during June-September. Besides, traces of aged smokes arrive at the shores of Cape Town from the South American Amazon forest.
Based on the assessment of particle size distribution, SSA, and the refractive index, the characteristics of aerosols over the region resemble those of a typical coastal site polluted by urban-industrial aerosol. The particle size distribution shows the dominance of coarse mode particles with slight peaks in the region of fine mode aerosols for months associated with biomass burning. The SSA compares well with maritime aerosol, while the refractive index is typical of urban-industrial aerosol.
Further, three main features (air temperature, saturation level, and to some extent the presence of absorbing aerosols) mainly influenced the amount of atmospheric vapor measured by WVC. Moreover, precipitable water over the region increases from winter to summer and vice versa following these activities.
No link was detected between smog events and local biomass burning; rather, anthropogenic activities such as domestic emission and industrial fossil fuel combustion invigorated by transported aged smoke, seemed responsible for the smog formation. Similarly, no connection between local biomass burning and precipitation was spotted over the area. However, aged smoke transported by air masses from the external biomass burning regions constitutes a potential influence on precipitation due to time overlap of events.
A significant relationship exists between AERONET and MODIS measurements for AOD and WVC with correlation typically > 0.7 for both parameters. However, AE presented a low correlation associated with errors inherited from MODIS AOD and dissimilarity in the reference wavelengths.


 nueva página del texto (beta)


