1. Introduction
Mineral dust is the most abundant natural aerosol in the atmosphere (Schepanski, 2018; Salehi et al., 2019). Dust storms are one of the most important natural hazards, as they inject considerable dust into the atmosphere. Dust storms have several important environmental roles, such as in the Earth’s radiative budget (Abuduwaili et al., 2010), cloud condensation nuclei (Stocker et al., 2013), hydrological cycle (Abuduwaili et al., 2010), marine life (Neelamani and al-Dousari, 2016; Hamza, 2021), and vegetation cover (Zou and Zhai, 2004; Kimura et al., 2009; Khusfi et al., 2020). Also, they affect transportation through reduced visibility and human health (e.g., cardiovascular and respiratory diseases) (Griffin and Kellog, 2004; Mhawish et al., 2022).
Dust particles not only affect the area near the dust sources but also can be transported far away from them (Zhang et al. 2008; Shukurov et al., 2023). For example, massive dust is transported every year from the North African Sahara Desert across the Atlantic to South and North America (Ansmann et al., 2009; Creamean et al., 2013; Chen et al., 2018). Similarly, dust particles originate from the Middle East and the Arabian Peninsula and are transported to South Asia mainly during the pre-monsoon summer (March to May). So, dust particles spread over the entire globe near or far from the dust sources (Shao et al., 2013).
Dust particles may originate from different sources, such as deserts (Goudie and Middleton, 2006; Mhawish et al., 2021), dried lake beds (Opp et al., 2017; Farebrother et al., 2017; Hamzeh et al., 2022), agricultural areas (Funk et al., 2008; Xi and Sokolik, 2016), river floodplains (Bullard and Austin, 2011), ocean sediments (Mahowald et al., 1999), coastal areas (Cao et al., 2015; Jish et al., 2016), and glacial deposits (Basile et al., 1997; Rousseau et al., 2014). In arid and semi-arid areas, dust storms frequently occur driven mainly by strong surface winds. Large amounts of particulate matter can be lifted from bare, dry soils into the atmosphere and transported downwind, affecting regions hundreds to thousands of kilometers away. Note that the dust aerosols can be uplifted from the underlying surface into surface air with vortexes (Foroushani et al., 2020), even in the absence of the necessary mean wind speed (about 4 m s-1) to start sand saltation (Karami et al., 2020).
Dried lake beds have become important dust sources in the last decades (Opp et al., 2017), not only due to climate change but also to humans’ mismanagement of water resources (Prospero and Lamb, 2003). Some examples of these new dust sources are the Aral Sea in Central Asia, the Great Salt Lake in America (Williams, 2020), Hamun Lake (Karami et al., 2019, 2021a), Jazmorian Lake (Rashki et al., 2017; Soleimani et al., 2021), Bakhtegan (Karimzadeh and Taghizadeh, 2019), and the Urmia Lake in the Middle East (Opp et al., 2015; Hamzeh et al. 2022, 2023a).
The Urmia Lake has lost most of its water volume (Hamzeh et al., 2022) over the last two decades, primarily in the southern part, which has become a dried lake bed (Ranjbar et al., 2022a, b). This has given rise to frequent dust storms, which affect urban areas in its northwest region due to the predominant wind directions (Hamzeh et al., 2022, 2023b).
Climate change also significantly affects this lake since precipitation has decreased by 9.2%, and temperature has increased by 8 ºC over the lake in the last 40 years (Delju et al., 2013). However, the main reason for the decreasing water level is the construction of a dam across the river basin that feeds the lake (Yasi and Ashori, 2017). A study estimated that climate change had a role of only 20% in the drying of Urmia Lake, while 80% is due to anthropogenic reasons (Ahmady-Birgani et al., 2020).
Several studies have investigated the reduction in the water level of Urmia Lake in the last decades (Yasi and Ashori, 2017; Hamzeh et al., 2022). These studies reported increasing saline dust near and far from the lake and a high salt concentration (known as a salty lake worldwide) (Marjani and Jamali, 2014). Consequently, if the water level decreases, salt particles remain on the surface of the soil and rise up in the air with a moderate wind speed.
2. Introduction
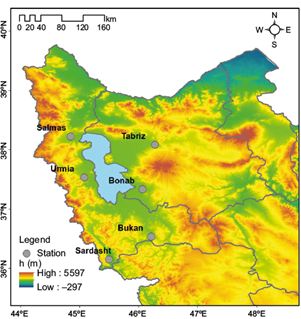
The Urmia Lake (37-38.5º N; 45-46º E) is located in northwestern (northwest) Iran at 1273 masl (Fig. 1). It is the world’s second-largest salt lake after the Great Salt Lake in the United States. The lake’s surface area varies between 4600 and 6000 km2, depending on the evaporation rates and water influx (Gholampour et al., 2015; Opp et al., 2017). This lake has recently lost most of its water body due to various factors, mainly the construction of several dams within its catchment. The catchment areas of Urmia Lake contain more than 50 dams used primarily for irrigation and drinking water supply. Over-construction of dams is one of the main anthropogenic factors that impact the water household of the lake. In addition, the development and operation of more than 300 aquaculture facilities for fish production around Urmia Lake, pumping up groundwater as process water for the aquaculture fish ponds, interrupts the groundwater inflow into the lake (Dee et al., 2011; Opp et al., 2017). This is also considered another main anthropogenic reason for the Urmia Lake disaster. Therefore, saline dust storms arise quickly from the desiccated lake bed (Gholampour et al., 2015).
3. Data sets and methodology
3.1 Data sets
ERA-Interim (Gholampour et al., 2015) and ERA5 hourly data (Hersbach et al., 2020) with a horizontal resolution of 0.75º × 0.75º and 0.25º × 0.25º, respectively, were used to evaluate both large-scale and local-scale atmospheric circulations associated with the intense dust storm in April 2017. Mean sea level pressure (MSLP [mb]), wind (m s-1), air temperature (ºC) and geopotential heights fields (gpm) at 850 and 500 hPa levels, jet stream at 200 hPa level, 10-m wind gusts and 10-m wind vectors were obtained from ERA-Interim and ERA5 reanalysis datasets.
Terra MODIS merged deep blue and dark target AOD at 550 nm (AOD550) products were used to assess column dust aerosol loading (https://giovanni.gsfc.nasa.gov). In addition, true-color imagery (RGB) from MODIS was used to visually assess the dust storms and reveal the dust plume propagation (https://lance-modis.eosdis.nasa.gov). Visibility maps from the Sand and Dust Storms Warning Advisory and Assessment System (SDS-WAS) were used to visualize the visibility reduction. In addition, the WMO weather codes related to dust (06, 07-09, and 30-35) were investigated. Table I shows the definitions for dust codes 06, 07, and 30-35, derived from Iranian meteorological reports. Also, dust frequency is the number of reported dust codes in a day. Normally, weather codes are reported eight times every day at an interval of 3 h.
Table I Dust-related current WMO weather codes.
| 06 | Widespread dust in suspension, not raised by wind at or near the station during observation. |
| 07 | Dust or sand raised by wind at or near the station at the time of observation. |
| 30-32 | Slight or moderate sand or dust storms. |
| 33-35 | Severe sand or dust storms. |
Lastly, PM10 concentrations (in µg m−3) from five stations around Urmia Lake that are part of the Iranian Department of Environment air pollution monitoring network during the dust storm days (see Fig. 1) were analyzed to examine the impact of the dust storm over the five stations. Moreover, they were used to compare qualitatively with the WRF-Chem model simulations.
3.2 WRF-Chem model
The Weather Research and Forecasting model coupled with Chemistry (WRF-Chem) is used frequently for simulations and predictions, air quality, and dispersion of aerosols and pollutants (Kawamura, 1951; Marticorena and Bergametti, 1995; Kok et al., 2014). In this study, WRF-Chem (v. 3.9) was used over a simulation domain of 25-40º N, 35-65º E, with horizontal resolution of 21 km and 32 vertical sigma levels (from 1000 to 10 hPa). The Global Forecasting System (GFS) reanalysis produced by NCEP at 0.5º × 0.5º horizontal resolution (~55 km by latitude and 44-50 km by longitude at the domain’s latitude range) every 6 h was used for the initial and boundary conditions. Table II shows the WRF-Chem model schemes used for this study. During the study period, a vertical profile of increasing dust was also simulated over the Urmia Lake area using the WRF-Chem model, as well as AFWA and GOCART dust schemes. Furthermore, dust storm generation and propagation were investigated in the Middle East region by two dust schemes of the WRF-Chem model.
Table II WRF-Chem model schemes used in this study.
| Microphysics | WRF Single-Moment 5-class scheme (Hong et al., 2004) |
| Longwave radiation | RRTM scheme (Mlawer et al., 1997) |
| Shortwave radiation | Goddard shortwave (Chou and Suárez, 1994) |
| Surface physics | Noah Land Surface Model (Niu et al., 2011) |
| Planetary boundary layer | Yonsei University scheme (Noh et al., 2002) |
| Cumulus | Grell 3D (Grell 1993; Grell and Dévényi, 2002) |
| Dust schemes | AFWA and GOCART schemes |
3.2.1 AFWA dust scheme
The Air Force Weather Agency (AFWA) dust emission scheme (Marticorena and Bergametti, 1995) composed of three main components including threshold friction velocity, saltation flux and bulk vertical dust flux, was used for simulations of dust emissions and transport. The flux of dust particles is calculated following Kawamura (1951):
where H(D P ) is the saltation flux, D P is the diameter of dust particles, ρ a is the air density, C is a dimensional tuning constant (1mgS 2 m -5 ), is the friction velocity and u t * is the threshold friction velocity. The threshold friction velocity is very sensitive to surface conditions such as soil moisture, roughness, clay and sand fractions, and salt components in the soil (Kok et al., 2014). The following expression represents the concentration of the dust flux triggered by saltation:
where α is the sandblasting efficiency factor and Erod is the erodibility function that depends on the clay fraction in the soil (Gillette and Passi, 1988):
3.2.2 GOCART dust scheme
The Goddard Chemistry Aerosol Radiation and Transport (GOCART) dust scheme (Ginoux et al., 2001) comprises vertical dust flux, threshold friction velocity, and wind speed at 10 m. The vertical mass flux of dust at surface in the GOCART model is calculated following Gillette and Passi (1988):
where C is a dimensional factor equal to 1.9 µgS 2 /m 5 , S is the source function, u 10 is the horizontal wind speed at 10 m, u t * is the threshold velocity (under which emissions are = zero), and s p is the fraction of each size class, considered as 0.1 for the smallest particles and as 0.25 for the rest. S is the function of soil erodibility, expressed as follows:
where z i is the altitude of cell, and z max and z min are the maximum and minimum elevations in the surrounding 10º × 10º topography.
3.3 Case study of long-range dust transport
3.3.1 Location of dust sources recorded in the Lake Urmia region during the dust storm
Using the NOAA HYbrid Single-Particle Lagrangian Integrated Trajectory (HYSPLIT_4) model (Draxler and Hess, 1998; Stein et al., 2015) and NCEP Global Forecasting System (GFS0.5) gridded meteorological data with 0.5º × 0.5º resolution from the NOAA archive (ftp.arl.noaa.gov/pub/archives/gdas0p5), the 3-day backward trajectories of air particles arriving at levels 1/5H 0 , 2/5H 0 , 3/5H 0 , 4/5H 0 and H 0 (where H 0 is the height of the upper boundary of the mixed layer above the station at the moment of PM10 measurement) were calculated for the five studied weather stations (Urmia, Tabriz, Bokan, Sardasht, and Khoy) in the Urmia Lake region, using the algorithm described by Shukurov et al. (2018). The backward trajectories started at the indicated altitudes every hour in the interval from 15:00 UTC on April 23, 2017 to 09:00 UTC on April 26, 2017.
Using the methodology of Shukurov and Chkhetiani (2017), based on five arrays of 3-day backward trajectories, the average (over all stations) field of the regional probability of air particle transport over the surface (P [%]), was reconstructed. In the transport area, air particles can move both in the free troposphere and within the atmospheric boundary layer, almost the same as in the mixed layer of the atmosphere. Since some dust-emitting surface was considered the most probable source of aerosols detected on the days under study, the P-field was additionally reconstructed based on sections of the backward trajectories that moved into the mixed layer over the air particle transport area. Over the dust sources, the mixed layer of air (according to its definition) is mostly impacted by dust emissions that contain mostly dust load as compared with the mixed layer over non-dusting surfaces. So, the hypothesis was that if we calculated the mean probability field using the sections of trajectories that moved into the mixed layer, the potential areas of dust emissions could be detected.
The concentration-weighted trajectory (CWT) (Hsu et al., 2003) method was used to reconstruct the spatial distribution of the average regional contribution to PM10 measured at the selected stations over the studied period. The CWT method is widely used to detect (locate) remote sources of long-lived atmospheric impurities (including aerosols) on the basis of in situ measurements (Cheng et al., 2013; Dimitriou, 2015; Shukurov and Shukurova, 2017; Zachary et al., 2018; Li et al., 2020). In this work, hourly PM10 measured at the selected stations during the studied period were used as trajectory weights. The deposition rate of particles of different sizes included in PM10 can be estimated using the Stokes law for the velocity of a particle in a viscous matter. Large particles (7-10 µm), which make the most significant contribution to PM10, deposited relatively quickly in about 0.5 days from a height of 1 km. At the same time, the average mixed layer depth in the area of air transport to the Urmia Lake region reached 2-2.5 km in the daytime. Thus, large particles could be uplifted by convection to such a height from which they would fall for at least a day. Therefore, only the first days of the 3-day backward trajectories were used to calculate the fields of contribution to PM10 by the CWT method. The average field of the contribution to PM10 was calculated by averaging all the stations’ data.
3.3.2 Impact assessment of dust from the Urmia Lake region on the surrounding areas
To estimate the most probable ways of dust transport from the mixed layer over the studied stations, 3-day forward trajectories of air particles were calculated for the same heights for each of the five studied weather stations. In the case of forward trajectories, the CWT method produces the spatial distribution of the average contribution of PM10 (observed at the studied stations on April 23-26, 2017) into the aerosol load of the air transport area over the surrounding and remote territories. As in the case of backward trajectories, the first days of the 3-day forward trajectories were used to estimate the contribution of observed PM10 to the aerosol load of the air transport area outside the Urmia Lake region. In other words, using forward trajectories (starting from the source point) instead of backward (starting at the receptor point) allows estimating the spatial distribution of potential dust-impacted regions. In addition, based on 3-day forward trajectories, the fields of the average travel time (t [h]), and the average height of the air particle above the surface (H [km]), in the transport area were reconstructed.
4. Results and discussion
4.1 General investigation
The temporal and spatial distributions of dust occurrence around Urmia Lake and synoptic reports of 33 weather stations (14, 11, and eight stations in east and west Azerbaijan and Kurdistan province of Iran, respectively) were investigated from April 23 to 25, 2017. The data obtained from the weather stations from 03:00 to 15:00 UTC with report code numbers 06 and 07 for all stations in this interval have been considered. Wind speed and direction, and dust frequency in the studied period indicated that the dust storms started sporadically in the southern and eastern parts of the lake on April 23 (Fig. 2). The highest dust frequency was observed over Iraq on the same day. On April 24, the number of local dust events increased mainly in the southern and eastern parts of the lake, while on April 25, the dust was observed only in the southwest-northeast corridor.
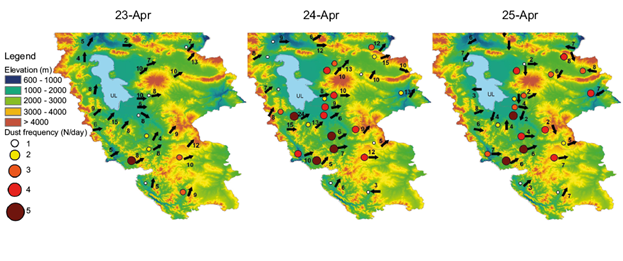
Fig. 2 Study area with topography and some synoptic weather stations and air pollution monitoring stations in Urmia Lake area in northwest Iran (Salmas and Urmia stations located to the west of the lake, Bonab and Tabriz located to the east, and Bokan and Sardasht located to the south).
Visibility reduction due to dust was observed at 06:00 and 12:00 UTC on April 25 as shown in Figure 3a, b. The visibility images were taken from the Northern Africa-Middle East-Europe (NA-ME-E) Regional Center website (https://sds-was.aemet.es). A substantial visibility reduction was observed at some synoptic stations in an extensive part of Saudi Arabia, Iraq, and west and northwest Iran (Fig. 3a, b). The average visibility, both at 06:00 and 06:00-12:00 UTC was in the range of 2-5 km over Urmia Lake.
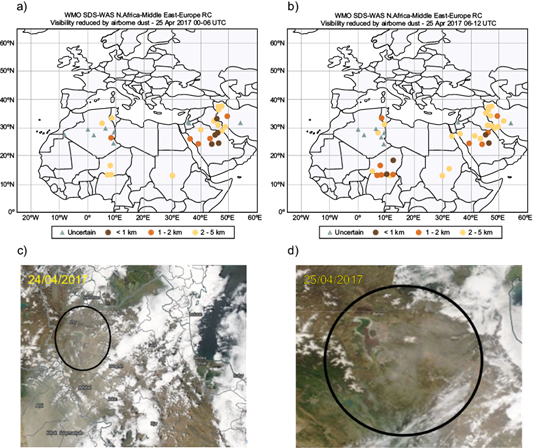
Fig. 3 Visibility reduction in the Middle East and North Africa at (a) 06:00 UTC and (b) 12:00 UTC on April 25, 2017; and MODIS/TERRA true color images on (c) April 24, 2017, and (d) April 25, 2017.
Figure 3c, d show Terra MODIS RGB imagery during the dust storms on April 24-25. On April 24 a saline dust storm originated from Urmia Lake, covered northwest Iran due to south-westerly winds and continued to the northeast over the Caspian Sea (Fig. 3b). The southwest wind direction is dominant over Urmia Lake in northwest Iran (Fig. 4a, b), so saline dust storms from Urmia Lake mainly affect western Iranian cities and the Caspian Sea (Habibi et al., 2021; Hamzeh et al., 2022).
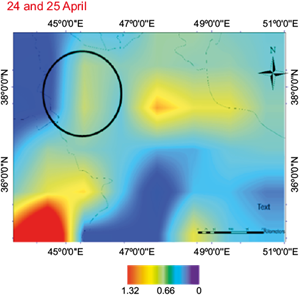
Figure 4a shows the spatial distribution of the aerosol optical depth (AOD) at 550 nm, AOD550, as obtained from Terra-MODIS (C6.1, combined dark target and deep blue; level 3) on April 24-25, 2017. The average AOD for the two days was high (approximately 0.9) over Urmia Lake, which depicted high dust aerosol loading in the atmospheric column over this area.
4.2 Synoptic-scale and local atmospheric circulations
To examine the large pressure patterns and local atmospheric circulations of the heavy dust episodes of April 24, 2017, MSLP, wind speed, air temperature, geopotential height fields at 850 hPa and 500 hPa levels, jet stream at 200-hPa level, instantaneous 10-m wind gust and 10-m wind vectors were investigated from April 23 to 25.
Pressure patterns at 12:00 UTC on April 23 showed a vast low pressure extended over the eastern Black Sea and Iraq (L1 an L2 with blue shaded color area in Fig. 5a). Two high-pressure systems (H1 and H4) were expanded over the two sides (west and east) of the elongated low-pressure system (blue isobar lines in Fig. 5a). At the 850hPa level (Fig. 5b), a low system (L1) was centered over the eastern Black Sea, with two shortwave troughs (over the northwest of Iran and east of Turkey), and a high gradient temperature and cold advection (cold front) over the east of Turkey and Syria. Furthermore, almost similar to the compression MSLP pattern, there were two high systems (H1 and H2) over two sides of the low system (Fig. 5b).
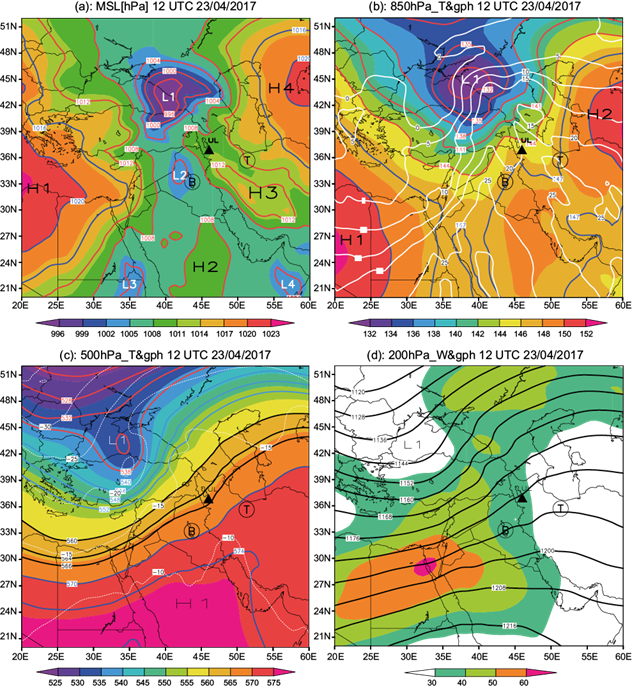
Fig. 5 Mean sea level pressure (MSLP), and 850, 500 and 200-hPa analyses for 12:00 UTC on April 23, 2017. (a) MSLP (shaded in legend and solid color contours [interval is 3 mb]); (b) 850-hPa geopotential height (shaded in legend and solid red and blue contours [interval is 3 gpm]) and temperature (solid white lines [interval is 5 ºC]); (c) 500-hPa geopotential height (shaded in legend and solid red, black and blue contours [interval is 3 gpm]) and temperature (dotted white lines [interval is 5 ºC]), and (d) 200-hPa geopotential height (solid black contours [interval is 8 gpm]) and isotachs (m s-1 for more than 30 m s-1 shaded in legend). H and L indicate high and low systems and T and B inside the black circles indicate the position of Tehran and Baghdad. UL and the solid black triangle indicate the position of Lake Urmia.
Geopotential height at 500 hPa level (Fig. 5c) shows a low-pressure system (L1) centered over the Black Sea, with a very long wave trough and a strong gradient contour (solid black contours) expanded over the southeast and east of the Mediterranean Sea, where a shortwave trough was located over the southwest of the Urmia Lake. This trough can be considered one of the most critical large-scale circulations of dust storms in this region (Fig. 5c).
At the 200 hPa level, two jet streams were located over the northeast of the Black Sea and southeast of the Mediterranean Sea, with wind speeds up to 60 m s-1 in the northeast African region (Fig. 5d). As the polar jet stream and its area of the jet stream swing over a developing mid-latitude cyclone, an area of divergence pulls warm surface air upward. In this respect, Iraq and western Iran are located on the left side exit of the jet streak (the area of upper divergence), which has suitable conditions to strengthen low pressure and updraft motions. Based on these conditions, a cold front was located over eastern Turkey and Syria regions. The cold front was moving from the southeast toward the northwest and had an essential role in producing severe dust storms and delivering the suspended particles over western Iran.
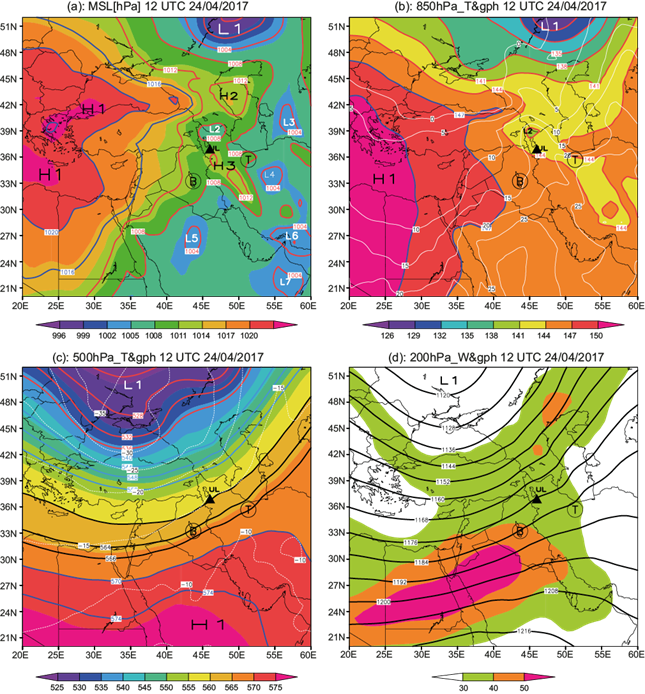
Figure 6 shows the pressure patterns during the development of the severe dust storm on April 24, 2017. The pressure at 12:00 UTC on April 24 in comparison to the previous day (12:00 UTC on April 23) showed that the low-pressure system (L1 in Fig. 5a) over the Black Sea moved toward the northeast and weakened the low pressure (L2) located in the north of Urmia Lake, with a developed open-wave mid-latitude cyclone (inverted trough) from the southern Caspian Sea to the northwest of Iran (Fig. 6a).
The geopotential height at 850 hPa level shows a weak low (L2) centered over the north of Urmia Lake, and a temperature gradient was observed over the northwest of Iran (Fig. 6b). A 500-hPa long-wave trough was located over the southeast of the Mediterranean Sea, with a contour gradient extended from the southern Mediterranean Sea to the northwest of Iran (Fig. 6c). Since the jet stream moved eastward, northern parts of Iraq and northwest Iran are located on its left exit region (Fig. 6d), which is associated to the divergence at the upper levels and, hence, the convergence at the lower tropospheric levels. Synoptic forcing creates a strong wind over a wide area, most commonly causing dust storms.
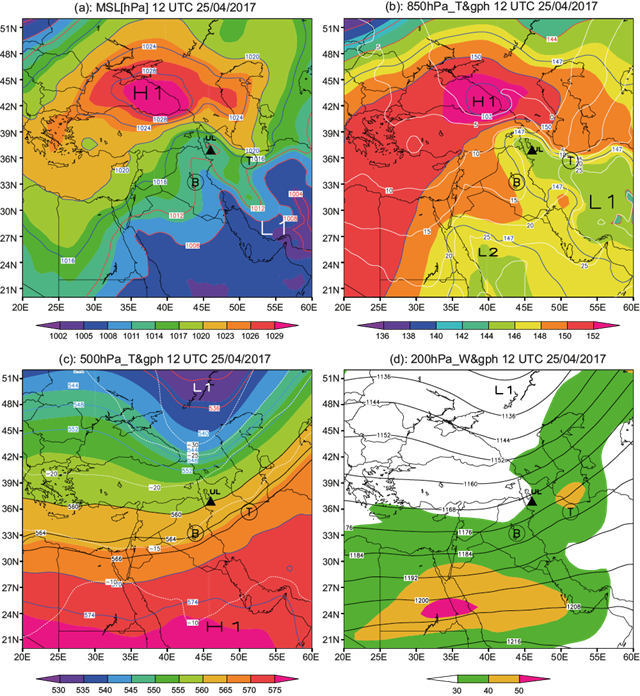
On April 25 a high-pressure system (H1) was centered over the Black Sea and expanded towards the Caspian Sea, with a ridge over the Zagros Mountains (Fig. 7a). The low-pressure troughs were located over the center and north of the Persian Gulf (L1), with a strong pressure gradient over its northwestern portions. A strong temperature gradient at the 850-hPa level dominated over the north of Iran, southeastern Iraq, and northeastern Saudi Arabia (Fig. 7b). At the 500-hPa level, a long wave trough (solid black contour) with a weak contour gradient still dominated over northwest Iran (Fig. 7c). The 200-hPa geopotential height showed a long wave trough over Iraq and the jet streams moved towards the east, where the left side exit region of the jet streak (upper divergence region) was located over western Iran (Fig. 7d).
Wind fields and geopotential heights of 850 hPa for April 23-25, 2017 with a 6-h time step are shown in Figure 8. On April 23 (Fig. 8a-d), a trough (L) at 850 hPa from the northern latitudes located between two high systems was extended over the Urmia Lake. Therefore, southwesterly winds prevailed over the lake. In the following hours, the high system (H) in southeastern Turkey weakened, and the ridge continued from western Iran and southeastern Iraq to southeastern Turkey (Fig. 8a). From 00:00 to 12:00 UTC (Fig. 8a, b), clockwise winds were strengthened over the lake, so that strong southwesterly and southerly winds prevailed over the lake at 12:00 and 18:00 UTC (Fig. 8c, d). It seems that on the lake, due to the canalization of streams, the wind speed increased significantly compared to adjacent areas.
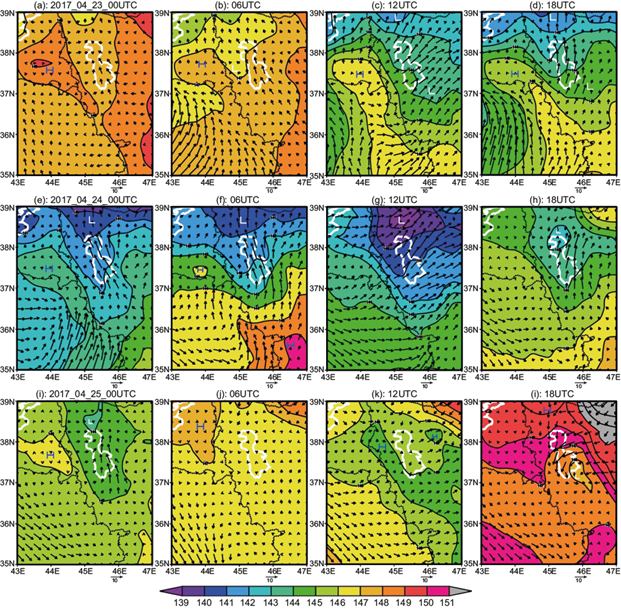
Fig. 8 Dynamic patterns of ERA5 geopotential height (shading and solid contours [gpm]) and wind vectors (black arrows [m s−1]) at 850 hPa for different times (in 3-h steps) on April 23-25, 2017. H and L indicate high and low systems. The border of Lake Urmia is shown in white.
On April 24 (Fig. 8e-h) the evolution of the low system (L), strengthening and moving towards the southern latitudes of the trough, was observed over the north of the lake. The ridges on both sides of the trough were weakened compared to the previous day. The wind speeds increased over the lake, but the wind direction variations were the same as the day before (before noon, southeasterly winds, in the afternoon southwesterly winds, and in the early night, southerly winds). On April 25 (Fig. 8i-l), the low- system (L), contour gradients, and winds over the lake became very weak, especially during the day. Early in the night, a low-pressure system formed on the southern and southeastern parts of the lake, with strong easterly and northeasterly winds prevailing in the area due to the high contour gradients.
The decrease in pressure level heights from northern latitudes to Urmia Lake indicates the strengthening of the trough in this area from noon of April 23 (Fig. 8c) to the afternoon of April 24 (Fig. 8g), when it reached to its maximum. The strengthening of this low-pressure system increased atmospheric instability and created strong winds in the area, leading to local dust storms around Urmia Lake.
At 00:00 UTC on April 24, a band of strong gusty winds was observed on the border of Iran with Turkey and Iraq, and a strong southeast wind on the central and southeastern parts of the lake (Fig. 9e). During the day, wind speed on the lake was weaker than over the surrounding areas (Fig. 9f, g), so very strong gusty winds prevailed in the western and eastern parts of the lake, and dust events were reported in most synoptic stations located in the east and southeast of the lake. The wind speed decreased significantly at night and the next day (April 25) (Fig. 9h-k).
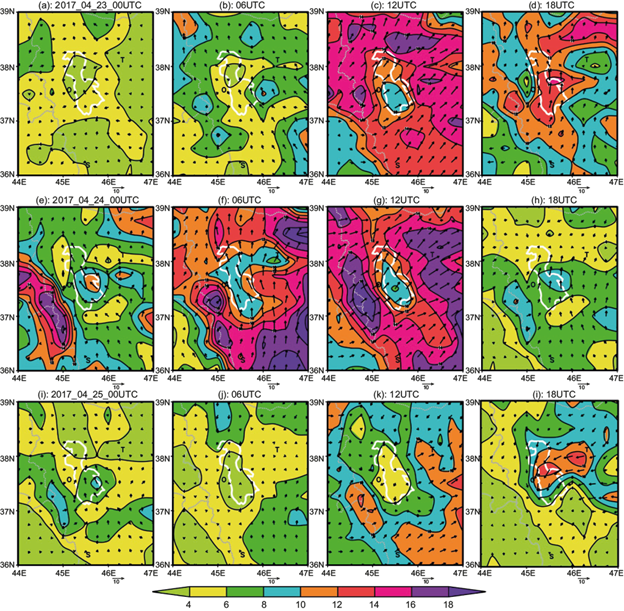
Fig. 9 Instantaneous 10-m wind gusts (shading and solid contours [m s−1]) and 10-m wind vectors (black arrows [m s−1]) for different times (in 3-h steps) on April 23-25, 2017. The border of Lake Urmia is shown in white.
On April 24 a very heavy and intense dust started from the south and southwest of the lake. Later during the day, dust affected all the lake surroundings due to intensified wind speed. The highest frequency and intensity of dust was reported in the southern and eastern regions of the lake, while in the western and northern parts less frequent dust was reported. Due to strong winds in the west, south, and east of the lake, plus the reported dust events, the potential for dust events was lower in the western areas compared to the south and east of the lake. Given the widespread dust events in Iraq and the synoptic pattern and topographic conditions in the region, it is clear that some of the reported dust events downstream of the southwestern currents were of foreign origin.
Depending on the wind direction and topography, dust particles were transported from the western borders through the corridor of the southwest-northeast direction. On the afternoon of April 23 and 24, the strong winds generated local dust storms around the lake. However, the heterogeneous distribution of dust occurrence frequency might be due to variations in soil characteristics (moisture, type, and texture) around the lake, and also due to suspended particles transported from Iraq and local dust storms.
The synoptic study aimed to evaluate the relative contribution of large-scale atmospheric circulation to local dust storms over Urmia Lake. The results demonstrate that the strong wind depends on large-scale atmospheric patterns, so strengthening the low-pressure system and creating a strong contour gradient can lead to local dust storms. In addition, local factors such as topographic effects can also play an important role in this regard. Synoptic patterns with cyclonic curvature favor dust storms, while anticyclonic patterns inhibit the build-up of regional storms.
Several studies (e.g., Ekström et al., 2004; Tao et al., 2006; Karami et al., 2021b; Khansalari et al., 2021; al-Abbasi et al., 2023) considered large-scale synoptic features that contribute to dust storms. These studies often identify characteristics such as upper troughs and pressure gradients at the surface (between low and high-pressure systems) and the passage of a cold front without precipitation for these synoptic patterns. These findings are consistent with this study, which also determined the role of mid-tropospheric short-wave troughs as primary triggers for local dust storms in the studied area, in addition to identifying the characteristics of synoptic patterns that produce dust storms, which are one of the most influential factors in lifting suspended particles from dry lake surfaces.
4.3. WRF-Chem model simulation
Figure 10 shows dust concentration (µg m−3) and air relative humidity (RH [%]) outputs from the WRF-Chem model with the AFWA and GOCART dust schemes over Urmia Lake during the dust storm. The longitude-vertical cross sections were performed along 37º N, where Urmia Lake is located (37º-38º N). At 12:00 UTC on April 24, none of the two dust schemes showed severe dust rising from the lake, and also low RH was observed.

Fig. 10 Simulations of longitude-vertical cross-section of dust concentration (white mean < 200 µg m−3, red mean > 500 µg m−3) with relative humidity (solid black contours [%]) from the WRF/Chem model at 37º N from the AFWA (first row) and GOCART (second row) dust schemes at 12:00 UTC on (a, c) April 24, 2017 and (b, d) April 25, 2017.
At 12:00 UTC on April 25, the AFWA and GOCART dust schemes showed high dust rising between 41º-47º E; however, the latter showed a higher dust concentration (> 1450 µg m−3) rising vertically more than 5 km as compared to AFWA (PM10 = 1000 µg m−3, vertical height = 6 km). Both simulations revealed that RH decreased simultaneously with dust rising over Urmia Lake.
PM10 simulations with the AFWA and GOCART dust schemes of WRF/Chem during the dust event at 12:00 UTC on April 24 and 25 are shown in Figure 11. Differences are generally detected between the model outputs in the magnitude and spatial distribution of the PM10 concentration. The GOCART dust scheme simulated more dust concentration than AFWA over Iraq, north Saudi Arabia, the Persian Gulf, and west and northwest Iran. The dust storm propagation patterns are very similar for both dust schemes, and both simulations showed more PM10 concentration over northwest Iran and Urmia Lake on April 24, which is in agreement with measured PM10in some air pollution stations in northwest Iran and around the lake (Fig. 12). Very high PM10concentrations above 1500 µg m−3 are usual in the Middle East and Arabian Peninsula during the extreme dust events (Maghrabi et al., 2011; Saeed et al., 2014; Hamzeh et al., 2021a, b; Karami et al., 2021c; Abadi et al., 2022).
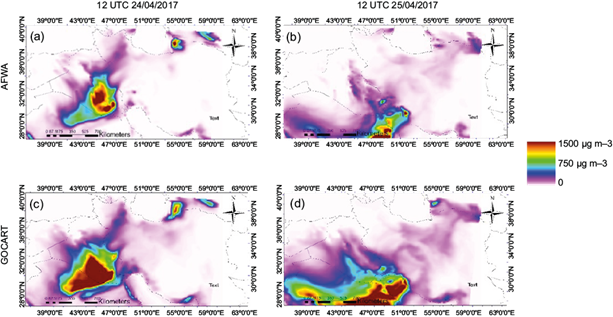
Fig. 11 Propagation patterns of PM10concentrations (colored in legend [µg m-3]) of the WRF-Chem model from the AFWA (first row) and GOCART (second row) dust schemes at 12:00 UTC on (a, c) April 24, 2017 and (b, d) April 25, 2017.
Both dust schemes simulated dust emissions from northwest Saudi Arabia and the eastern part of Iraq; however, the high PM10 concentration over northwest Iran could be originated from local sources (Urmia Lake and its surrounding areas) and transboundary dust from the deserts in the Arabian Peninsula. More insight about the source contribution of PM10over northwest Iran is discussed in section 4.2.1.
Figure 12 shows the changing dynamics of measured and simulated PM10 concentrations at the five air pollution monitoring stations around Urmia Lake from April 23-26. During this dust episode, the visibility decreased to less than 3 km at many weather stations in northwest Iran. WRF-Chem simulations with the GOCART dust scheme revealed a sharp increase in PM10 levels (up to 700 µg m-3 in Sardasht station and 500 µg m-3 in Bokan station in the south of Urmia Lake, and nearly 350 µg m-3 in Tabriz station in the east of the Urmia Lake). Also, WRF-Chem simulations with the AFWA dust scheme showed a sharp increase in PM10 levels on April 23 and 24 at the five stations. Although the graph fluctuations of AFWA and GOCART dust schemes are the same, GOCART overestimated PM10 concentrations at Khoy, Sardasht, and Tabriz stations, with mean bias errors (MBR) of 14.79, 103.43, and 9.84 µg m-3, respectively, compared to station data. The AFWA dust scheme simulation was more compatible with measured PM10 at five air pollution monitoring stations around Urmia Lake.
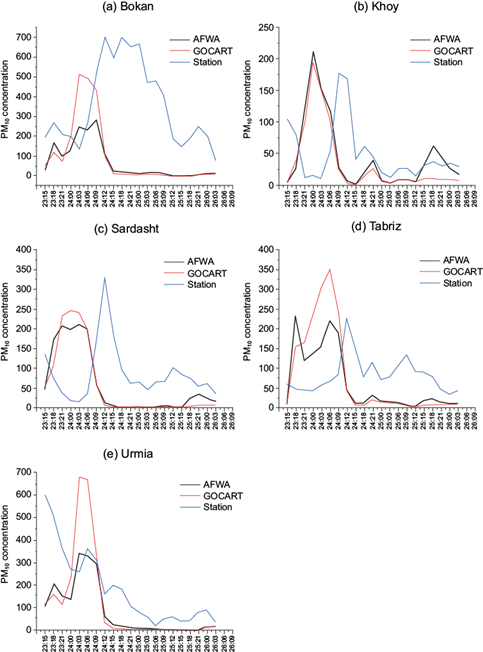
Fig. 12 Measured (blue lines) and simulated PM10 concentrations (µg m-3) of WRF-Chem model from AFWA (black lines) and GOCART (red lines) dust schemes for five weather stations: (a) Bokan, (b) Khoy, (c) Sardasht, (d) Tabriz, and (e) Urmia City on April 23-26, 2017.
Furthermore, both PM10simulations showed high and low consistency with observed data over all sites. Both simulations underestimated PM10, mainly over Bokan (MBE = -260 for AFWA and -234 for GOCART). This suggests that simulating the dust storm at Urmia Lake in northwest Iran is very challenging for the WRF/Chem model due to its complex topography (elevation = 1271 masl, surrounded by high mountains of up to 3716 masl). Other studies also report that complex topography affects dust simulation (Hamzeh et al., 2021b) A study over central Asia (Hamzeh et al., 2019) reported that among five WRF/Chem dust schemes, AFWA better simulated dust emission and propagation in some parts of the area compared to GOCART and Shao dust schemes (Shao et al., 2004, 2011).
4.4. Potential sources of PM 10 observed during the dust storm
Figure 13 shows the results of backward trajectory analysis of air transport to the Urmia Lake region on April 23-26, 2017. Figure 13a shows the regional probability of air particle transport to the studied region in the troposphere. Before arriving to the Urmia Lake region, air particles had most likely moved over Iraq, Syria, the eastern Mediterranean, southern Turkey, and southern Europe. The area of the most probable air transport to the Urmia Lake region is twisted counterclockwise since it was located on the southern periphery of the low-pressure system, the center of which moved on those days over the Black Sea from west to east (Figs. 5-7). The air was much less likely to come from southern Iraq and north of the Arabian Peninsula (Fig. 13a). At the same time, this southward clockwise air transport dominated in the mixed layer (Fig. 13b), which, apparently, was driven by increased pressure (anticyclone) over the Arabian Peninsula (Figs. 5-7).
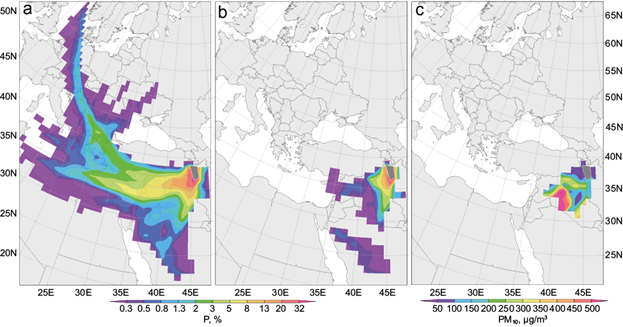
Fig. 13 (a) Average probability of tropospheric transport of air particles over the surface during their movement to Urmia Lake on April 23-26, 2017 (by three-day backward trajectories). (b) Same as in (a), but for the mixed layer only (by three-day backward trajectories). (c) Average regional contribution to PM10 (potential dust sources) registered in the Urmia Lake region on April 23-26, 2017, based on one-day backward trajectories. The Urmia Lake region is indicated with a dark gray pentagon.
The most significant contribution to the aerosol load of the mixed layer over the Urmia Lake region during the dust storm (> 500 μg m-3), was provided by the area of the Syrian Desert located in southwestern Iraq (Fig. 13c). Such high PM10 values were recorded at the southern weather stations Bokan and Sardasht (Fig. 12a, e), so the southwest of Iraq could probably influence the south of the Urmia Lake region. It is highly likely that the northern weather stations (Urmia, Tabriz, and Khoy) were affected by a mixture of dusty air from the western periphery of the anticyclone centered over the Arabian Peninsula and relatively clean air from the southern periphery of the cyclone centered over the Black Sea. Hence, the influence of the Iraqi part of the Syrian Desert on the northern weather stations of the Urmia Lake region was not as significant as on the southern ones.
4.5. Potential discharge areas of dust observed in the Urmia Lake region during the dust storm
The southern and eastern peripheries of the low-pressure system on April 23-26, 2017, determined the further movement of air particles from the Urmia Lake region (Fig. 14). Most likely, dust-loaded air moved away from the Urmia Lake region along the southern periphery of the low-pressure system, first eastward over the Iranian province of Western Azerbaijan and the Caspian Sea (Fig. 14a). Subsequently, the direction of aerosol propagation changed to the north, and about a day later, air from the Urmia Lake region crossed the Caspian Sea and reached the southwest of Kazakhstan and the northwest of Uzbekistan. After two days, it reached the southern regions of Russia near the Urals, and a day later it reached Russian regions in western Siberia (Fig. 14a, b).
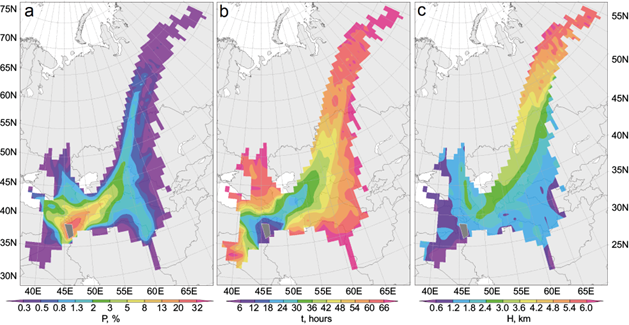
Fig. 14 (a) Average probability of tropospheric air transport over the surface (P [%]), of air particles starting on April 23-26, 2017, in the mixed layer over the Urmia Lake region (by three-day forward trajectories). (b) Average travel time (t [h]), for air particles starting on April 23-26, 2017, in the mixed layer over the Urmia Lake region (by three-day forward trajectories). (c) Average height (H [km]) of the movement of air particles starting on April 23-26, 2017, in the mixed layer above the Urmia Lake region (by three-day straight trajectories).
The average height of air particles movement increased with distance from the Urmia Lake region (Fig. 14c). Over Western Azerbaijan, the air moved at altitudes up to ~2 km (i.e., given the average height of the mixed layer in the daytime, air particles could enter the mixed layer in this region during the day). Later, over the Caspian Sea and Kazakhstan, the transport height increased to 3-4 km, and over Russia to 5-6 km (Fig. 14c), so the dust from the Urmia Lake region could affect mostly the free troposphere above these countries. Since there was uplift and an increase in the lifetime even for large PM10 particles, these were able to reach territories located more than one day away (according to the movement of the particles) from the Lake Urmia region.
Figure 15a shows potential discharge areas of large PM10 particles according to the analysis of one-day forward trajectories. Figure 15b shows a qualitative assessment of the spatial distribution of aerosol contribution to surrounding and remote territories registered in the Urmia Lake region on April 23-26.
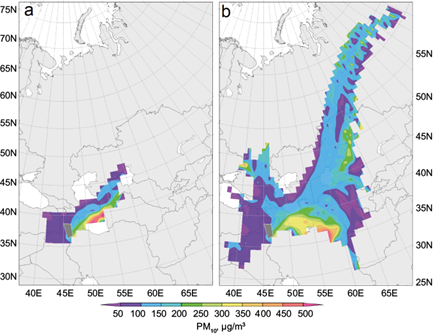
Fig. 15 (a) Average regional contribution of PM10(potential dust discharge) to the aerosol load in the area of air transport out of the lake, recorded in the Urmia Lake region on April 23-26, 2017 (by one-day forward trajectories). (b) Qualitative assessment of the potential contribution of aerosol to the aerosol load in the area of air transport from the lake (by three-day forward trajectories), registered in the Urmia Lake region on April 23-26, 2017. The legend refers only to (a).
PM10 detected over the Urmia Lake region on April 23-26, 2017, mainly influenced Western Azerbaijan, the south of the Caspian Sea, southwest Kazakhstan, northwest Uzbekistan, and west Turkmenistan (Fig. 15a). The dustiest air masses (PM10> 400 µgm-3) affected the south of the Caspian Sea and apparently Western Azerbaijan. Later, on the second or third day, heavily dusty air (highly likely with the loss of large PM10 particles) moved clockwise from the south of the Caspian Sea to Khorasan province in eastern Iran (Fig. 15b). Particles of the PM5 fraction derived from the initial PM10were able to reach this region, located 2.5-3 days away from Urmia Lake (Fig. 14b). Afterwards, air particles moving to the northeast from the Caspian Sea ascended significantly, favoring the increase in the fallout time of aerosol particles. Next, aerosols from the Urmia Lake region reached the troposphere over Kazakhstan and Russia (Fig. 15b).
5. Conclusions
During April 23-26, 2017, large dust particles were uplifted from deserts in Syria and Iraq, along with the local saline dust from Urmia Lake. The dust storm originated in southern Iraq, Saudi Arabia, and the northern part of the Arabian Peninsula, affecting the southwest and western parts of Iran. In contrast, local dust storms were generated over Urmia Lake and affected its eastern parts. The severe dust storm in April 2017 caused sharp visibility reduction in the northern half of Saudi Arabia, the eastern half of Iraq, and the southwest, northwest, and west of Iran at 06:00 and 12:00 UTC on April 24.
The emitted widespread dust and the suspended particles over western parts of Iran were driven by a strong eastern Black Sea cyclone and a low-pressure over Syria and Iraq, which in conjunction with a vast high-pressure system at the rear created a cold front. Mid and upper quasi-stationary long- and short-wave troughs, which were embedded in the long waves, were the main forcings for large-scale dust storms in Iraq and local dust storms around the Urmia Lake. Due to strong winds, local dust storms were created around the lake, and the 10-m threshold wind velocity to local dust raising for these regions was about 14 m s-1.
The most significant contribution to the aerosol load of the mixed layer over the Urmia Lake region during the dust storm (PM10 > 500 μg m-3) originated from an area of the Syrian Desert located in southwestern Iraq. The high PM10 values recorded at the southern weather stations (Bokan and Sardasht) indicated that the south of the Urmia Lake region was mainly affected by the dust from Iraq. The northern weather stations (Urmia, Tabriz, and Khoy) were likely affected by a mixture of dusty air from the western periphery of the anticyclone centered over the Arabian Peninsula and relatively clean air from the southern periphery of the cyclone centered over the Black Sea. Therefore, the influence of the Syrian Desert on the northern weather stations of the Lake Urmia region was not as significant as the southern ones.
PM10 recorded over the Urmia Lake region on April 23-26, 2017 mainly influenced Western Azerbaijan, the south of the Caspian Sea, southwest Kazakhstan, northwest Uzbekistan, and west Turkmenistan. The dustiest air masses (PM10 > 400 μg m-3) affected the south of the Caspian Sea and, highly likely, Western Azerbaijan and, two or three days later, the Khorasan province in eastern Iran. Since the drying of Middle East lakes is increasing, modeling the emission, propagation and deposition of dust particles, as well as synoptic investigation of dust storms accompanied by measurement of surface PM and visibility, are important for long-term mitigation policies for the destructive impact of this type of dust storms.
The WRF-Chem model simulated dust rising from the Urmia Lake up to a 5-km height at 12:00 UTC on April 25, 2017. WRF-Chem simulations with AFWA and GOCART dust schemes, as well as PM10 concentrations measured at five air monitoring stations around Urmia Lake, showed a sharp increase in PM10 levels on April 23 and 24, 2017. The graph fluctuations of AFWA and GOCART dust schemes are similar, but the GOCART dust scheme overestimated PM10 concentration at three stations (Khoy, Sardasht, and Tabriz) as compared to station data. The AFWA dust scheme simulation is more compatible with measured PM10 at the five air pollution monitoring stations around Urmia Lake. PM10 output fluctuations from both dust schemes were closer to each other than to measured surface PM10, and at all five stations the model maximum amount was simulated 12 h earlier than the maximum measured surface PM10 concentrations. Simulating the Urmia Lake dust storm looks challenging for the WRF/Chem model because of its complicated topography and its location between mountains. Overall, the WRF-Chem dust model is a valuable tool for studying and predicting dust storms in dried lake beds, but the model needs extra care due the complex topography of these lakes.
Since drying of the lakes is happening at an increasing speed in the Middle East region, attention to different methods such as modeling the emission, propagation, and deposition of dust particles, as well as investigating the synoptic characteristics of dust storms and examining data from surface concentrations and station visibility, are is important to determine long-term policies for reducing the destructive effects of these type of storms in the Middle East area.


 nueva página del texto (beta)

