


 nueva página del texto (beta)
 Inglés (pdf)
 Artículo en XML
 Referencias del artículo
 Enviar artículo por email
 Citado por SciELO
  Similares en
SciELO
Similares en
SciELO 
 Permalink
Introduction
Biological conservation is considered an important issue in sustainable forest management as a reaction to biodiversity loss (Verstraeten et al. 2013) since forest ecosystems have an essential role in the conservation of plant diversity. Plant species diversity has been recognized as an important determinant of the abundance and species richness in forest ecosystems (Barantal et al. 2019). The forest biodiversity not only responds to the changes in environmental conditions but is one of the important elements of ecosystem functions (Lucakc, 2017). Many studies have suggested that the stability of the plant community can be influenced by biodiversity where plant species richness has a strong correlation with plant species diversity in forests (Zeller & Pretzsch, 2019; Versluijs, Roberge, Eggers, Boers, & Hjältén, 2019; Barantal et al. 2019). In forest ecosystems, many factors (such as anthropogenic disturbances, physiographic factors and resources availability, etc.) influence the plant species diversity and its interaction with environmental factors (Kooijman & Cammeraat, 2010; Jafari, Tabari, Hosseini, & Kooch, 2014; Modabberi & Minaie, 2014). Many researchers have extensively reported positive relationships between biodiversity and aboveground productivity in forest ecosystems (Ali, Yan, Chang, Cheng, & Liu 2017; Prado-Junior et al. 2016; Wang et al. 2011; Zhang et al. 2017). On the other hand, soil characteristics are essential factors for driving plant species diversity in forest ecosystems (Petersen & Luxton, 1982; Enright, Miller, & Akhter, 2005; Hattenschwiler, 2005; Fujii et al. 2018). It has been reported that plant diversity has positive effects on the nutrient pools and ecosystem productivity (Midolo et al. 2018). Tree species have an essential role in protecting the soil Carbon (C) storage through the inputs of organic carbon and other nutrients via leaf litter decomposition (Prescott & Vesterdal, 2013; Kerdraon, Drewer, Castro, Wallwork, & Hall 2019). This process is an important driver for soil characteristics such as soil carbon content, nitrogen content, cation exchange capacity and pH in the forest topsoil layer (Augusto et al. 2015; Dawud et al. 2016; Bohara, Yadav, Dong, Cao, & Hu, 2019). Xiao, Chen, Kumar, Chen, & Guan, (2019) stated that tree species diversity affects the microenvironment conditions and litter decomposition rate as well as the chemical composition of the litter of overstory species which are an essential factor for the soil carbon and nitrogen content (Guendehou et al. 2014) and influencing the soil pH and nutrients (Eshaghi Rad, 2014; Lorenz & Thiele-Bruhn, 2019). Also, Bartels and Chen (2013) concluded that total nitrogen content, exchangeable phosphorus, and cation exchange capacity had a significant positive correlation with the composition of tree species in the overstory stratum. In this context, a significant positive correlation was demonstrated between tree species diversity and soil carbon content by Gamfeldt et al. (2013). Furthermore, Modabberi and Minaie (2014) indicated that the correlation between herb layers as well as tree layers and the organic matter was positive. Elsewhere, Yang et al. (2017) reported that soil carbon and nitrogen content in the forest topsoil layer had a positive effect on the herbaceous species. Kooch, Samadzadeh, & Hosseini (2017) demonstrated that tree species have a significant effect on litter quality and other soil physicochemical characteristics in the mixed stands. Bakhshandeh Navroud, Abrari Vajari and Kooch. (2018) illustrated a positive significant correlation between carbon content tree layer diversity in mature natural stands of easternforests, and deciduous broadleaved forests that are mainly located in the northern hemisphere (Mestre, Toro-Manríquez, Huertas-Herrera, Martínez-Pastur, & Lencinas, 2017) where understory vegetation has a significant effect in these forests (Ampoorter, Baeten, Koricheva, Vanhellemont, & Verheyen, 2014). Hyrcanian forests were one of the most important refuges for the temperate deciduous broadleaved forests during Pleistocene glaciations (Ramezani, Mohadjer, Knapp, Ahmadi, & Joosten, 2008), they extend to the southern and south-western coasts of the Caspian Sea (Habashi & Waez-Mousavi, 2017). In these forests, oriental beech (Fagus orientalis Lipsky.) stands and hornbeam (Carpinus betulus L.) stands represent the greatest volume (Adel, Pourbabaei, Omidi, & Dey, 2013).
Objectives
The aim of this investigation was to assess the effect of mixed beech and hornbeam stands on soil properties and plant species diversity in Hyrcanian forests which can be essential for forest ecologists and managers. Specifically, it was hypothesized that:
1) There is significant difference between mixed beech and hornbeam stands in terms of herb layer diversity indices.
2) Tree layer composition affects herb species composition and soil physico-chemical properties.
Materials and methodos
Study area
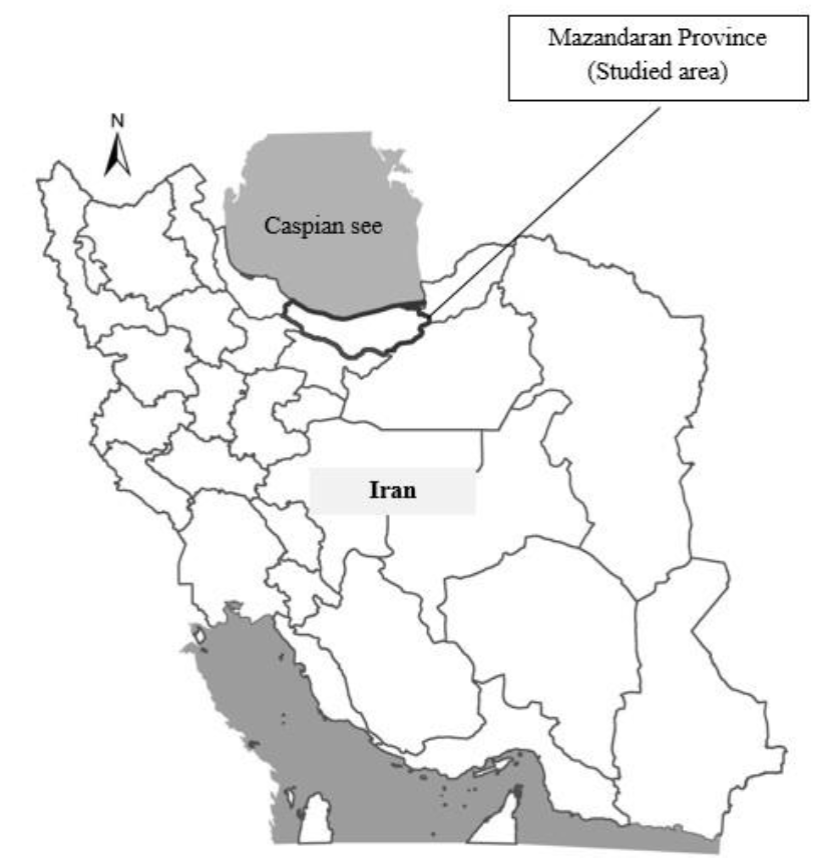
This investigation was conducted in Hyrcanian forests of northern Iran encompassing Dehga (mixed hornbeam stand) and Lakoobon (beech stand) districts (Fig. 1). Two compartments were selected in Dehga district located in the southern part of Tonekabon city. (Longitude: 50º 52′ 34 - 50º 75′ 15 ; Latitude: 36º 40′ 15 - 36º 44′ 25 ). The average annual precipitation and temperature are 1188.6 mm and 15.2 ˚C, respectively. The elevation ranges from 300 m to 400 m. The dominant overstory species are hornbeam (Carpinus betulus L.), Persian ironwood (Parrotia persica (DC.) C.A. Mey.) Lilac persimmon (Diospyros lotus L.), Caucasian alder (Alnus subcordata C.A.Mey) and Caucasian wingnut (Pterocaria fraxinifolia (Lam.) spach in mixed hornbeam stands; Oriental beech (Fagus orientalis L.), hornbeam (Carpinus betulus L.), Persian maple (Acer velutinum Boiss.), Cappadocian maple (Acer cappadocicy Gled.) and Lime tree (Tillia begonifolia stev.) are dominant tree species in beech stands. Also, two compartments were selected in Lakobone district located in the western part of Nowshahr city. (Longitude: 51º 16′ 15 - 51º 18′ 50 and Latitude: 36º 36′ 50 - 36º 40′). The average annual precipitation and temperature are 1093 mm and 12.3 °C, respectively. The elevation ranges from 800 m to 900 m. In addition to Oriental beech (Fagus orientalis Lipsky), the dominant tree species are Persian maple (Acer velutinum Boiss.), Cappadocian maple (Acer cappadocicy Gled.), hornbeam (Carpinus betulus L.) and Lime tree (Tillia begonifolia stev.).
Sampling strategy
For this study, sampled plots were established by a regular 100 m × 200 m grid (ten plots in each compartment). Percent cover of tree species was estimated by Braun-Blanquet scale in 400 m2 plots. Also, in the centre of each main plot, a 100 m2 (10 m ×10 m) subplot was set up to record herb species. Soil samples were taken from 0 cm - 10 cm and 10 cm -30 cm soil depth. For laboratory analysis, the soil samples were air-dried and passed through a 2 mm sieve. Some phisico-chemical soil properties were measured for both depths, including: soil texture (sand, silt, and clay) by the Bouyoucos hydrometer method, soil pH by pH meter, total nitrogen (N) using the Kjeldahl method and available phosphorus (mg/kg) by Olsen method. Further, exchangeable potassium (mg/kg) extracted by ammonium acetate 1 N was estimated using flame photometric method; organic carbon content (C) was measured using Walkley and Black method.
Data analysis
The Kolmogorov- Smirnov test was applied to check the data normality, and Levene’s test was applied to test the homogeneity of the data variance. T-test (normally distributed data) and Mann-Whitney U-test (not normally distributed data) were utilized to test the significant differences in the species richness, diversity, and evenness indices as well as soil properties between the mixed beech and mixed hornbeam stands. This analysis was conducted using SPSS 18. We employed cluster analysis to classify of samples based on the floristic composition data using a Sørensen distance measurement and flexible beta linkage method (Eshaghi Rad, 2014). Also, the detrended correspondence analysis (DCA) method was applied to assess the relationship between vegetation and environmental variables. Pearson correlation analysis was employed to evaluate the correlation between sample plot scores of DCA axes and environmental variables as well as species diversity indices.
The plant species diversity was estimated using species richness as number of species, Shannon-Wiener evenness, Shannon-Wiener diversity (H′) and Simpson diversity. PC-ORD software was used for calculating diversity indices and multivariate analysis.
Results
Some of the frequent species were Acer velutinum, Carpinus betulus, Fagus orientalis, Hypericum androsaemum, Athyrium filix-femina, Asperula odorata and Solanum kieseritzkii in the mixed beech stands and Ilex aquifolium, Carpinus betulus, Parrotia persica, Asplenium adiantum-nigrum, Pteris cretica and Rubus hyrcanus in the mixed hornbeam stands (Tables 1 and 2). The mean numbers of trees, basal areas, volume per hectare and DBH are provided in table 3 and 4. Fagus orientalis had the maximum number of trees (176.25 ha-1), DBH (44.30 cm), basal area (33.68 m2 ha-1), and volume (m3 ha-1) in the mixed beech stand.Also, the highest number of trees, basal area and volume per hectare belonged to Carpinus betulus trees in the mixed hornbeam stand.
TABLE 1 Relative frequency (%) of woody species in two stands (number of plots in which every species was recorded in relation to total number of plots* 100).
| Species scientific name | Beech stand | Hornbeam stand |
| Acercappadocicy Gled. | 20 | 5 |
| Acer velutinum Boiss. | 70 | 0 |
| Ilex aquifolium L. | 0 | 100 |
| Alnus subcordata C. A. Mey. | 0 | 50 |
| Carpinus betulus L. | 65 | 75 |
| Diospyrus lotus L. | 0 | 45 |
| Fagus orientalis Lipsky. | 100 | 0 |
| Fagus orientalis Lipsky | 0 | 35 |
| Parrotia persica (DC.) C.A. Mey. | 0 | 95 |
| Hypericum androsaemum L. | 70 | 35 |
| Laurocerasus officinalis Roemer | 25 | 0 |
| Danae racemosa (L.) Moench. | 10 | 0 |
| Ruscus hyrcanus Woron. | 15 | 60 |
| Rhumnus frangula L. | 10 | 0 |
| Tillia begoniifolia stev. | 10 | 0 |
TABLE 2 Relative frequency (%) of herbaceous species in two mixed stands (number of plots in which every species was recorded in relation to total number of plots* 100).
| Species scientific name | Beech | Hornbeam | Species scientific name | Beech | Hornbeam |
| stand | stand | stand | stand | ||
| Acer cappadocicym Gled. | 15 | 5 | Lamium album L. | 5 | 5 |
| Acer velutinum Boiss. | 70 | 20 | Mespilus germanica L. | 0 | 20 |
| Asplenium adiantum-nigrum L. | 5 | 10 | .Oplismenus hirtellus (L.) P. Beauv | 40 | 70 |
| .Athyrium filix- femina (L) Roth | 85 | 50 | .Polystichum aculeatum (L.) Roth | 55 | 5 |
| Alnus subcordata C.A. Mey | 20 | 5 | Petasites hybridus (L.) P. Gaertn | 10 | 0 |
| Asperula odorata L. | 95 | 0 | .Parrotia persica. C.A. Mey | 0 | 65 |
| Carpinus betulus L. | 0 | 65 | Prunella vulgaris L. | 0 | 10 |
| Carex divulsa Stokes. | 55 | 70 | Pteris cretica L. | 20 | 75 |
| Carex remota L. | 0 | 25 | Primula heterochroma Stapf. | 25 | 50 |
| .Clinopodium umbrosum (M.B.) C. Koch | 10 | 35 | Phyllitis scolopendrium (L.) Newman | 30 | 20 |
| Circaea lutetiana L. | 25 | 55 | Rubus hyrcanus L. | 15 | 60 |
| Cephalanthera caucasica Kranz. | 0 | 20 | Symphyandra odontosepala (Bioss.) Esfandiari | 10 | 0 |
| Cratagegus monogvna Jacq. | 5 | 65 | Stachys sylvatica L. | 50 | 0 |
| .Dryopteris filix-mass (L.) Schott | 80 | 30 | Solanum kieseritzkii C.A. Mey | 100 | 45 |
| Diospyrus lotus L. | 5 | 10 | Sanicula europaea L. | 20 | 10 |
| Euphorbia amygdaloides L. | 85 | 70 | Tamus communis L. | 30 | 0 |
| Epimedium pinnatum Fisch. | 40 | 5 | Tillia begoniifolia stev. | 25 | 0 |
| Fagus orientalis Lipsky. | 95 | 0 | Ulmus glabra Hudson. | 15 | 0 |
| Festuca drymeia Mert. & Koch | 25 | 0 | Vincetoxicum scandens Sommier& Levier | 20 | 0 |
| Fragaria vesca L. | 15 | 75 | Viola odorata L. | 75 | 90 |
| Gleditsia caspica Desf. | 0 | 20 | |||
| Geranium robertianum L. | 70 | 0 | |||
| Hedera helix L. | 30 | 60 |
TABLE 3 Statistical parameters for dominant species in the mixed beech stand (Mean± standard deviation).
| Total stem number/ha | DBH (cm) | Basal area (m 2 /ha) | Volume (m 3 /ha) | |
| Fagus orientalis | 176.25 (±16.67) | 44.30 (±3.67) | 33.68 (±4.28) | 464.69 (±75.02) |
| Carpinus betulus | 40.00 (±10.48) | 31.85 (±4.04) | 2.92 (±00.69) | 29.63 (±7.58) |
| Acer velutinum | 37.50 (±8.79) | 38.57 (±5.82) | 4.21 (±1.10) | 40.85 (±9.45) |
| Acer capadocicum | 6.25 (±4.00) | 31.00 (±7.55) | 0.48 (±00.30) | 5.76 (±3.79) |
| Tilia begonifolia | 3.75 (±2.74) | 17.50 (±3.50) | 0.11 (±00.9) | 1.19 (±1.11) |
TABLE 4 Statistical parameters for dominant species in mixed hornbeam stand (Mean± standard deviation).
| Total stem number (ha -1 ) | DBH (cm) | Basal area (m 2 /ha) | Volume (m 3 /ha) | |
| Carpinus betulus | 136.25 (±33.95) | 40.66 (±3.75) | 14.59 (±2.74) | 161.80 (±31.28) |
| Qurcus castanifolia | 13.75 (±6.14) | 70.50 (±12.62) | 4.78 (±1.73) | 57.64 (±22.91) |
| Alnus subcordata | 32.5 (±11.49) | 59.44 (±3.67) | 8.77 (±3.47) | 102.96 (±40.36) |
| Parrotia persica | 195.25 (±30.60) | 16.42 (±0.83) | 4.98 (±00.92) | 39.75 (±7.10) |
| Diospyrus lotus | 60.00 (±22.83) | 17.22 (±0.82) | 1.55 (±00.59) | 12.58 (±4.84) |
| Pterocaria fraxinifolia | 1.25 (±1.25) | 20.00 (±0.00) | 0.54 (±0.04) | 0.18 (±00.18) |
There were no significant differences in plant species diversity indices between beech and hornbeam stands (p-value < 0.05 based on Mann-Whitney test), (Table 5). Litter thicknesses and humus layers depth as well as the percentage of clay (in 0 cm - 10 cm depth) were significantly higher in the beech stand compared to hornbeam stand (Table 6). Further, hornbeam stands had higher means in organic carbon and total nitrogen (in 0 cm - 10 cm depth) along with percentage of sand in two depths compared to beech stands.
TABLE 5 Species diversity indices in the studied stands (Mean± standard diviation).
| Diversity indices | Beech stand | Hornbeam stand | P- value |
| Species richness | 19.15 ± 3.51 | 17.05 ± 4.23 | 0.096 |
| Shannon winner Evenness | 0.42 ± 0.13 | 0.46 ± 0.09 | 0.318 |
| Shannon- Winner (H′) | 1.24 ± 0.4 | 1.28 ± 0.26 | 0.738 |
| Simpson index | 0.54 ± 0.18 | 0.60 ± 0.12 | 0.142 |
Table 6 Soil variables in the studied stands (Mean± standard diviation).
| Soil variables | Beech stands | Hornbeam stand | P- value |
| Litter (cm) | 3.16 ± 0.59 | 1.74 ± 0.51 | 0.00* |
| Humus (cm) | 4.08 ± 1.77 | 0.55 ± 1.78 | 0.00* |
| pH1 | 5.43 ± 0.29 | 5.44 ± 0.36 | 0.96 |
| pH2 | 5.64 ± 0.44 | 5.65 ± 0.27 | 0.93 |
| OC1 (%) | 2.69 ± 0.92 | 4.63 ± 1.38 | 0.00* |
| OC2%) | 1.11 ± 0.57 | 1.30 ± 1.12 | 0.429 |
| N1 (%) | 0.27 ± 0.094 | 0.46 ± 0.13 | 0.00* |
| N2 (%) | 0.12 ± 0.05 | 0.13 ± 0.11 | 0.383 |
| C/N1 | 9.77 ± 0.22 | 9.88 ± 0.12 | 0.06 |
| C/N2 | 9.23 ± 0.52 | 9.26 ± 0.45 | 0.87 |
| K1 (Mg/kg) | 179.1 ± 62.48 | 215± 50.28 | 0.05 |
| K2 (Mg/kg) | 174.30 ± 90.19 | 152.95 ± 61.2 | 0.698 |
| P1(Mg/kg) | 3.09 ± 1.73 | 5.18 ± 2.60 | 0.05 |
| P2(Mg/kg) | 2.27 ± 2.88 | 2.64 ± 2.091 | 0.91 |
| Clay1 (%) | 30.75 ± 7.84 | 20.85 ± 3.34 | 0.00* |
| Clay2 (%) | 40.80 ± 8.53 | 38.85 ± 9.26 | 0.49 |
| Silt1 (%) | 53.50 ± 7.11 | 55.65 ± 6.40 | 0.32 |
| Silt2 (%) | 46.15 ± 7.13 | 42.70 ± 9.54 | 0.231 |
| Sand1 (%) | 15.75 ± 3.02 | 22.50 ± 6.49 | 0.00* |
| Sand2 (%) | 13.05 ± 3.08 | 18.45 ± 7.97 | 0.04* |
OC: organic carbon content, N: total nitrogen, K: potassium, P: phosphorus, 1: soil depth at 0 cm - 10 cm (first layer), 2: soil depth at 10 cm - 30 cm (second layer). * p- value < 0.05
According to the diagram of cluster analysis, there are two distinct groups (Fig. 2). A total of 20 sampled plots of the mixed beech stand were considered as the first group and 20 sampled plots of the mixed hornbeam stand were regarded as the second group.

The result of DCA analysis clearly indicated that the thickness of the litter layers and humus, sand percent, total nitrogen, and organic carbon in the first layer could be considered as effective and powerful environmental variables in the distribution of sample plots in the mixed beech stand and the mixed hornbeam stand (Fig. 3). There was no significant correlation between soil organic carbon content, total nitrogen, carbon to nitrogen ratio, exchangeable potassium, exchangeable phosphorus, or pH of second layer and DCA axis (Table 7).

TABLE 7 Pearson correlation between DCA Axes and soil properties.
| Soil variables | DCA1 | DCA2 |
| Litter (cm) | -0.826** | 0.266 |
| Humus (cm) | -0.659** | 0.221 |
| pH1 | 0.037 | -0.113 |
| pH2 | 0.013 | 0.133 |
| OC1 (%) | 0.650** | 0.027 |
| OC2%) | 0.137 | 0.149 |
| N1 (%) | 0.644** | 0.038 |
| N2 (%) | 0.134 | 0.153 |
| C/N1 | 0.335* | -0.186 |
| C/N2 | 0.091 | 0.046 |
| K1 (Mg/kg) | 0.356* | 0.014 |
| K2 (Mg/kg) | -0.094 | -0.037 |
| P1 (Mg/kg) | 0.489** | -0.184 |
| P2 (Mg/kg) | 0.180 | -0.111 |
| Clay1 (%) | -0.615** | 0.020 |
| Clay2 (%) | -0.150 | -0.370* |
| Silt1 (%) | 0.096 | 0.079 |
| Silt2 (%) | -0.195 | 0.491** |
| Sand1 (%) | 0.652** | -0.109 |
OC: organic carbon content, N: total nitrogen, K: potassium, P: phosphorus, 1: soil depth at 0 cm - 10 cm (first layer), 2: soil depth at 10 cm - 30 cm (second layer). * p- value < 0.05, ** p- value ˂ 0.01
Pearson correlation analysis revealed that the species richness index was significantly negatively correlated with the percentage of silt (R = -0.346, P < 0.05) and positively correlated with percentage of clay (R = 0.331) in first depth of soil (0 cm - 10 cm). There were no significant correlations between soil thickness of the litter layer, thickness of the humus of layer, organic carbon content, total nitrogen, carbon to nitrogen ratio, exchangeable potassium, exchangeable phosphorus, sand percentage, pH of both layers and silt, clay or percentage in the second layer on all diversity indices (Table 8).
TABLE 8 The Pearson correlation between soil variables, and the species diversity indices in the studied stand.
| Soil variables | Species richness index | Evenness index | Shannon- Winner (H′) | Simpson index |
| index | ||||
| Litter (cm) | 0.150 | 0.109 | 0.172 | 0.009 |
| Humus (cm) | 0.068 | -0.064 | -0.014 | -0.162 |
| pH1 | 0.103 | 0.155 | 0.170 | 0.135 |
| pH2 | 0.103 | 0.038 | 0.068 | 0.08 |
| OC1 (%) | -0.203 | 0.152 | 0.044 | 0.158 |
| OC2%) | -0.284 | 0.032 | 0.036 | 0.039 |
| N1 (%) | -0.200 | 0.155 | 0.047 | 0.159 |
| N2 (%) | 0.016 | -0.029 | 0.037 | 0.038 |
| C/N1 | 0.086 | -0.106 | -0.110 | -0.053 |
| C/N2 | 0.045 | -0.025 | 0.011 | 0.001 |
| K1 (Mg/kg) | 0.027 | 0.260 | 0.252 | 0.292 |
| K2 (Mg/kg) | 0.027 | 0.171 | 0.174 | 0.091 |
| P1 (Mg/kg) | -0.120 | 0.137 | 0.064 | 0.173 |
| P2 (Mg/kg) | -0.190 | 0.165 | 0.218 | 0.202 |
| Clay1 (%) | 0.331* | -0.102 | 0.006 | -0.103 |
| Clay2 (%) | -0.042 | -0.092 | -0.101 | -0.072 |
| Silt1 (%) | -0.346* | 0.016 | -0.079 | -0.039 |
| Silt2 (%) | -0.005 | 0.152 | 0.155 | 0.100 |
| Sand1 (%) | 0.051 | -0.073 | -0.064 | -0.032 |
| Sand2 (%) | -0.037 | 0.108 | 0.077 | 0.167 |
OC: organic carbon content, N: total nitrogen, K: potassium, P: phosphorus, 1: soil depth at 0 cm - 10 cm (first layer), 2: soil depth at 10 cm - 30 cm (second layer). * p- value < 0.05, ** p- value ˂ 0.01
Discussion
Our finding demonstrated that the overstory compositional dissimilarities in the mixed beech stand and mixed hornbeam stand had led to differences in the herb-layer vegetation, which is in line with the findings of Koojiman and Cammeraat (2010) in the Netherlands’ forests. The composition of understory vegetation is influenced by tree species in the overstory stratum (Rawlik, Kasprowicz, & Jagodzinski, 2018; Dölle, Petritan, Biris, & Petritan, 2017). Gilliam et al. (2007) stated that the composition of the overstory layer directly or indirectly affects the understory species by changing light availability, moisture and soil fertility. Generally, the shade of trees is an impressive feature in reducing the understory light-demanding species (Marcos, Marcos, Taboada, & Tarrega, 2007; Marozas, Augustatitis, Armolaitis, Kliucius, & Pilkauskas, 2013). It was proved that transmission of photosynthetically active rays (PAR) in the beech canopies was significantly lower than in canopies of other deciduous tree species. (Schmidt, 2005; Scolastri, Bricca, Cancellieri, & Cutini, 2017). We confirmed that this barrier had caused the establishment and development of shade-tolerant species in the understory vegetation in the mixed beech stands. Some shade-tolerant species which are adapted to low light condition such as Mercurialis perennis L., Geranium robertianum L., Asperula odorata L. were mainly observed with a high frequency in the mixed beech stand. Indeed, the canopy cover of the beech species leads to low light infiltration into the forest floor, where the relative frequency of species such as Carex remota and Clinnopodium umbrosum has decreased with increase in the ratio of the beech species in overstory layer. On the other hand, Euphorbia amygdaloides and Festuca drymeia which were light demanding species mainly occurred with a high frequency in the mixed hornbeam stands.
In our study the thickness of the litter layer and humus, total soil nitrogen and organic carbon were the most important soil variables that caused the variations of the understory vegetation (Fig. 3). Kooch, Samadzadeh and Hosseini (2017) mentioned that structural differences in the tree canopy resulted in a difference in the quality of litter layer. The higher mean of the thickness of the litter layer in the beech stands is caused by of the slow process of chemical decomposition of the leaves of the beech (Jacob, Viedenz, Polle, & Thomas, 2010; Mölder, Bernhardt-Römerman, & Schmidt 2008) which has been addressed in some studies. Kooijman and Cammeraan (2010) recorded the highest thickness of litter layer in beech stands. Amini, Rahmani, and Habashi (2011) reported that one of the main reasons for the slow decomposition litters of some species is the lack of leaves’ nitrogen and phosphorus content for initiation of the activity of decomposition by microorganisms. Therefore, our findings suggested that in the mixed beech stand due to the low ratio of litter decomposition, release of nitrogen (Kooch, Sanji & Tabari, 2019) was lower than in the mixed hornbeam stand. Dölle et al. (2017) confirmed that there was a positive significant correlation between the thickness of litter layer and beech dominance in the overstory stratum in the European beech stand. Bakhshandeh Navroud et al. (2018) found that an increase in the beech frequency resulted in diminished soil carbon and nitrogen content. The correlation results showed that there was no significant correlation between soil characteristics and diversity indices. Nevertheless, other researchers found that the biodiversity loss had a negative correlation with the amount of nitrogen, where higher nitrogen levels in the soil had a negative impact on local plant diversity (Midolo et al. 2018). The highest pH was recorded in the hornbeam stands in the research by Kooijman and Cammeraan (2010). A positive correlation between vegetation coverage and total soil phosphorus content was verified in Zhang et al. (2016) research. Vahder and Irmler (2012) indicated that the positive effect of beech dominance for mitigating the pH in the upper layer (0-5 cm) is greater than that of underlying layers in the beech dominated stands. Generally, the mixed beech stands in Hyrcanian temperate forests have a greater ratio of carbon content than pure oriental beech. Differences in soil fertility can explain the differences of variation in species composition of beech and mixed hornbeam stands. In other words, changes in soil variables can be correlated to different tree compositions in the site (Bakhshandeh Navroud et al. 2018). Therefore, each of these stands supports their indicator species.
Conclusions
We found that tree layer composition and soil attributes were crucial drivers in variations of understory species composition which may be altered by forest management approaches or natural disturbances over time. So, tree layer composition and soil attributes can be considered effective factors for controlling and assessment of understory plant species composition. The mixed beech and hornbeam stands differed in soil physico-chemical properties and herbaceous composition in Hyrcanian forests. These findings could enhance our knowledge about tree layer-herb layer relationship (interaction) and provide guidelines to conserve plant species composition within any framework of sustainable forest management in Hyrcanian forests. For a complete analysis of the value for nature conservation we recommend (1) to include other taxa of plants and animals into the analysis, e.g. mammals, birds, fungi, and lichens (2) to include other criteria additionally to species richness and diversity into the evaluation for nature conservation, e.g. naturalness, rarity and endangerment, and restorability.

