1 Introduction
In recent years, the state of polarization in fiber optics have been intensively studied due since it can be applied in different fields such as: spectroscopy, optical sensing, fiber device testing, and multi-wavelength fiber lasers [1-5]. Because when a mechanical stress is induced on an optical fiber the state of polarization is modified and as a result is got a change on the transmission spectrum. For these reason, several techniques for measure the states of polarization (SOP) have been implemented, like C. Ayala and D. Tentori et al.[6-7] demonstrated experimentally twisting and bending fiber, inducing birefringence, for producing insensitive-polarization devices. The polarization of light plays an important role in the design of new technology, which exploit the development of new optical fibers, which initially were developed for the telecommunications industry by reducing the effects of birefringence on fibers such as so-called polarization-maintaining fibers (PMF).
PMF are used in sensing applications, mainly because the costs of these have been reduced and for the high sensitivity for some environmental behavior like temperature or pressure, Dong [8] and Fu [9] reported the use of PMF, used to control polarization within a Sagnac interferometer, a task that would be more difficult using a standard communications fiber or single-mode fiber. In the same way, it has been of interest to generate well-controlled polarization states, such as the so-called vortex, T. Grosjean et al.[10] uses an all-fiber system, with which, when defining a polarization state at the input of the fiber and vary some conditions within the array can be selected polarized modes within the fiber path to produce the required polarization vortices at the output of the array. The SOP of an electromagnetic wave in a communications system had not played a relevant role, since the intensities of this one were not affected at the moment of recomposing the signal to a certain distance, however lasers have reached high levels of energy and power, making data to traveling farer, but not only that, also producing new phenomena where polarization is affected, producing loss in data (for a system communication means everything), like: polarization dependent loss (PDL) and polarization mode dispersion (PMD) [11]. This is where the importance of the study of polarization in optical fibers [12], especially now on designing systems, it required cancel the contribution of the birefringence, so that it does not influence the operation of an optical system. In this respect on literature has being reported work on the cancellation of the contributions of birefringence on fiber devices.
Presented above applications in this paper, we report the development of a software that helps in the simulation of light polarization states at the output of a fiber that has been twisted, the importance in the design and development of this computer system lies in providing an environment of easy management and implementation. The importance of the software is the preview data visualization for an experimental arrangement. Also, this software suggests parameters of the fiber, that are manually modified to obtain the results of interest, with respect to the polarization of light.
2 Methodology
It is important to recall that electromagnetic radiation, including visible light, has two properties, one undulatory and the other corpuscular. Considering it as an electromagnetic wave, this wave is considered as a transverse wave type; which defines a type of perturbation that maintains its state of vibration in a plane perpendicular to the axis in which it propagates, if we see this wave in a system of references x, y, z, where the electric radiation vibrates by our convention in the x or y plane, thus propagating, along the z-axis.
This plane of vibration is called the state of polarization, and considering only the electric field on respect. The electromagnetic waves coming from the sun randomly oscillates in all the planes perpendicular to the axis in which they propagate, reason why this type of light is called un-polarized light. Now, let's suppose that an electromagnetic wave and the electric field oscillating just in x-axis, by right hand convention, and seeing this wave propagates trough the z-axis, obtaining linearly polarized light. If we locate our reference system x, y, z, considering the x-axis parallel to the horizontal plane. This is called horizontal polarized light, complicating the things we can tilt this light 45° or in other words rotates the plane of vibration x-axis clockwise, the amplitude of the electric field remains intact and now we can talk about linearly polarized light 45° tilted [11].
2.1 Matrix of a Twisted Optical Fiber
When light interacts on a medium, for example a fiber optic, its state of polarization can vary producing besides of linear polarization other states, namely circular, elliptic or variations between the last three. Specially talking on fiber optics, and due to its process of fabrication and manipulation, light traveling along it, experiences diverse and complicated phenomena, then, making us impossible to describe how is the state of polarization (SOP) all along the length of the fiber or at the output.
This has led to consider fiber optics as a birefringent medium [12] with two axes of propagation, one fast and one slow, which will cause the electric field to experience a certain delay in its path when traveling on the slow axis, while in the fast one, producing what is call a phase shift on electric axis. Knowing that this birefringence is completely random in the fiber manufacturing process, as well as the procedural manipulation involves bend, twist or pinch; it describes the SOP of light, both inside and outside of the fiber, is a very complex problem and not only when modeling the system mathematically but experimentally.
It has been demonstrated in previous works [12], that the birefringence matrix of a standard twisted optical fiber is:
where R(θ) is the rotation matrix and is M T the matrix of an elliptic retarder whose eigenmodes have an ellipticity ∈ and the azimuth angle of its fast birefringence axis, measured with respect to the horizontal axis is θ. The delay δ τ induced between the eigenmodes by the applied torsion is:
where δ 0 is the delay between eigenmodes when the fiber is not twisted and C is a constant; the product Cτ describes the geometric rotation of the principal axes due to torsion and σ is a constant with value close to unity; β is a fixed rotation angle between the coordinate system and the characteristic axes of the fiber.
2.1 Poincaré Sphere
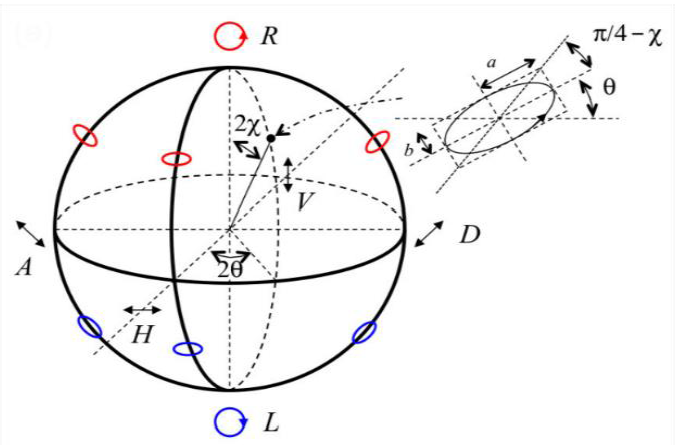
To understand the software results, it is necessary to explain the Poincaré Sphere. The Poincaré sphere represents the universe of polarization states, described by a point on the surface of a sphere, shown in figure 1. Points along the equator represent linearly polarized states of varying orientation, with notable cases at the axes: horizontal (H), vertical (V), diagonal (D), anti-diagonal (A). The north and south poles representing right-circular (R) and left-circular (L) polarization [13].
2.2 Poincaré Sphere Modelling
For the development of the software, it was proposed to make use of a work environment specially designed for the creation of graphical interfaces that were stable and of rapid implementation, reason why the option was Visual Studio. On the other hand, since the objective of the present design is to present mathematical information, matrix analysis and symbolic material before obtaining concrete results, opted for the use of Matlab.
A communication port was opened between both systems and the interface directly controlled the mathematical engine for obtaining results through computation data manipulation and obtaining graphs. On the other hand, the controls in the GUI are values that are stored in variables that are run later in Matlab. The results of this implementation are presented below.
3 Results
In this section is described the user form and the importance of have a friendly access for manipulating diverse parameters of interest for getting results that approach to than obtained by experimental ones.
First than all is described the GUI, their parts, controls and formularies. The values to modify, constants, and resultant graphs. Secondly are presented the results of simulation and are compared to the experimentally obtained by [6].
3.1 Graphic User Interface (GUI)
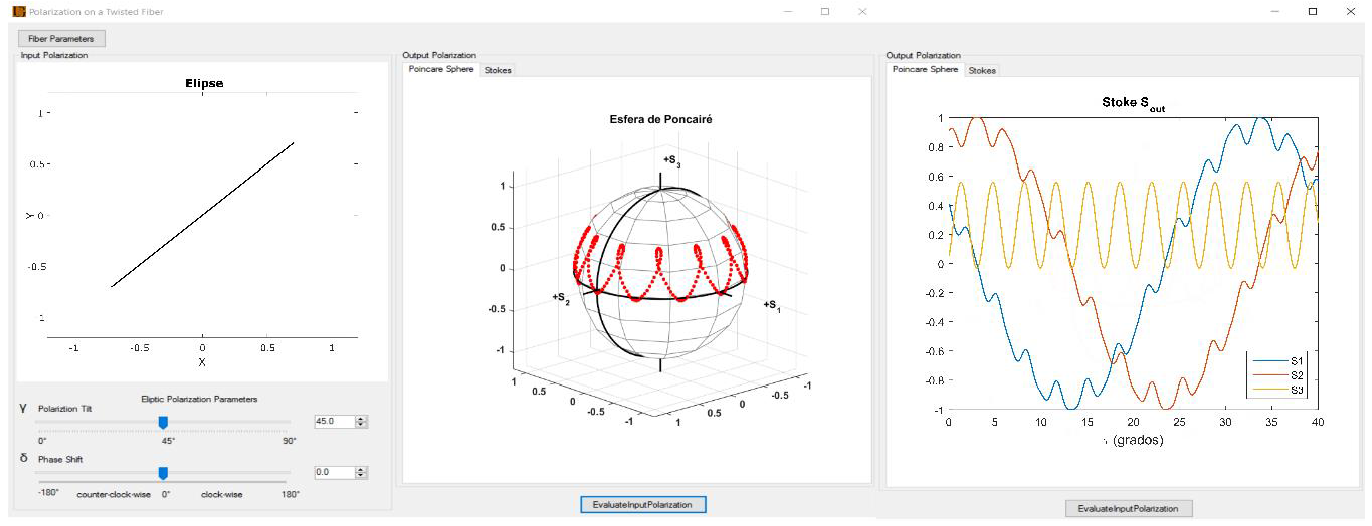
The GUI (Fig. 2) is focused on speeding up the work with the system, although prior knowledge is required in optics and light polarization, information management is given in detail and using simple controls can make various configurations in the functionality of the system.

Fig. 2 GUI control and formularies description: a) fiber optics parameters button for modify diverse constants, b) input polarization picture box, c) tilt and phase ellipticity polarization parameters, d) output polarization view, trough Stokes technique and the Poncairé Sphere
This software makes use of equations 1 and 2, so that by involving so many parameters it is necessary to optimize the input data.
The GUI is developed in Visual Basic and connected to Matlab. The GUI contains following are the parameters: 1) polarization of the input light, which is represented by only two data modifiable by a pair of track bar controls and up-down numerical switches; which modify both the amplitudes of the electromagnetic fields and the phase shift between them, those controls are identified as Delta and Gamma. These parameters are then converted to polarization parameters that can be used in the matrix methodology described above, so that a transformation is made to Stokes vectors; with these data, the polarization of the input light is verified and shown graphically in the Input Polarization picture box. Where the ellipticines and the inclination of polarization are corroborated, shown in figure 3b). 2) Matrix representation of the medium, in this case the fiber optic, which is proposed using the next parameters, table 1, or initial configuration in attendance for a single mode fiber SMF-28, shown in figure 3c). 3) The last point computes the interaction of the input light with its due polarization as it guides itself inside the optical fiber, thus obtaining some type of output polarization, shown in figure 3d).
Table 1 Parameters for describing the mechanical values of a fiber optic
| Parameter | Value[rad] |
|---|---|
| Fiber optic axis tilt (θ) | -0.560 |
| Torsion constant (b) | -0.990 |
| Pancharatnam Geometrical Phase (ξ P ) | -3.073 |
| Residual retardation (δ 0 ) | 0.305 |
| Photo-elastic effect constant (c) | 1.825 |
| Fiber optic ellipticity (ε) | 0.942 |
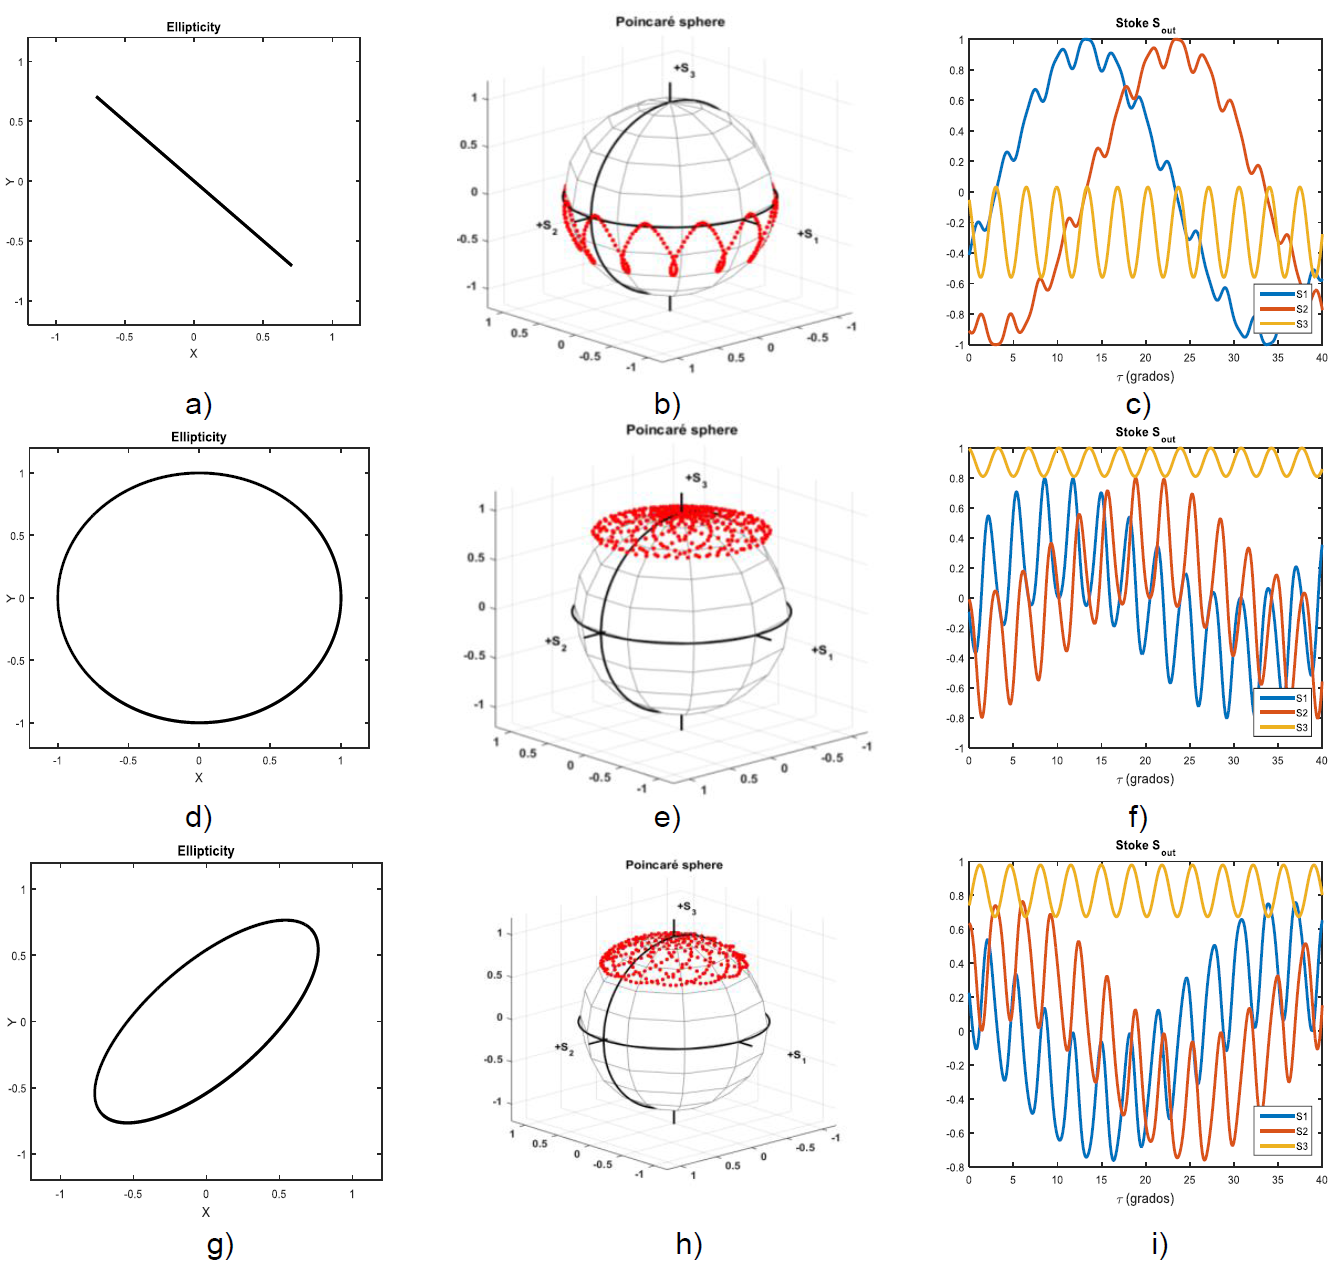
Figure 4a)-c) Input polarization is linear at -45°, the output is elliptical as shown at the Poncairé Sphere; at d)-f) the input polarization is circular right hand, the polarization remains mainly circular; and at g)-i) we can see elliptic polarization a variation from circular to elliptical.

Fig. 4 a)-c) Input polarization is linear at -45°, the output is elliptical as shown at the Poncairé Sphere; in d)-f) the input polarization is circular right hand, the polarization remains mainly circular; and in g)-i) we can see elliptic polarization a variation from circular to elliptical
These results are shown again graphically, especially for the interpretive quality of the same.
Where through two Stokes methodologies and the sphere of Poncairé the behavior of the electric field through medium is detailed.
Figure 4 shows the illustration of the proposed interface design, which consists in three windows.
The left window displays the polarization of the input light, the center window displays the Poncairé Sphere and the right window displays the stokes polarization parameters.
3.2 Graphic User interface (GUI)
In this section, the software runs for various values of the input polarization as well as their respective output polarizations are shown through a series of images. In figure 3, we can see a linear polarization with 30° of inclination at the entrance of the optical fiber and at the exit, we can see in the sphere of Poncairé the polarization evolution by modifying the twist of the optical fiber. These results are relevant since they can be compared with those obtained by [6] in an experimental way and we demonstrate the high concordance between the simulation processes that are our case, as well as the experimental ones.
In figure 4, it is depicted for the input polarization as well as the evolution of the polarization at the output of the fiber.
4 Conclusion
It was shown the development of software that helps in the simulation of SOP at the exit of a section of twisted optical fiber, its importance lies in the speed of obtaining results by presenting all the information in a single work environment and exploit the Maximum the tools of programming with which they were counting linking Matlab like mathematical engine and Visual Studio like environment of control its robustness and stability in the generation of GUI's.


 nueva página del texto (beta)


