1 Introduction
Automatic Speech Recognition Systems, in recent years, have been benefited with the use of the computational model of the auditory periphery. In this paper we propose a new approach that takes some ideas from physiologic model of the cochlea present in state of the art and one of the most important aspects used in the ASR that use modeling of the psychoacoustics, the human perception of the sound with the goal to have a new set of features extracted from the speech signal and used in ASR tasks. The last because the evolution of automatic speech recognition (ASR) points out that employing principle having counterparts in the human auditory system may lead to better performance.
The greatest common denominator of all recognition systems is the signal-processing front end, which converts the speech waveform to some type of parametric representation (generally at a considerably lower information rate) for further analysis and processing.
A wide range of possibilities exists for parametrically representing the speech signal. But principally it exists two dominant methods of spectral analysis, namely, the filter-bank spectrum analysis model, and the linear predictive coding (LPC) spectral analysis model [1].
For a long time, Automatic Speech Recognition Systems have used parameters related with Cepstrum and Homomorphic Analysis of Speech [1,2] Linear Prediction Coefficients (LPCs) [3], Mel Frequency Cepstrum Coefficients (MFCCs) [4], Perceptual Linear Prediction Coefficients (PLPs) [5], these last two being the most important.
Other tasks where the reduction of the information of the speech signal is relevant are there when a great amount of reference information, such as speech signals for ASR that employed digital networks, is stored. Then, the reduction in the capacity of this information is a problem when we process database speech [1].
Inside the cochlea, a particular frequency analysis is realized. It transforms frequency response into distance response [6]. Then, the solutions before mentioned take only the perceptual response without considering the principal operation of the cochlea.
On the other hand, the most important organ in human hearing is the cochlea and various phenomenological and physiological models have been proposed for a long time. [7,8,9]. Cochlear mechanics is a field that relies strongly on fluid mechanics, linear and nonlinear signal processing, and additional mathematical tools. This is applied to a biological structure.
For another side, since 1930's and after 1950's, the analysis and study of the cochlea behavior has generated many publications and considered aspects related with the audition into inner ear that has a capability to divide the sound coming to the outer and medium ear and process the sound that it captures to divide into a set of frequencies.
In these studies, a set of models to represent the operation of the cochlea has been proposed [7,10,11,12,13,14,15].
This paper proposes new parameters, that they are used for ASR tasks, that are related with the fluid mechanical model of the cochlea proposed by Lesser and Berkeley [16] where we propose an alternative solution from the equations gave by them and another based in the macro and micro mechanical model of the cochlea [17,18], where we used 2 variants find it in the state of the art [19,20,21] also we used a proposal related with the cochlea behavior to compare with our results, and another empirical mathematical proposition to analyze the results of our proposal.
Then our hypothesis consider that is possible incorporate a model related with the physiological cochlea model. Now, we are going to review some works that are related with that we mentioned above.
2 State of the Art
In [22] the authors proposed a feature extraction method for ASR based on the differential processing strategy of the AVCN, PVCN and the DCN of the nucleus cochlear. The method utilized a zero-crossing with peak amplitudes (ZCPA) auditory model as synchrony detector to discriminate the low frequency formants. They used Continuous density Hidden Markov Models with isolated digits from the TIdigits with 15 states per digit and 5 mixture components per state. A 3-state silence/pause model was inserted at the beginning of each utterance.
They presented a feature extraction for sound data that was motivated by the neural processing of the human auditory system.
The aim of that paper was using generated pulse spiking trains of the auditory nerve fibers that was connected to a feed forward timing artificial Hubel-Wiesel network, which is a structured computational map for higher cognitive functions as e.g. vowel recognition.
The core of the system was a feed-forward timing artificial Hubel-Wiesel network (HW-ANN). Harczos et al. coupled the network with the neural spike output of the ANFs.
The cross-validated recognition rate from segments in the center of the vowels is 68.0%. When neglecting the most confusing vowel (/uw/) which is quite correctly recognized on the training data but loses recognition accuracy on the test data the rate can be further improved up to 85.1%.
In [23], they indicate that hearing has already been modeled up to the cochlear nucleus (CN) to some degree. They used these features without any other spectral information to carry out speech recognition tasks under different noise conditions on the TIMIT database. They found that the shapes of the cochlear delay trajectories carry precious information, which can be extracted even in the presence of noise. This finding may play an important role in next generation cochlear implants.
In this paper we used the same procedure to obtain the Mel-Cepstrum Coefficients because of they have a satisfactory behavior supported by the empirical evidence but the bank of filters distribution is based on cochlear mechanical models.
In this work, as we mentioned above a new set of parameters are obtained from the two models founded in the state of the art related with cochlear mechanics, specifically fluid mechanics and macro and micro mechanic. The corpus SUSAS in English language was used, also Spanish digit corpus, was created. Hidden Markov Models to training and recognition stages, were used. We modify Hidden Markov Model Toolkit to analyze the results obtained with our proposal.
This paper is organized as follows: Cochlea physiology description is introduced briefly specifically describing the pre-processing and processing of the speech signal for the feature extraction are detailed, in Section 2. At same time, section 3 describes our proposal based in two cochlear mechanics models, and we indicate how to obtain the new proposed parameters. Experimental results are described in Section 4, using SUSAS Corpus cleaning. Finally, the conclusions are shown in Section 5.
3 Materials and Methods
The ear has three distinct regions called the outer ear, the middle ear, and the inner ear. The outer ear consists of the pinna (the ear surface surrounding the canal in which sound is funneled), and the external canal. Sound waves reach the ear and are guided through the outer ear to the middle ear, which consists of the tympanic membrane or eardrum upon which the sound wave impinges and causes top move and a mechanical transducer (the malleus or hammer, the incus or anvil, and the stapes or stirrup), which converts the acoustical sound wave to mechanical vibrations along the inner ear.
The inner ear consists of the cochlea, which is a fluid-filled chamber partitioned by the basilar membrane, and the cochlea or auditory nerve. The mechanical vibrations impinging on the oval window at the entrance to the cochlea create standing waves (of the fluid inside the cochlea) that cause the basilar membrane to vibrate at frequencies commensurate with the input acoustic wave frequencies (e. g., the formants of voiced speech) and at a place along the basilar membrane that is associated with these frequencies.
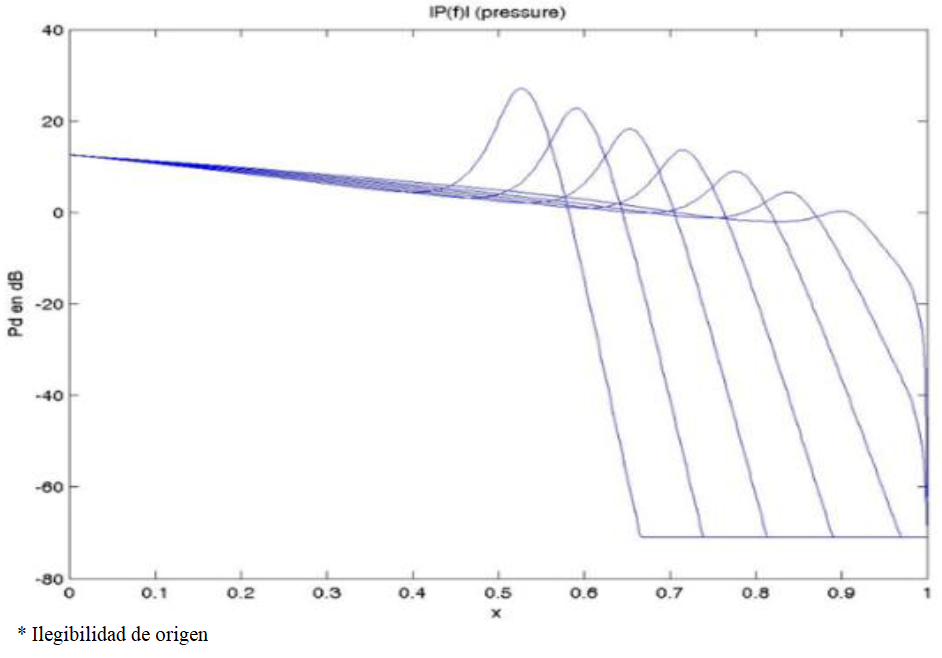
The cochlea is a long, narrow, fluid-filled tunnel which spirals through the temporal bone. This tunnel is divided along its length by a cochlear partition into an upper compartment called scala vestibuli (SV) and lower compartment called scala timpani (ST). At the apex of the cochlea, SV and ST are connected to each other by the helicotrema [24]. A set of models to represent the operation of the cochlea has been proposed [7-21]. In mammals, vibrations of the stapes set up a wave with a particular shape on the basilar membrane. The amplitude envelope of the wave is first increasing and then decreasing, and the position at the peak of the envelope is dependent on the frequency of the stimulus [25]. The amplitude of the envelope is a two-dimensional function of distance from the stapes and frequency of stimulation this is that is known as the place theory. The curve shown in Fig. 1 is a cross-section of the function for fixed frequency.
Frequency responses analyzed by Von Békésy are shown in Fig. 1, where each part of the basilar membrane responds maximally to a certain frequency, and as the frequency increases so does the maximum place of the envelope. If low frequencies excite the cochlea, the envelope is nearest to the apex, but if high frequencies excite it, the envelope is nearest to the base.
The displacement pattern of basilar membrane motion is related with high frequencies reaching their apogee towards the base of the cochlea and low frequencies achieving their maximum near the apex (Von Bèkèsy, 1960).
Also, the maintenance of this neural spatial representation of frequency throughout the nuclei of the central pathways is referred to as tonotopic organization.
Now we are going to describe two cochlear mechanical models used in this work, we selected them because they are two of the most important and referenced works in the state of the art of cochlear models, also the results that are obtained with them are nearly to the response that Von Bèkèsy found it in his experiments with corpses.
The first model that we are going to study was proposed by [16] and principally is an equation extracted from the fluid mechanical model to find a relationship between these frequencies and the place of the excitation into the cochlea.
With that value a new distribution of the bank filter to extract parameters for ASR tasks is proposed.
Let
where S is the surface of V, and
After considering that the momentum of the fluid in a fixed domain V can change only in response to applied forces or to the momentum flux across the domain boundary, and using the divergence theorem to convert surface integrals to volume integrals, 2 is obtained:
After considering that V is arbitrary, fluid motions are of small amplitude and there is an irrotational flow, the following equations are shown:
Lesser and Berkley developed a model that combines these last two equations with the equation of a damped, forced harmonic oscillator and is considered one of the simplest of the cochlea models.
They proposed that each point of the basilar membrane is modeled as a simple damped harmonic oscillator with mass, damping, and stiffness that vary along the length of the membrane. Thus, the movement of any part of the membrane is assumed to be independent of the movement of neighboring parts of the membrane, as there is no direct lateral coupling. The deflection of the basilar membrane,
where m is the mass, Rm mechanical resistance and k is the damping constant which can be substituted by following values
4 Auditory Models
This paper proposes solving the Lesser and Berckley equation using the solution proposed in [26]. This solution is related with the place theory of hearing, initially proposed by Von Békésy. To perform the analysis each section of the membrane is considered as a forced harmonic isolated oscillator, which is excited by an external force that represents the driving force on each section of the basilar membrane and this force is produced by vibrations transmitted into the cochlea by the oval window. Two solutions are proposed related with the before mentioned equation. Firstly, the forced harmonic oscillator is represented by the following equation:
where
m is the mass, Rm mechanical resistance and k is the damping constant. Considering that
then, a solution is given by:
Equation 8 shows that the amplitude for each section of the membrane depends of the frequency ω in the applied force. The amplitude has a maximum when the denominator has its minimum value and this occurs at a specific frequency excitation called resonance frequency.
This is defined by the values of mass and stiffness, when the frequency ω of the applied force is equal to
This last equation can be expressed as a function of frequency and distance, if considering that
In the literature we can find another two equations that they intent to represent the behavior of the cochlea. One of them proposed by Greenwood [27] that is represented in the equation 10. The generalized form of the mammalian reception cochlear map which is described by the Greenwood relation:
where f is frequency (Hz), x is the distance from the apex of the cochlea (helicotrema end), A , a , and k are coefficients [28,29,30], a is the gradient of high frequency end of the map, i.e., the coefficient of the derivative evaluated at the highest frequency, A is a constant which shifts the curve as a whole along the log-frequency axis, and k is constant, which introduces curvature into the frequency position function so as to fit low-frequency data.
And another called empirical equation of the cochlea behavior that is represented in the equation 11 [31]:
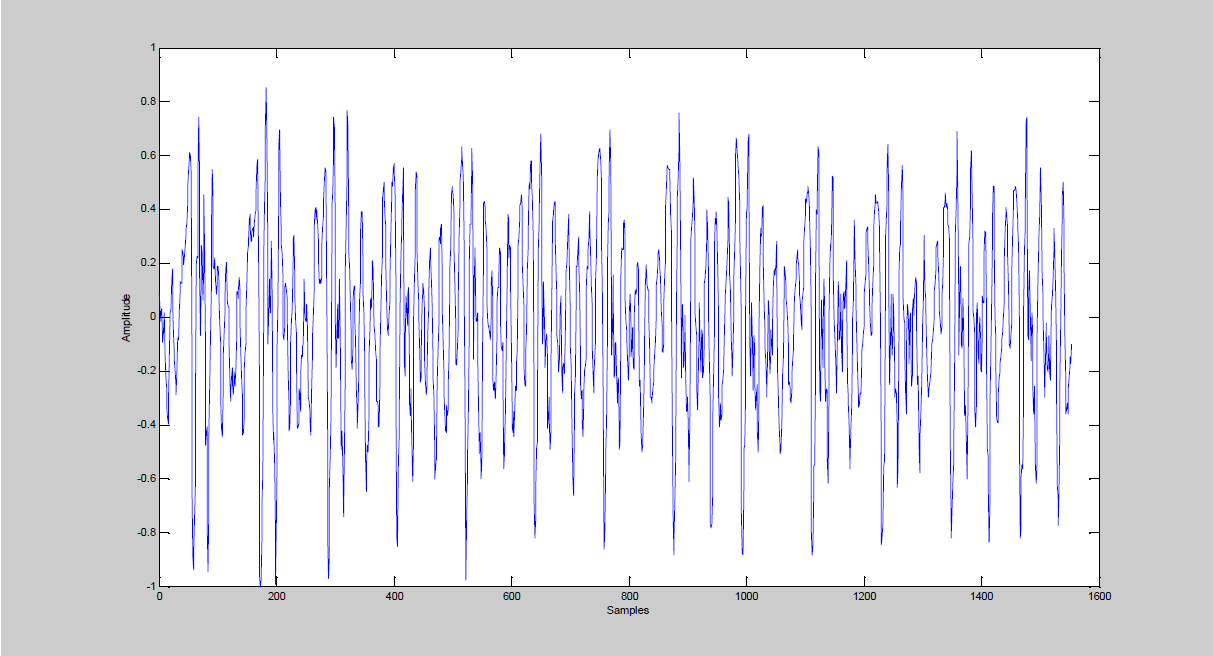
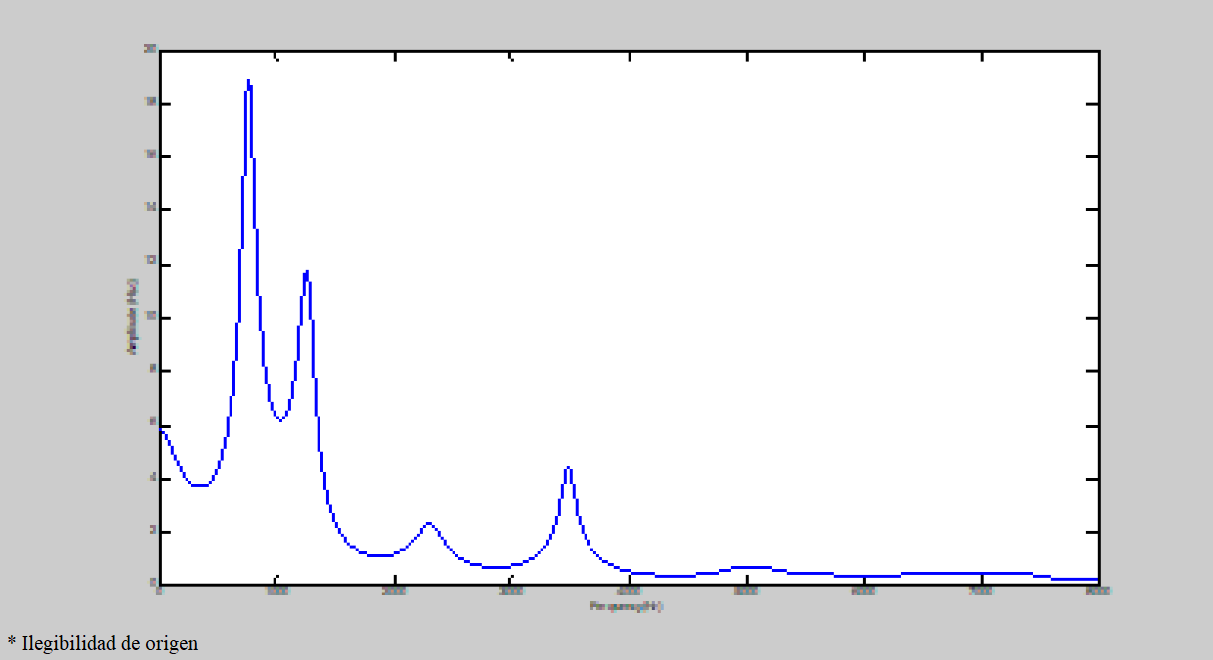
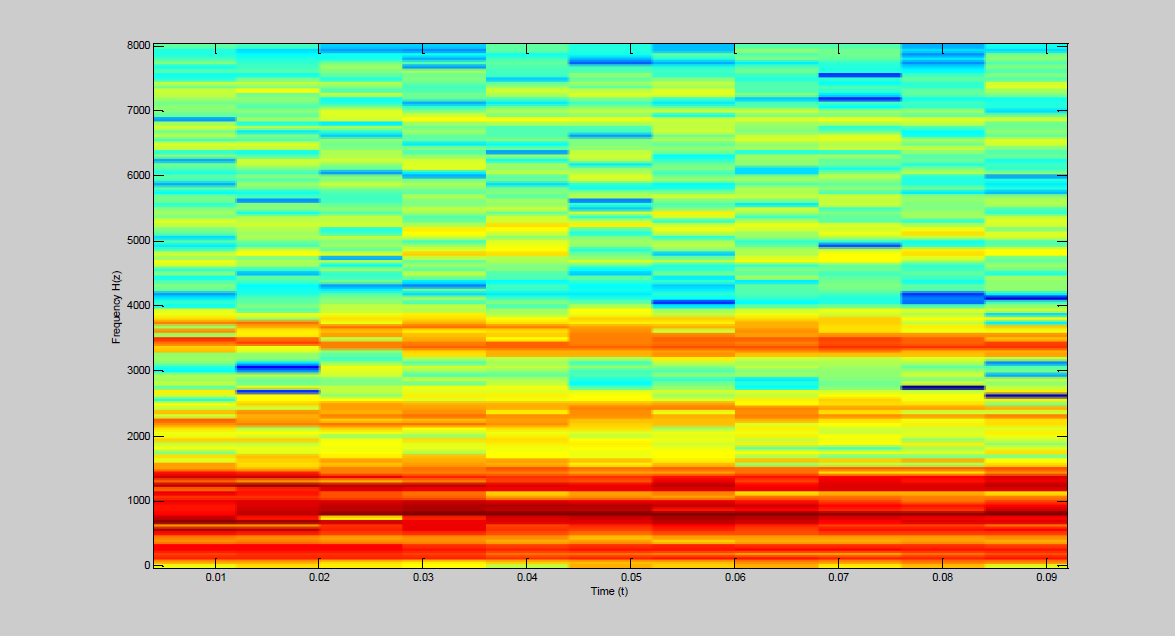
The following figures 2(a-k) illustrate different aspects related with a segment of the speech signal analysis and the information extracted from them.
Figure 2a) shows a segment of the speech signal that we analyze, 2b) shows the spectral representation of the segment of the speech signal, 2c) shows the spectral envelope of the spectral representation extracted from the LPC analysis, 2d) shows the spectrogram of the segment of the speech signal, 2e) shows the behavior of the relation between distance vs excitation frequency founded by our proposal and represented by the equation 9 is reached, 2f) shows the relation between resonance frequency and frequency of the excitation of our proposal, 2g) shows the relation of the amplitude vs frequency of the excitation for our proposal, 2h) shows a bank of triangular filters constructed from our propose, 2i) shows the values of the parameters obtained from our proposal, and 2j) and 2k) show the spectral response and the spectral representation of the speech signal after that has been passed for the bank of filters constructed from our proposal, respectively.
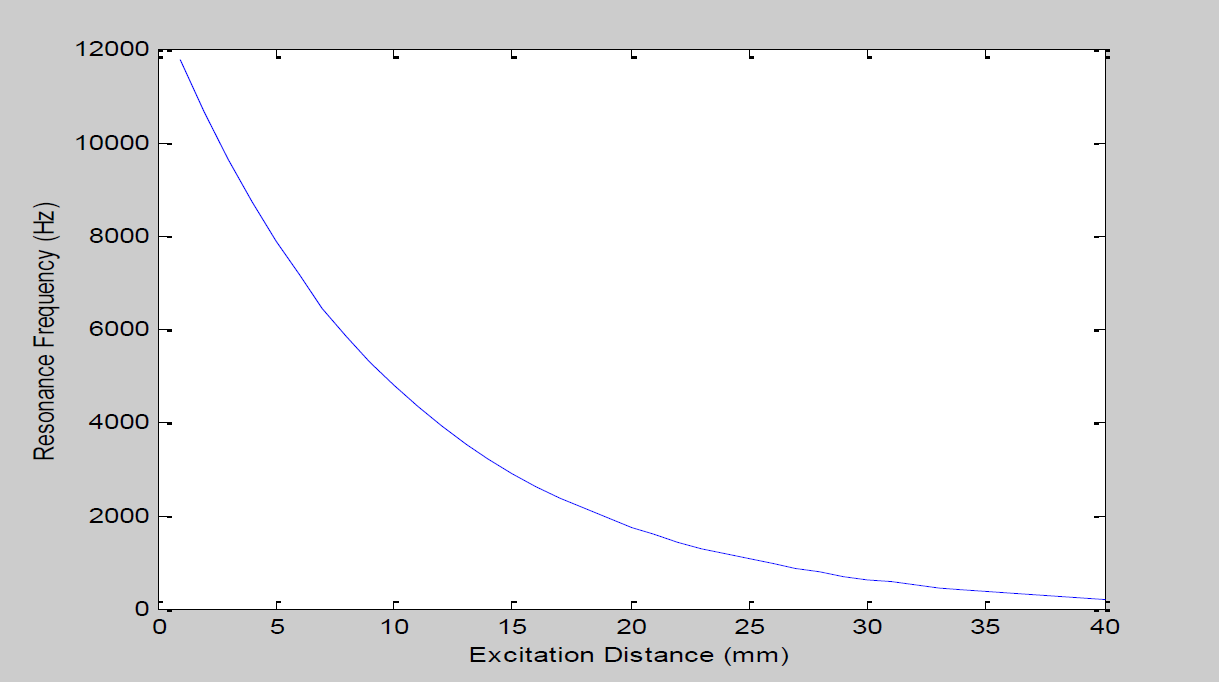
Fig. 2e) Shows the behavior of the relation between distance vs excitation frequency founded by our proposal and represented by the equation 9 is reached
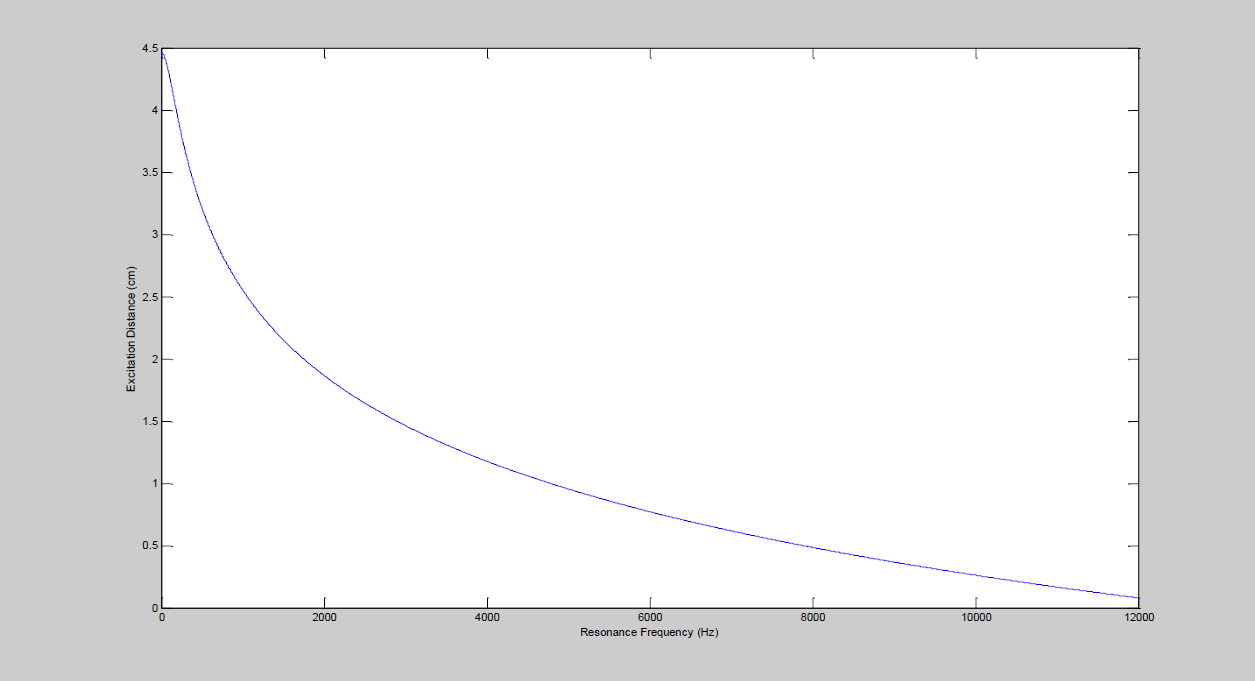
Fig. 2f) Shows the relation between resonance frequency and frequency of the excitation of our proposal
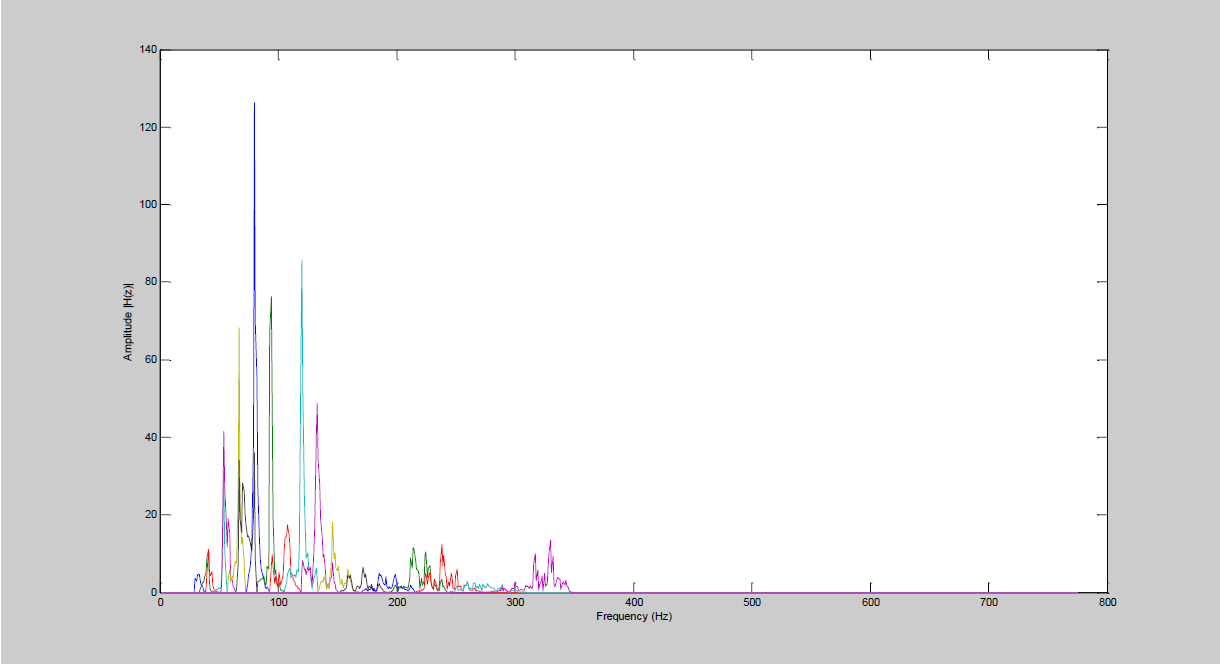
Fig. 2l) Spectral response after that the spectral representation of the speech signal has been passed for the bank of filters constructed from our proposal
The second model that we used to came on of an equation extracted from a mechanical model to find a relationship between these frequencies and the place of the excitation into the cochlea.
With that value a new distribution of the bank filter to extract parameters for ASR tasks is proposed.
For that the micromechanical the anatomical structure of a radial cross-section (RCS) of the cochlear partition (CP) is illustrated in the following figure 3. In the model, the basilar membrane (BM) and tectorial membrane (TM) are each represented as a lumped mass with both stiffness and damping in their attachment to the surrounding bone.
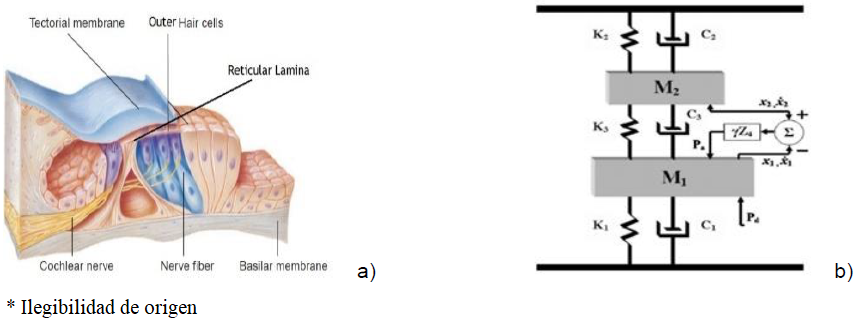
Fig. 3 (a) Anatomical structure of the cochlear partition, (b) The outer hair cells, micro mechanical representation
When the cochlea determines the frequency of the incoming signal from the place on the basilar membrane of maximum amplitude, the organ of Corti is excited, in conjunction with the movement of tectorial membrane; the inner and outer hair cells are excited obtaining an electrical pulse that travels by auditory nerve.
Now the modeling cochlear will be divided in two ways of study. The first is the hydrodynamic movement that produced a movement on the basilar membrane and the second is the movement of the outer hair cells. This is named as the model of Macro and Micro Mechanical Cochlear [18]. The equations that describe the Macro Mechanical Cochlear are [18]:
The equations (12, 13, 14) were solved by finite difference, using central differences for (12), forward differences for the (13) and backward difference for (14), generating a tridiagonal Matrix system [32] which we solved using the Thomas algorithm.
It represents the Micro mechanical, because it uses the organ of Corti values. The solution for Pd obtains the maximum amplitude on the basilar membrane shown in Figure 1. For these experiments the cochlear distance pattern is obtained manually. As can be seen, to solve equation 15 a set of variables related with the physiology of the cochlea is needed and some of these variables are described in table 1.
Table 1 Values used in equation
| Parameters | Neely & Kim 1986 (cgs) | Ku (human cochlea, 2008) | Elliot (2007) |
|---|---|---|---|
| k1(x) | 1.1 ∗ 109𝑒−4𝑥 | 1.65 ∗ 108𝑒−2.79(𝑥+0.00373) | 4.95 ∗ 108𝑒−3.2(𝑥+0.00375) |
| c1(x) | 20 + 1500𝑒−2𝑥 | 0.9 + 999𝑒−1.53(??+0.00373) | 0.1 + 1970𝑒−1.79(𝑥+0.00375) |
| m1(x) | 3 ∗ 10−3 | 4.5 ∗ 10−4 | 1.35 ∗ 10−3 |
| k2(x) | 7 ∗ 106𝑒−4.4𝑥 | 1.05 ∗ 106𝑒−3.07(𝑥+0.00373) | 3.15 ∗ 106𝑒−3.52(𝑥+0.00375) |
| c2(x) | 10𝑒−2.2𝑥 | 3𝑒−1.71(𝑥+0.00373) | 1.3𝑒−1.76(𝑥+0.00375) |
| m2(x) | 0.5 ∗ 10−3 | 0.72 ∗ 10−4 + 0.28710−2x | 2.3 ∗ 10−4 |
| k3(x) | 1 ∗ 107𝑒−4𝑥 | 1.5 ∗ 106𝑒−2.79(𝑥+0.00373) | 4.5 ∗ 106𝑒−3.2(𝑥+0.00375) |
| c3(x) | 2𝑒−0.8𝑥 | 0.66e−0.593(x+0.00373) | 2.25𝑒−0.64(𝑥+0.00375) |
| k4(x) | 6.15 ∗ 108e−4x | 9.23 ∗ 107𝑒−2.79(𝑥+0.00373) | 2.84 ∗ 108𝑒−3.2(𝑥+0.00375) |
| c4(x) | 1040𝑒−2𝑥 | 330e−1.44(x+0.00373) | 965𝑒−1.64(𝑥+0.00375) |
| gamma | 1 | 1 | 1 |
| g | 1 | 1 | 1 |
| b | 0.4 | 0.4 | 0.4 |
| L | 2.5 | 3.5 | 3.5 |
| H | 0.1 | 0.1 | 0.1 |
| Km | 2.1 ∗ 106 | 2.63 ∗ 107 | 2.63 ∗ 107 |
| Cm | 400 | 2.8 ∗ 103 | 2.8 ∗ 103 |
| Mm | 45 ∗ 103 | 2.96 ∗ 10−3 | 2.96 ∗ 10−3 |
| Ch | 0.1 | 35 | 21 |
| As | 0.01 | 3.2 ∗ 10−2 | 3.2 ∗ 10−2 |
| Rho | 0.35 | 1 | 1 |
| N | 250 | 500 | 500 |
| Gm | 0.5 | 0.5 | 0.5 |
These values are immersed into Zp and Zm; for example in [18]. One aspect important to mention is that the values showed in table 1 are values of the human body and some of them are not the same with respect at Neely, Ku or Elliot used in their papers. The most important values are obtained from [33].
One important aspect to indicate is that before 300 Hz the behavior of the micro and macro mechanical model is not adequate, independently of the parameters used. This result is a consequence of the characteristics of the model proposed by [18].
Proposing our analysis from this frequency to 4.5 KHz was decided. Also, the response obtained has a behavior logarithmic.
This is an important indication because the Mel function is related with a similar mathematical function.
One of the most important aspects related with the cochlear models is that the equations when they are substituted with adequate values the response of the system must to be same at the Von Bèkèsy proposed in his research about the human cochlea. At same time, we can see that the presion to reach a maximum in a value of distance inside of the cochlea. This value of distance from the apex to the helicotrem is the value that we can use to obtain the feature from our purpose that we are going to use for the next set of experiments.
5 Experiments and Results
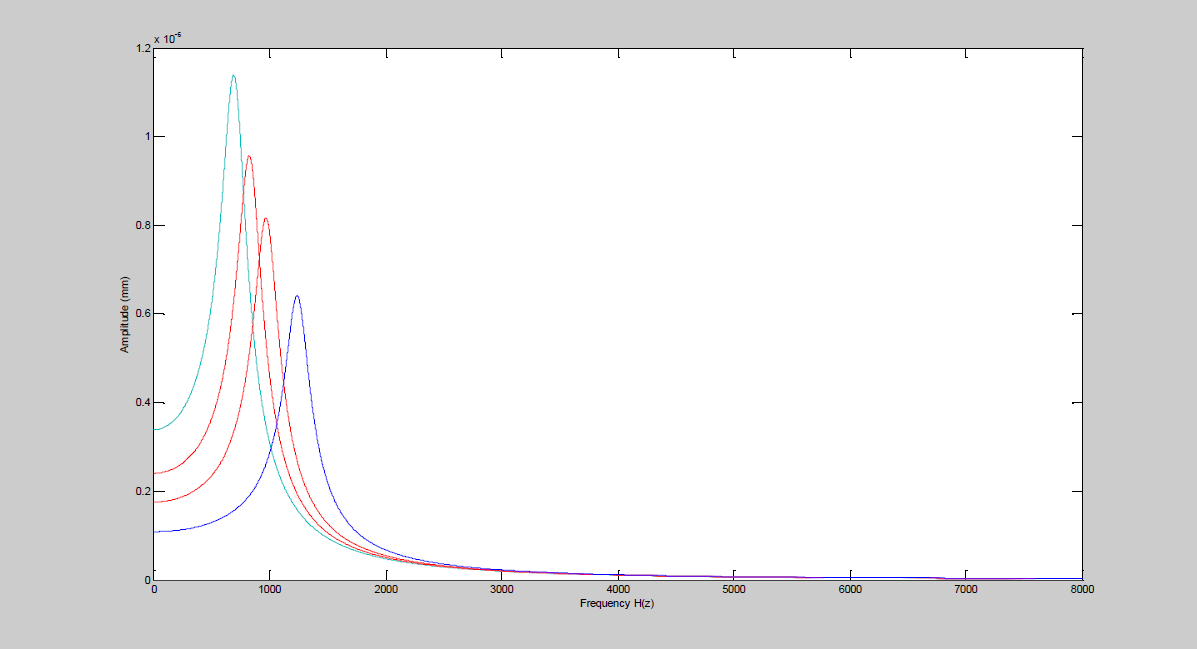
One time that we have the analysis of the micro and macro mechanical model of the cochlea with the last equations we can obtain a mathematical expression for the behavior of the distance vs frequency of the excitation such as we mentioned for the Lesser and Berckley model, or we can evaluate the response of the cochlea with different values of the frequency of the excitation and then to find the distance x where we can obtain a maximum, such as last figure shows.
Then now we have a model proposed by Neely with three different values, each of one them with their properties. Table 2 shows de values for Neely values. Neely-Ku, Meely-Elliot use the same model developed by Neely but with different values and analysis [21].
Table 2 Frequency vs. proposed distance
| Our proposal | Neely-Elliot | Neely-Ku | Empirical | |||||
|---|---|---|---|---|---|---|---|---|
| Item | frequency | distance (x) | frequency | distance (x) | frequency | distance (x) | frequency | distance (x) |
| 1 | 78.825638 | 4.33948 | 209 | 3.471943888 | 361 | 3.240480962 | 299.9296166 | 2.752 |
| 2 | 116.197052 | 4.226435 | 254 | 3.396348252 | 395 | 3.1750167 | 346.4698275 | 2.690148148 |
| 3 | 150.462677 | 4.11339 | 303 | 3.320752616 | 438 | 3.109552438 | 397.9246918 | 2.628296296 |
| 4 | 184.646286 | 4.000345 | 338 | 3.245156981 | 490 | 3.044088176 | 454.5940071 | 2.566444444 |
| 5 | 220.126266 | 3.8873 | 385 | 3.169561345 | 542 | 2.978623914 | 516.7886269 | 2.504592593 |
| 6 | 257.798676 | 3.774255 | 431 | 3.093965709 | 597 | 2.913159653 | 584.8319308 | 2.442740741 |
| 7 | 298.382843 | 3.66121 | 501 | 3.018370073 | 663 | 2.847695391 | 659.0614242 | 2.380888889 |
| 8 | 342.535828 | 3.548165 | 545 | 2.942774438 | 728 | 2.782231129 | 739.8304708 | 2.319037037 |
| 9 | 390.906982 | 3.43512 | 606 | 2.867178802 | 807 | 2.716766867 | 827.5101673 | 2.257185185 |
| 10 | 444.168732 | 3.322075 | 683 | 2.791583166 | 884 | 2.651302605 | 920.9245991 | 2.195333333 |
| 11 | 503.037781 | 3.20903 | 763 | 2.715987531 | 968 | 2.585838343 | 1023.494306 | 2.133481481 |
| 12 | 568.290527 | 3.095985 | 843 | 2.640391895 | 1058 | 2.520374081 | 1134.208285 | 2.07162963 |
| 13 | 640.777527 | 2.98294 | 939 | 2.564796259 | 1168 | 2.45490982 | 1253.530073 | 2.009777778 |
| 14 | 721.436951 | 2.869896 | 1045 | 2.489200623 | 1277 | 2.389445558 | 1381.952813 | 1.947925926 |
| 15 | 811.307861 | 2.756851 | 1152 | 2.413604988 | 1407 | 2.323981296 | 1520.002279 | 1.886074074 |
| 16 | 911.545593 | 2.643806 | 1292 | 2.338009352 | 1536 | 2.258517034 | 1668.240157 | 1.824222222 |
| 17 | 1023.43585 | 2.530761 | 1422 | 2.262413716 | 1677 | 2.193052772 | 1827.267638 | 1.76237037 |
| 18 | 1148.4126 | 2.417716 | 1581 | 2.186818081 | 1847 | 2.12758851 | 1997.729347 | 1.700518519 |
| 19 | 1288.07617 | 2.304671 | 1741 | 2.111222445 | 2015 | 2.062124248 | 2177.320929 | 1.638666667 |
| 20 | 1444.21497 | 2.191626 | 1935 | 2.035626809 | 2198 | 1.996659987 | 2372.570236 | 1.576814815 |
| 21 | 1618.82715 | 2.078581 | 2151 | 1.960031173 | 2398 | 1.931195725 | 2584.911035 | 1.514962963 |
| 22 | 1814.1471 | 1.965536 | 2392 | 1.884435538 | 2639 | 1.865731463 | 2804.915918 | 1.453111111 |
| 23 | 2032.67358 | 1.852491 | 2663 | 1.808839902 | 2879 | 1.800267201 | 3043.811772 | 1.391259259 |
| 24 | 2277.20313 | 1.739446 | 2935 | 1.733244266 | 3139 | 1.734802939 | 3299.179135 | 1.329407407 |
| 25 | 2550.86353 | 1.626401 | 3269 | 1.657648631 | 3457 | 1.669338677 | 3572.113841 | 1.267555556 |
| 26 | 2857.15649 | 1.513356 | 3643 | 1.582052995 | 3770 | 1.603874415 | 3863.804939 | 1.205703704 |
| 27 | 3200 | 1.400312 | 4061 | 1.506457359 | 4113 | 1.38410154 | 4170.432437 | 1.143851852 |
An important aspect that we can see is that independently of the model that we used the behavior of the cochlea follows the same pattern, that is the curve of the response, is not linear and approximately logarithmic. From this response we can conclude that psychoacoustic response has reflected the behavior that we can observe in the cochlea as the models show, that is the Mel scale or Bark scale have their causes because they follows the cochlear response.
As it was hope then the outer ear response depends almost of the inner ear behavior, and middle ear has a little repercussion in the speech analysis because of it works as an impedance coupler between outer ear and inner ear.
The last situation was the principle aspect that we use to indicate that we can obtain a set of parameters from the cochlea behavior as we use features as MFCC or PLP for Automatic Speech Recognition tasks with the difference that the behavior of the cochlea is nearer to the response of the nervous system of the human body.
The next figure 5 represents spectral representation of one segment of the speech signal. These spectral representations were obtained after of the speech signal was passed by triangular bank filters constructed from our proposal. At this moment we have a set of mechanical models of the human cochlea that describe how the sound signal affects to the basilar membrane.
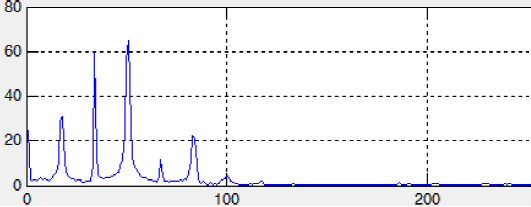
Fig. 5 Spectral representation of one segment of speech signal after that they are processed by the triangular bank filters proposed in this work
We must to remember that the movement of the basilar membrane must to excite to a set of cilios cells that send an electric signal to the hearing nervous that send this signal to nucleus cochlear.
One of the most important aspects that we can see from the curves is that the values used for the frequency causes a specific excitation in a specific distance into the cochlea, this aspect follows the response that Von Békésy mentioned in his place theory. From this response of the cochlea we could propose that a filter bank with a triangular form is adequate to analyze this behavior, because the response is punctual as show figure of the presion in the basilar membrane.
For this work we propose that triangular bank filter is accepted aunque another important design can be used. Then now we have enough elements for to have a new set of parameters based on the analysis before described.
Next, we are going to explain how we can obtain a set of parameters for ASRs tasks from these ideas. As we mentioned above, the Neely model and later works have considered putting a number of these micro-mechanisms along the cochlea at the same distance between them. For that, this principle to establish the following relation between a minimal and maximal distance was use:
In 5 dmin and dmax are obtained from Figures 5 for each case, considering that Fmin=300 Hz and Fmax=4.5 KHz. This paper proposed a space equidistant between different points to analyze the cochlea. After that, for each distance one specifically frequency of excitation to the Basilar Membrane was obtained. Figure 5 shows this behavior.
From the last analysis a computational model to obtain the distance, where the maximum displacement of the basilar membrane occurs to a specific excitation frequency of the system was developed, which depends of the physical characteristics of the basilar membrane. The following procedure describes the computational model of the cochlea using this proposal [20]. It is important to mention that the maximum response of the pressure curve used in [19] was obtained.
The first experimental used a database that contains only digits in the Spanish language and the characteristics of the samples were frequency sample 11025, 8 bits per sample, PCM coding, mono-stereo.
The evaluation of the experiment proposed involved 5 people (3 men and 2 women) with 300 speech sentences to recognize for each one ( 100 for training task and 200 for recognition task). 1500 speech sentences extracted from 5 speakers individually were taken, and the Automatic Speech Recognition trained using Hidden Markov Models with 6 states (4 states with information and 2 dummies to connection with another chain). Also, 3 Gaussian Mixture for each state in the Markov chain were employed.
The parameters extracted from the speech signal were 39 (13 MFCC, 13 delta and 13 energy coefficients) when using MFCC or our proposal, and used to train the Hidden Markov Model.
It is important to mention that HTK give us results in two forms: by sentence and by words http://htk.eng.cam.ac.uk. We show both for reasons of consistency.
Table 3 contains results obtained in percentage when using LPC, CLPC and MFCC, DELTA, ACCELERATION AND THIRD DIFFERENTIAL. We can see clearly that MFCC giving us a good performance with respect LPC or CLPC parameters, then we obviously used these parameters to compare with our proposal.
Table 3 LPC, CLPC, MFCC and delta; acceleration, delta, and third differential coefficients
| SENTENCES | WORDS | ||||||
|---|---|---|---|---|---|---|---|
| PARAM/# STATE | 4 | 5 | 6 | PARAM/#STATE | 4 | 5 | 6 |
| LPC | 77 | 89.5 | 9 | LPC | 77.39 | 89.95 | 89.45 |
| CLPC | 89.5 | 99 | 9 | CLPC | 89.95 | 99.5 | 99.5 |
| MFCC | 98.5 | 99 | 9 | MFCC | 98.99 | 99.5 | 99.5 |
| CMCC KU | 100 | 100 | 100 | CMCC KU | 100 | 100 | 100 |
| CMCC ELLIOT | 100 | 100 | 100 | CMCC ELLIOT | 100 | 100 | 100 |
| CMCC NEELY | 100 | 100 | 100 | CMCC NEELY | 100 | 100 | 100 |
| CMCC RESONAN | 99.4 | 99.6 | 99.8 | CMCC RESONAN | 99.6 | 99.8 | 99.8 |
In the second experiment, a corpus elaborated by J. Hansen at the University of Colorado Boulder was used. He has constructed database SUSAS (Speech Under Simulated and Actual Stress) http://catalog.ldc.upenn.edu/LDC99S78. Only 9 speakers with ages ranging from 22 to 76 were used and we applied normal corpus not under Stress sentences contained into corpus.
The words were "brake, change, degree, destination, east, eight, eighty, enter, fifty, fix, freeze, gain, go, hello, help, histogram, hot, mark, nav, no, oh, on, out, point, six, south, stand, steer, strafe, ten, thirty, three, white, wide, & zero".
A total of 4410 files of speech were processed. Finally, Tables 4 shows results when using our proposal (Cochlear Mechanics Cepstrum Coefficients -CMCC-) the best representations used in the state of the art and in the last experiment versus MFCC in SUSAS corpus. As we can see a new form to obtain feature for ASRs tasks is better with respect traditionally MFCC.
Table 4 Results obtained using HTK, SUSAS Corpus and automatic labeling
| boston 1 | ||||||||||
| SENTENCE | WORD | H | S | N | H | D | S | I | N | |
| CMCC_Elliot | 90.2 | 90.48 | 221 | 24 | 245 | 228 | 7 | 17 | 0 | 252 |
| CMCC_Empirico | 93.06 | 93.25 | 228 | 17 | 245 | 235 | 7 | 10 | 0 | 252 |
| CMCC_Greenwood | 93.88 | 94.05 | 230 | 15 | 245 | 237 | 7 | 8 | 0 | 252 |
| CMCC_Ku | 92.65 | 92.86 | 227 | 18 | 245 | 234 | 7 | 11 | 0 | 252 |
| CMCC_L&B_RA | 90.2 | 90.48 | 221 | 24 | 245 | 228 | 7 | 17 | 0 | 252 |
| MFCC | 91.84 | 92.06 | 225 | 20 | 245 | 232 | 7 | 13 | 0 | 252 |
| CMCC_Neely | 91.43 | 91.67 | 224 | 21 | 245 | 231 | 7 | 14 | 0 | 252 |
| boston 2 | ||||||||||
| SENTENCE | WORD | H | S | N | H | D | S | I | N | |
| CMCC_Elliot | 94.69 | 94.84 | 232 | 13 | 245 | 239 | 7 | 6 | 0 | 252 |
| CMCC_Empirico | 94.29 | 94.44 | 232 | 13 | 245 | 239 | 7 | 6 | 0 | 252 |
| CMCC_Greenwood | 94.69 | 94.84 | 232 | 13 | 245 | 239 | 7 | 6 | 0 | 252 |
| CMCC_Ku | 95.51 | 95.63 | 234 | 11 | 245 | 241 | 7 | 4 | 0 | 252 |
| CMCC_ L&B_RA | 93.88 | 94.05 | 230 | 15 | 245 | 237 | 7 | 8 | 0 | 252 |
| MFCC | 95.1 | 95.24 | 234 | 11 | 245 | 241 | 7 | 4 | 0 | 252 |
| CMCC_Neely | 93.47 | 93.65 | 230 | 15 | 245 | 237 | 7 | 8 | 0 | 252 |
| boston 3 | ||||||||||
| SENTENCE | WORD | H | S | N | H | D | S | I | N | |
| CMCC_Elliot | 93.47 | 93.65 | 229 | 16 | 245 | 236 | 7 | 9 | 0 | 252 |
| CMCC_Empirico | 96.33 | 96.43 | 236 | 9 | 245 | 243 | 7 | 2 | 0 | 252 |
| CMCC_Greenwood | 96.73 | 96.83 | 237 | 8 | 245 | 244 | 7 | 1 | 0 | 252 |
| CMCC_Ku | 95.92 | 96.03 | 235 | 10 | 245 | 242 | 7 | 3 | 0 | 252 |
| CMCC_L&B_RA | 92.65 | 92.86 | 227 | 18 | 245 | 234 | 7 | 11 | 0 | 252 |
| MFCC | 96.73 | 96.83 | 237 | 8 | 245 | 244 | 7 | 1 | 0 | 252 |
| CMCC_Neely | 96.73 | 96.83 | 237 | 8 | 245 | 244 | 7 | 1 | 0 | 252 |
| general 1 | ||||||||||
| SENTENCE | WORD | H | S | N | H | D | S | I | N | |
| CMCC_Elliot | 97.14 | 96.83 | 238 | 7 | 245 | 244 | 7 | 1 | 0 | 252 |
| CMCC_Empirico | 95.51 | 95.63 | 234 | 11 | 245 | 241 | 7 | 4 | 0 | 252 |
| CMCC_Greenwood | 96.73 | 96.43 | 237 | 8 | 245 | 243 | 7 | 2 | 0 | 252 |
| CMCC_Ku | 96.73 | 96.83 | 237 | 8 | 245 | 244 | 7 | 1 | 0 | 252 |
| CMCC_L&B_RA | 95.51 | 95.24 | 234 | 11 | 245 | 240 | 7 | 5 | 0 | 252 |
| MFCC | 96.73 | 96.83 | 237 | 8 | 245 | 244 | 7 | 1 | 0 | 252 |
| CMCC_Neely | 96.33 | 96.43 | 236 | 9 | 245 | 243 | 7 | 2 | 0 | 252 |
| general 2 | ||||||||||
| SENTENCE | WORD | H | S | N | H | D | S | I | N | |
| CMCC_Elliot | 96.33 | 96.43 | 236 | 9 | 245 | 243 | 7 | 2 | 0 | 252 |
| CMCC_Empirico | 95.92 | 96.03 | 235 | 10 | 245 | 242 | 7 | 3 | 0 | 252 |
| CMCC_Greenwood | 95.92 | 96.03 | 235 | 10 | 245 | 242 | 7 | 3 | 0 | 252 |
| CMCC_Ku | 95.1 | 95.24 | 233 | 12 | 245 | 240 | 7 | 5 | 0 | 252 |
| CMCC_L&B_RA | 93.06 | 93.25 | 228 | 17 | 245 | 235 | 7 | 10 | 0 | 252 |
| MFCC | 94.29 | 94.44 | 231 | 14 | 245 | 238 | 7 | 7 | 0 | 252 |
| CMCC_Neely | 94.29 | 94.44 | 231 | 14 | 245 | 238 | 7 | 7 | 0 | 252 |
| general 3 | ||||||||||
| SENTENCE | WORD | H | S | N | H | D | S | I | N | |
| CMCC_Elliot | 94.29 | 94.44 | 231 | 14 | 245 | 238 | 7 | 7 | 0 | 252 |
| CMCC_Empirico | 93.88 | 94.05 | 230 | 15 | 245 | 237 | 7 | 8 | 0 | 252 |
| CMCC_Greenwood | 93.88 | 94.05 | 230 | 15 | 245 | 237 | 7 | 8 | 0 | 252 |
| CMCC_Ku | 93.06 | 93.25 | 228 | 17 | 245 | 235 | 7 | 10 | 0 | 252 |
| CMCC_L&B_RA | 94.69 | 94.84 | 232 | 13 | 245 | 239 | 7 | 6 | 0 | 252 |
| CMCC_MFCC | 93.47 | 93.65 | 229 | 16 | 245 | 236 | 7 | 9 | 0 | 252 |
| CMCC_Neely | 95.10 | 95.24 | 232 | 13 | 245 | 239 | 7 | 6 | 0 | 252 |
| nyc1 | ||||||||||
| SENTENCE | WORD | H | S | N | H | D | S | I | N | |
| CMCC_Elliot | 92.24 | 92.06 | 226 | 19 | 245 | 232 | 7 | 13 | 0 | 252 |
| CMCC_Empirico | 91.84 | 92.06 | 225 | 20 | 245 | 232 | 7 | 13 | 0 | 252 |
| CMCC_Greenwood | 91.02 | 91.27 | 223 | 22 | 245 | 230 | 7 | 15 | 0 | 252 |
| CMCC_Ku | 90.61 | 90.48 | 222 | 23 | 245 | 228 | 7 | 17 | 0 | 252 |
| CMCC_L&B_RA | 93.06 | 92.86 | 228 | 17 | 245 | 234 | 7 | 11 | 0 | 252 |
| MFCC | 91.84 | 92.06 | 225 | 20 | 245 | 232 | 7 | 13 | 0 | 252 |
| CMCC_Neely | 92.24 | 92.06 | 226 | 19 | 245 | 232 | 7 | 13 | 0 | 252 |
| nyc2 | ||||||||||
| SENTENCE | WORD | H | S | N | H | D | S | I | N | |
| CMCC_Elliot | 94.29 | 94.44 | 231 | 14 | 245 | 238 | 7 | 7 | 0 | 252 |
| CMCC_Empirico | 93.47 | 93.65 | 229 | 16 | 245 | 236 | 7 | 9 | 0 | 252 |
| CMCC_Greenwood | 93.88 | 94.05 | 230 | 15 | 245 | 237 | 7 | 8 | 0 | 252 |
| CMCC_Ku | 91.84 | 92.06 | 225 | 20 | 245 | 232 | 7 | 13 | 0 | 252 |
| CMCC_L&B_RA | 89.8 | 90.08 | 220 | 25 | 245 | 227 | 7 | 18 | 0 | 252 |
| MFCC | 91.02 | 91.27 | 223 | 22 | 245 | 230 | 7 | 15 | 0 | 252 |
| CMCC_Neely | 89.39 | 89.68 | 219 | 26 | 245 | 226 | 7 | 19 | 0 | 252 |
| nyc3 | ||||||||||
| SENTENCE | WORD | H | S | N | H | D | S | I | N | |
| CMCC_Elliot | 95.1 | 95.24 | 234 | 11 | 245 | 241 | 7 | 4 | 0 | 252 |
| CMCC_Empirico | 93.88 | 94.05 | 232 | 13 | 245 | 239 | 7 | 6 | 0 | 252 |
| CMCC_Greenwood | 93.47 | 93.65 | 229 | 16 | 245 | 236 | 7 | 9 | 0 | 252 |
| CMCC_Ku | 93.06 | 93.25 | 229 | 16 | 245 | 236 | 7 | 9 | 0 | 252 |
| CMCC_L&B_RA | 89.39 | 89.68 | 221 | 24 | 245 | 228 | 7 | 17 | 0 | 252 |
| MFCC | 94.69 | 94.84 | 242 | 10 | 245 | 242 | 7 | 3 | 0 | 252 |
| CMCC_Neely | 94.29 | 94.44 | 234 | 11 | 245 | 241 | 7 | 4 | 0 | 252 |
Then we demonstrate that if we use CMCC (Cochlear Mechanics Cepstrum Coefficients) is an interesting alternative in this research area.
6 Conclusions and Future Work
This paper describes new parameters for ASRs tasks. They employ the functionality of the cochlea, the most important hearing organ of humans and mammalians. At this moment, the parameters used for the MFCC analysis have been demonstrated to be the most important parameters and the most used for this task.
The interest of this paper is show the implementation of the cochlear models in Automatic Speech Recognition tasks. We show that the theory of these models can be used to obtain parameters from the speech signal and used as input to the Hidden Markov Model Toolkit. Also, the paper showed an analytic solution to the Lesser & Berkley model (this model was proposed in 1972 and is based in the mechanical fluid and its solution used the Fourier series), that is based in the resonance analysis proposed by Helmholtz. After that we show a mathematical expression can be compared with another used in the State of the Art, for example the equation of Greenwood and another obtained empirically.
Also we used mechanical model of the cochlea proposed by Neely named micro and macro mechanical, for that we solved the equation system of the model and we determinate the frequency of excitation into the human cochlea for two variants of this model that exists in the state of the art of cochlear mechanics linear that use the same operating principle.
This article demonstrated that our proposal is very interesting because the performance reached was adequate and can be used to obtain speech signal parameters for Automatic Speech Recognition.
In conclusion, the cochlea behavior can be used to obtain these parameters and the results are adequate. Another aspect to consider for future work is obtain an equation to extract the frequency place relation in model Neely's. And to have an analysis of noise to compare the results when this aspect is add to speech signal and to see in real situations how the results are obtained.


 nueva página del texto (beta)


