1 Introduction
Since from the last two decades, FTS method has been considered as a popular topic in research because of handling the ambiguity and incomplete information more efficiently in decision making (DM) system.
At first, Zadeh [1] implemented fuzzy set theory to challenge the linguistic terms in the fuzzy set.
Later, by adopting the fuzzy set concept, Song and Chissom [2, 3] first developed FTSF model and solved most of the forecasting issues in the DM problem.
Later, Chen [4] modified the FTS model by using simple arithmetic operation instead of complex matrix operations. During the 90’s, many researchers used simplex structure for forecasting and due to the simplex structure, the first order FTS models have been facing more difficulties to forecast complex data.
By considering the above difficulties, Chen et al. [5] proposed high order FTS to forecast the student enrolment records. After that, many researchers [–9] have continued their research in this domain to increase the accuracy of fuzzy forecasting model.
Recent papers [–24] provide detailed literature on different steps of FTSF.
However, in the proposed FLSTM model we mainly concentrated on two major concepts such as: (1) to determine the NOIs of the UOD and to make partition the UOD into different intervals of equal proportion, the TBD approach [10] is applied, and (2) the subscript of the fuzzy set associated with the crisp observation is considered to establish the FLRs and later it is modeled using LSTM.
In the last few years, the interval determination methods faced difficulties to determine the LOI, and which is not clear to date.
In 2001, Huarng [7] proposed average and distribution based procedure to partition the UOD into equal proportion of length.
Later Panigrahi and Behera [17] proposed modified average based method, to obtain the intervals of the UOD with equal proportion.
Pattanayak et al. [20] proposed an entropy based neutrosophic model where an adaptive based partition method is considered to partition the time series into unequal length of intervals. The adaptive partition method improves the forecasting efficiency of the model by removing the outliers in the time series more efficiently.
Huarng and Yu [25] obtained an unequal proportion of length of the UOD by employing ratio based method.
Many researchers [26–29] also considered evolutionary algorithms (EAs) to optimize the LOI. But defining the initial parameter is an important factor in the efficiency of EA methods.
Motivated by this, in the present study we considered the TBD approach [10] to attain the NOIs of TS data and later it splits the UOD into equal proportion of length.
Coming to the concept of FLR, many researchers have followed different methods to model the FLRs for different FTSF model. In most of the research, the authors have been using either the highest membership or all membership values of the element to establish the FLRs. Pattanayak et al. [10] proposed a probabilistic intuitionistic model and considered a combination of mean of membership values and the data element to establish the FLRs. Researchers [8, 16, 30] considered all membership values of each interval and used it to model the FLR by using different neural network models.
Pattanayak et al. [11] considered both data and all membership values to establish the FLRs. Although by considering all membership values saves the loss of information in forecasting but it increases the size of the input pattern into high, which reduces the performance of the FTSF model. Observing from this, we have considered the subscript value of the fuzzy set related to the crisp observation to establish the FLRs of the TS data.
The rest of this research are formed as follows. Section 2, explains the preliminaries including different definitions of FTS, the working principle of LSTM. Section 3, demonstrates the execution process of proposed FLSTM model. Section 4, explains the experimental analysis. Section 5, explains the feature of the FLSTM model and highlights the future extension of the work.
2 Background Study
2.1 Definition of FTS
A conventional TS,
Definition 1 [11]:
Suppose
where
Definition 2 [11]:
Let in FTS, the instant
Definition 3 [11]:
Let in FTS, the instants
2.2 Concept of LSTM
In 1977, Hochreiter and Schmidhuber [31] developed a deep learning technique as long short term memory (LSTM) is another version of the recurrent neural network model. Unlike the traditional neural network model where the input data flows in a forward direction only, in LSTM due to a feedback connection in the architecture the data can be processed both in backward as well as the forward direction. The architecture of LSTM comprises three distinct layers namely the input layer, the hidden layer, and the output layer. The neurons in the hidden layer are connected self recurrently memory cells and expect from this the hidden layer consists of a special memory block to regulate the information transmission.
The memory unit is the collection of three gates such as the input gate, forget gate, and output gate. The different gates in the memory block are used to control the flow of information considering either by adding information or by removing information in the memory cell. The input gate controls the flow of activated values into the cell. The output gate controls the flow of computed output values of a cell, which transmits the output to other neurons.
Similarly, the forget state is responsible to discard the information from the memory cell which are less importance and no longer used in the network. In the present study the LSTM technique is considered to model the FLRs for the FLSTM model.
3 Methodology
Algorithm 1 explains the execution process of the proposed FLSTM model. The first few steps of the algorithm explains the different procedures used to obtain the RTV data of the TS data. The NOIs of the TS data are determined using TBD approach [10].
The subscript of the fuzzy set associated with the crisp observation is considered to establish the FLRs for the FLSTM model and later it is modeled by LSTM model. After that, the forecasted data are de-normalized and then the de-normalized values are defuzzified to get the actual forecasted value of the TS data.
4 Experimental Setup and Results
The present study considered the Taiwan capitalization weighted stock index (TAIEX) TS data from the year 2005 to 2010 (as shown in Table 1), and three profound forecasting models as Aladag et al. [21], Aladag [23], and Bas et al. [14] to investigate the forecasting accuracy of the proposed FLSTM model. All the models are implemented using MATLAB R2018b.
Table 1 Description of different TS data
| Year wise TAIEX TS Data | Total pattern | In-Sample data (85% of the TS data) | Out of sample data (15% of the TS data) | NOIs of the TS data | |
| Train (70% of the TS data) | Validation (15% of the TS data) | Test (15% of the TS data) | |||
| 2005 | 247 | 173 | 37 | 37 | 39 |
| 2006 | 247 | 173 | 37 | 37 | 39 |
| 2007 | 243 | 170 | 36 | 37 | 41 |
| 2008 | 248 | 174 | 37 | 37 | 39 |
| 2009 | 248 | 174 | 37 | 37 | 42 |
| 2010 | 250 | 175 | 38 | 37 | 39 |
In all compared models the UOD of the TS data is calculated as
In the proposed model the NOI of the TS data is obtained using TBD approach [10] and the same NOI value is considered in all compared models for partitioning the UOD into equal length of intervals. ACF function is employed to find the order of the TS data.
The subscript of the fuzzy set associated with the crisp observation is considered to establish the FLRs for the FLSTM model and later it is modeled by using LSTM. Each pattern in the experiment breaks into in-sample and out of sample pattern and the values are represented in Table 1. To find the efficiency of the FLSTM model, two error measures such as root mean square error (RMSE) and symmetric mean absolute percentage error (SMAPE) (as shown in Eq. (2-3)) are considered:
where
In the experimental analysis, all four models are executed fifty number of times by conceding RMSE and SMAPE measure.
Table 2 presents the mean value of fifty executions resulted from different FTSF models considering RMSE measure.
Table 2 Mean RMSE result of different FTSF model (Best value is in Bold)
| Year wise TAIEX TS data | Aladag et al. [21] | Aladag [23] | Bas et al. [14] | Proposed FLSTM |
| Mean | Mean | Mean | Mean | |
| 2005 | 6243.39 | 154.84 | 110.02 | 58.69 |
| 2006 | 7475.06 | 426.60 | 429.46 | 65.93 |
| 2007 | 8428.90 | 375.23 | 393.05 | 203.67 |
| 2008 | 4440.41 | 2517 | 2517 | 169.26 |
| 2009 | 7751.75 | 995.09 | 566.11 | 139.36 |
| 2010 | 8584.86 | 509.92 | 462.33 | 55.15 |
Table 3 presents the mean value of fifty executions resulted from different FTSF models considering SMAPE measure. The analysis result from both Table 2 and Table 3 noticed that, the proposed FLSTM model outperforms in all six TS datasets using RMSE as well as SMAPE measure.
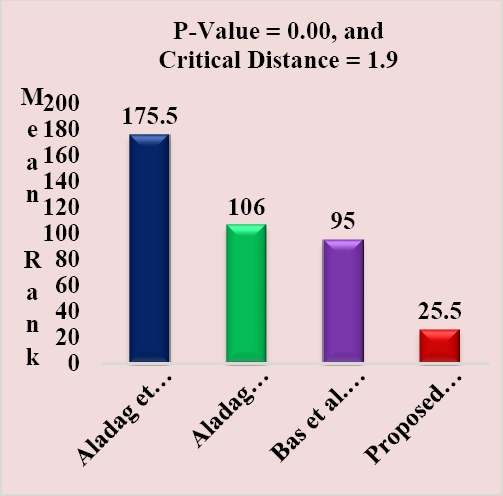
The above analysis results concludes the outperformance of the FLSTM model than its competitor FTSF models. Later, to make a robust comparison the SMAPE result of all datasets together are collected and employed a Nemenyi [32] hypothesis test is performed with confidence level of 95%.
The obtained result from the hypothesis [32] are shown in Figure 1. From Fig 1 it clearly shows that, the proposed FLSTM model has the smaller mean rank 25.5 among all FTSF models.
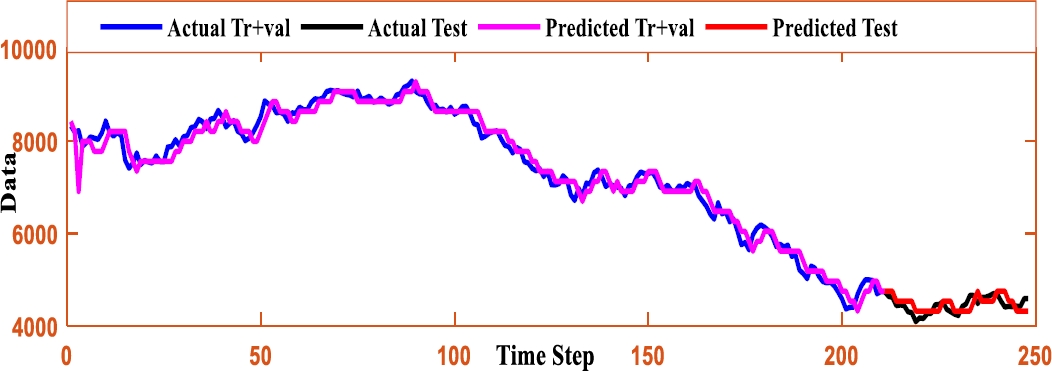
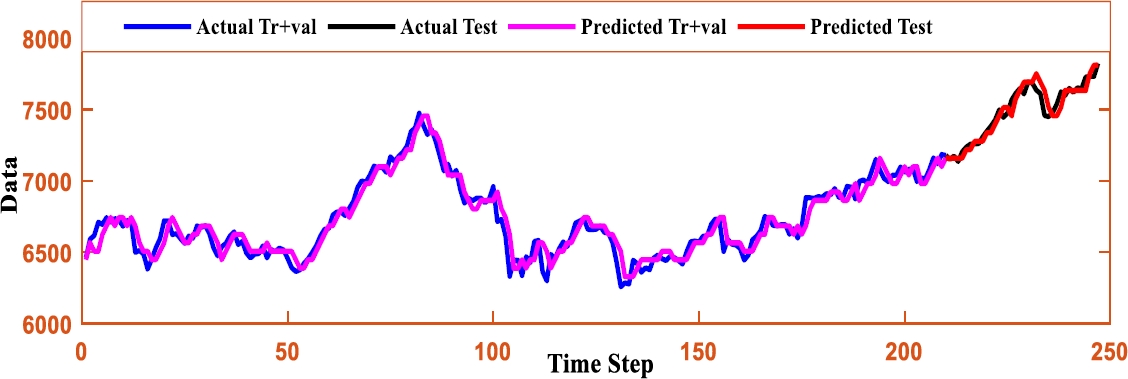
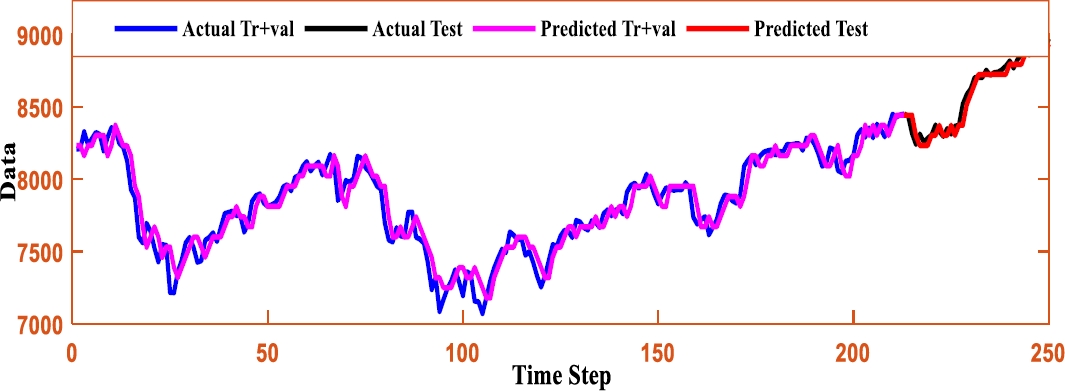
The above analysis proves the proposed FLSTM model is more robust in nature than its competitor models. In order to show the intimacy among the TS data and the forecasted value resulted on the TAIEX TS data for the year 2005 to 2010 are depicted as shown in Figure (2-7).
5 Conclusion
The present research introduced a FTSF model using LSTM to forecast a wide range of TS datasets. To confirm the forecasting efficiency of the proposed FLSTM model, three profound FTSF models and the TAIEX TS data for six consecutive years from 2005 to 2010 are considered. The comparative result based on Table 2 and Table 3, proves the outperformance of the FLSTM model on each dataset than the competitors by employing both the RMSE and SMAPE measure. Later, by considering all datasets together, a Nemenyi [32] hypothesis is conducted to test the statistical superiority of the FLSTM model. The outcome of the Nemenyi [32] hypothesis test from Fig 1 represents the statistical supremacy of the FLSTM model with lowest mean rank 25.5 than the competitors.
In the future, to increase the accuracy of the FTSF model one can use (1) any optimization techniques to obtain the membership value, (2) instead of using conventional FST, one can use either hesitant FST or neutrosophic FST can be employed to establish the fuzzification, and (3) instead of using ACF function one can use any significant input variable selection procedure to define the order of the TS data.


 nueva página del texto (beta)


