Introduction
The energy consumed by the buildings’ operation is around one third of the total energy consumption worldwide (International Energy Agency (IEA), 2019). Thus, there is a worldwide effort to reduce the energy consumption in buildings.
Building thermal simulation (BTS) also named building energy simulation (BES) programs like EnergyPlus (Crawley et al., 2001; US Departament of Energy (DOE), 2016) and (TRNSYS, 2020) are important tools used to evaluate the building energy consumption and thermal comfort at the design-stage of new buildings and for the retrofitting design of existing buildings (Belleri et al., 2014).
The building envelope is composed by all the elements (walls, roofs, floors, windows, doors, etc.) that separate the interior from the exterior of the building. The heat transfer through the building envelope has a great influence on the indoor thermal conditions when the building is not air-conditioned (nAC) and in the energy consumption when it is air-conditioned (AC).
The heat transfer through walls, doors and roofs of the building envelope can be calculated considering or ignoring the thermal mass of its components. The thermal mass of an envelope component is its capacity to store thermal energy. Thermal mass is also known as heat capacity or thermal capacitance. When the thermal mass of the envelope components is being considered, implicitly the time-dependent model (D-model) of the heat transfer through the envelope components is being used. When the thermal mass is not taken into account, implicitly the time-independent model (I-model) of the heat transfer through the envelope components is being used. When using the D-model the thermal properties: thermal conductivity, density and specific heat of each material that forms a constructive system of the envelope component must be known. In contrast, when using the I-model the only thermal property involved is the thermal conductivity. In D-models the order of material layers of the envelope components becomes relevant (Al-Regib & Zubair, 1995; Huelsz et al., 2014; Leccese et al., 2018). In I-models outdoor and indoor temperatures are considered constant in time, and therefore the temperature in any envelope component location is constant in time. In this condition there is no effect of the thermal mass of the envelope component and it can be characterized only by its thermal resistance (R-value) or its inverse, i.e., the thermal transmittance of the envelope component (U- value). R-value is independent of the layers’ order and its calculation only involves the thermal conductivity and thickness of each layer of the envelope component. The mathematical equations for the heat transfer of the D-model and I-model can be found in Huelsz et al. (2014).
The term dynamic thermal simulations is generally used to refer that the heat transfer D-model is been used, and therefore, the thermal mass is being considered (Ferrari & Zanotto, 2016; Magrini et al., 2014; Petojević et al., 2018). Nevertheless, there are some authors that use the term dynamic to specify that the weather variations are taken into account in the simulation, but they only use the thermal resistance or the thermal transmittance of the envelope elements to calculate the building’s thermal behavior. Thus, they are implicitly using the I-model to account for the heat transferred through these components. For these cases the thermal mass is not being considered.
In the context of building envelope thermal performance, the term quasi-steady state is been used with three different meanings. The most widely used of which specifies that weather variations are considered for each time-step, and that the model used for the heat transfer through the envelope elements is time-independent (Medina, 1999; Sedighi et al., 2017; Winiarski & O’Neal, 1996). Another meaning ascribed to the term quasi-steady state specifies that a correction factor is added in the time- independent heat balance equation to account for the thermal mass of the component (Corrado & Fabrizio, 2007; Magrini et al., 2014). This meaning is used in the standard ISO 13790 (ISO, 2008) as well as in its updated version the ISO 52016 (Ferrari & Zanotto, 2016; ISO, 2017). The least used of its meanings specifies that the periodic temperature at any location of the element is achieved after all transients have died out, when periodic outdoor conditions are considered in a simulation (Tsilingiris, 2006).
Some authors have pointed out the importance of considering the thermal mass for the simulations of heat transfer through the opaque components of the envelope, especially for weather conditions with large outdoor air temperature variations (during a 24-hour period) and with high solar radiation (Al-Regib & Zubair, 1995; Huelsz et al., 2014; Kuehn et al., 2001; Magrini et al., 2014; Moinard & Guyon, 2000; Petojević et al., 2018; US Departament of Energy (DOE), 2016). Experimental results on this type of weather conditions have pointed out the relevance of the thermal mass on the thermal behavior of envelope components (Brambilla et al., 2018; Sugo et al., 2004; Thomas et al., 2020).
One consequence of not considering the thermal mass is the overestimation of required insulating material. For example, in temperate zones these materials may be suitable for winter, but generally, may not be suitable for summer. This is especially true in the case of nAC buildings (Huelsz et al., 2014), and some authors have pointed out that this will be worst as climate change progresses (Grygierek & Ferdyn, 2018; McLeod et al., 2013; Mulville & Stravoravdis, 2016).
All studies found in the literature that have compared results obtained by using different heat transfer models in terms of the time-dependency for the heat transfer through opaque components of the envelope were made for AC buildings. Only one of these studies presented results for both types of operating conditions (AC and nAC) (Huelsz et al., 2014). This work simulated the heat transfer through the roof of a room, considered as a single element, using the I- model and the D-model. This study tested four roof constructive systems with the same total thickness. It showed that there were large differences between both models, especially for no-air-conditioned condition. The I- model overestimated D-Model results, differences of the thermal loads for air-conditioned condition were up to 83 % and differences of the transmitted energy for non-air-conditioned condition were up to 824 %. The largest differences between models were shown by the constructive system composed of an insulation layer (with a low thermal mass) at the outdoor side and a layer composed of a massive material (with a large thermal mass) at the indoor side. As expected, the smallest differences were shown by the constructive system composed of a single layer of the insulating material (with a low thermal mass).
There has been a great effort to develop simple methods to account for the thermal mass of the building components for AC buildings. Such is the case of the ISO standards, 13790 and 52016, and the PHPP program. Some studies addressed the comparison of the results derived from these methods with the results obtained from a BTS program such as TRNSYS or EnergyPlus (Ballarini et al., 2018; Bouzarovski & Simcock, 2017; De Lieto Vollaro et al., 2015; Evangelisti et al., 2014a, 2014b; Ferrari & Zanotto, 2016; Kim et al., 2013; Modi et al., 2005; Saelens et al., 2004; Wauman et al., 2013; Zakula et al., 2019).
Another study related to the subject was made by Al-Regib & Zubair 1995). These authors simulated the heat transfer through three different insulated walls of the same total thickness using the I-model and the D- model, while considering the wall as a single element and AC. The position of the insulation within the wall was varied having insulation on the outdoor surface, indoor surface and middle of the wall. The heat flux at the indoor surface was calculated when a sudden change of temperature in the outdoor wall surface was applied using the D-model. This value was compared to the corresponding value calculated using the I-model. It showed that the heat flux calculated with the D-model was always smaller than that obtained from the I-model.
As afore mentioned, some authors have already pointed out that not considering the thermal mass of the constructive systems can give erroneous performance predictions, especially in climates with large outdoor variations during a 24-hours period. Despite this fact, some practitioners and researchers do not take into account the thermal mass (use of the I-model). Even when using programs such as EnergyPlus they utilize the no-mass option. Some practitioners erroneously believe that not considering the thermal mass will only affect the moment when power demand peaks while not altering total energy demand. Despite its climates, the Mexican national building standards and house rating system do not take into account the thermal mass of the constructive systems.
From the literature review it can be concluded that all previous studies have been made for AC buildings except the one (Huelsz et al., 2014), in which the differences for the thermal performance were calculated considering the constructive systems as single elements. Thus, the objective of this work is to demonstrate and quantify the importance of considering the thermal mass (implicitly using D-model for the heat transfer through the building components) in the thermal simulations of an entire nAC building with internal thermal loads and infiltration. The simulations were carried out with EnergyPlus. The simulated building was the house used for the development of the official Mexican standard NOM-020-ENER-2011 (Secretaría de Energía (SENER), 2011). The house is considered to be in a large Mexican city with a hot summer and a mild winter. Five cases with different constructive systems for walls and roofs were considered. The air-conditioned house was also evaluated.
Consideration of thermal mass or absence of it for EnergyPlus simulations
In EnergyPlus the consideration of thermal mass or the absence of it is done by selecting the Conduction Transfer Function as Heat Balance Algorithm (US Departament of Energy (DOE), 2016). The Conduction Transfer Functions are methods used to calculate the one-dimensional time-dependent heat transfer through building components. EnergyPlus uses the state space method (Ceylan & Myers, 1980; Ouyang & Haghighat, 1991; Seem, 1987). To consider the thermal mass (M) in the simulations the object Material is employed for all layers of the constructive systems. In this option the thermal conductivity, specific heat and density of each layer are all set as inputs. So as to not take into account the thermal mass (NM) in the simulations, the object Material: NoMass is employed for all the layers of the constructive systems. In this option the thermal resistance of the constructive system is set as an input. The consideration of thermal mass or the lack of it for the wall/roof constructive systems is the only difference between the two types of simulations performed in this work. It is worth noting that for the calculation of the heat transfer through a window, EnergyPlus always considers every window to be without thermal mass. For the two types of simulations made in this work the heat transfer through windows was simulated using the object WindowMaterial:SimpleGlazingSystem. The thermal mass of furniture was not included in any simulation.
House description
The house considered for the present study has two stories and a constructed area of 100 m2, it is attached to identical houses on both sides. Its main facade is oriented to the North. Sketches of the house are shown in Figure 1. This house is the one used for the development of the official Mexican standard NOM-020-ENER-2011 (Secretaría de Energía (SENER), 2011), as it corresponds to a common house as found in large residential compounds. The house was divided into 8 thermal zones (1st floor: living room, kitchen and bathroom; 2nd floor: bathroom and 3 bedrooms; and stairs). The house was considered without natural ventilation and having an infiltration of 2 ACH, which is the estimated value for this type of houses in Mexico. The schedules for internal heat load due to people occupancy and household appliances, and schedules for air-conditioning (for the air-conditioned house). These schedules are given for both weekdays (Monday to Friday) and weekends (Saturday and Sunday). They are shown in Table 1. All house information and schedules were taken from Martínez (2013). Internal thermal loads by people were considered 60 % convective, 25 % radiative and 15 % latent, while thermal loads produced by appliances were considered to be only convective.
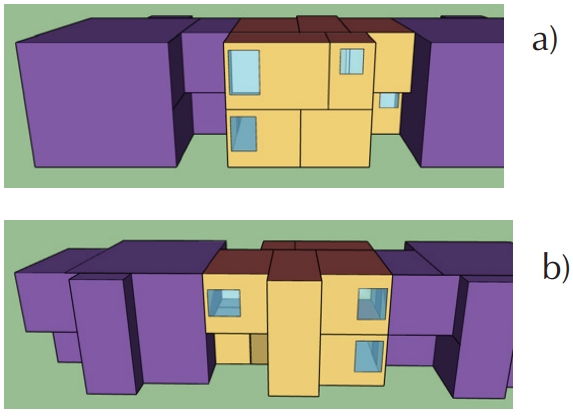
Figure 1 The house with the neighboring houses attached to it, a) front view with the main facade oriented to the North and b) back view
Table 1 Schedules for internal heat loads produced by people and household appliances, and schedules for air-conditioning for the air-conditioned house, both for weekdays (Monday to Friday) and weekends (Saturday and Sunday)
| Description | Weekdays | Weekends |
|---|---|---|
| Occupancy (4 people) | 00:00-10:00 & 17:00-00:00 | All day |
| Refrigerator | All day | All day |
| Kitchen burners | 08:00-09:00 & 18:00-19:00 | 10:00-11:00 & 14:00-16:00 & 18:00-19:00 |
| Lighting | 07:00-08:00 & 17:00-21:00 | 17:00-24:00 |
| Radio | 07:00-08:00 | 09:00-13:00 |
| TV | 17:00-23:00 | 09:00-00:00 |
| Air-conditioning (AC) | 00:00-09:00 & 17:00-00:00 | All day |
Five cases according to the constructive systems of the envelope and internal walls and roofs are evaluated. The three first cases have constructive systems common to Mexico. The walls and roofs for the first case (HDC) are made of high-density concrete. The walls of the second case (NOM) are made of clay brick and the roofs are built with high density concrete. This case has the same constructive systems as those of the NOM-020-ENER-2011 house. The walls of the third case (Adobe) are made of adobe and its roofs are built with high density concrete. The walls and roofs of the fourth case (MEPSM) are built with a new constructive system used in Mexico composed of a layer of high density expanded polystyrene coated on both sides with a layer of cement mortar. The fifth case is a reference case (EPS), its walls and roofs are built with a single layer of a high density expanded polystyrene. This reference case is used in this work due to its large thermal resistance and low thermal mass. However, this case does not have practical applications. The high density expanded polystyrene requires some covering for its protection. As in the MEPSM case this covering adds thermal mass to the system. The four first cases are named the study cases. The study cases and the reference case all have homogeneous layered constructive systems. The properties of the materials used are shown in Table 2. The description for the constructive systems for the four study cases and the reference case are presented in Table 3.
Table 2 Materials, acronyms and thermal properties. The thermal properties a are taken from (Secretaría de Energía (SENER), 2011), and thermal properties b from (Instituto de Energías Renovables Universidad Nacional Autónoma de México (IER-UNAM), 2018)
| Material | Acronym | Thermal conductivity [W/m°C] |
Specific heat [J/kg°C] |
Density [kg/m3] |
|---|---|---|---|---|
| Adobeb | Adobe | 0.580 | 1480 | 1500 |
| Cement mortara | CM | 0.720 | 837 | 1890 |
| Clay bricka | ClayB | 0.810 | 800 | 1600 |
| Elastomeric coatinga | EC | 0.170 | 800 | 1127 |
| Gypsum plastera | GP | 0.372 | 1000 | 800 |
| High density concretea | HDC | 1.740 | 1000 | 2300 |
| High density expanded polystyreneb | EPS | 0.035 | 1400 | 25 |
Table 3 Description of the constructive systems for the four study cases: HDC, NOM, Adobe and MEPSM, and for the reference case EPS. The material layers are presented from exterior to interior with their thickness in parenthesis, dimensions are presented in cm
| Case | Walls constructive system | Roofs constructive system |
|---|---|---|
| HDC | HDC(9.0) | EC(0.2) + HDC(10.0) |
| NOM | CM(1.5) + ClayB(14.0) + GP(1.5) | EC(0.2) + HDC(10.0) + GP(1.5) |
| Adobe | Adobe(30.0) | EC(0.2) + HDC(10.0) + GP(1.5) |
| MEPSM | CM(2.7) + EPS(5.0) + CM(2.7) | EC(0.2) + CM(5.0) + EPS(8.0) + CM(2.7) |
| EPS | EPS(10.4) | EPS(14.7) |
For all cases the solar and visible absorptances are set to 0.5 for walls and 0.7 for roofs, and the thermal absorptance is set to 0.9 for all surfaces. Floors, windows and doors are the same for the five cases. The windows have one 3mm float glass layer. The proportions of envelope area of the different components are: facade walls 44 %, roof 20 %, floor 17 %, walls in contact with the attached houses 12 %, windows 5 % and doors 2 %.
To help to carry out the results analysis the thermal resistance and the thermal mass of the constructive system of walls, R w and C w ; of roofs, R r and C r ; and those of the case, R and C are all presented in Table 4. R and C are the area weighted average of corresponding values of the constructive systems for walls and roofs. This table also indicates the number of layers in the constructive system and whether these layers have similar (s) or contrasting (c) thermal properties. Similar means that all layers are thermal insulating or thermal massive. Contrasting means that the constructive system has both types of materials. It can be observed that the cases have been ordered from the lowest to the largest thermal resistance (case R increasing).
Table 4 The thermal resistance and thermal mass of the constructive system of walls, Rw and Cw; of roofs, Rr and Cr; and the area weighted average of corresponding values of the constructive systems of walls and roofs, R and C. The number of layers in the constructive system and whether the layers of the constructive system have similar (s) o contrasting (c) thermal properties
| Case |
Rw [m2K/W] |
Rr [m2K/W] |
R [m2K/W] |
Cw [kJ/Km2] |
Cr [kJ/Km2] |
C [kJ/Km2] |
W - R layers [ - ] |
|---|---|---|---|---|---|---|---|
| HDC | 0.052 | 0.069 | 0.055 | 207 | 232 | 214 | 1 - 2s |
| NOM | 0.234 | 0.110 | 0.198 | 215 | 244 | 223 | 3s - 3s |
| Adobe | 0.517 | 0.110 | 0.412 | 666 | 244 | 554 | 1 - 3s |
| MEPSM | 1.504 | 2.404 | 1.738 | 87 | 126 | 93 | 3c - 4c |
| EPS | 2.971 | 4.543 | 3.385 | 4 | 6 | 4 | 1 - 1 |
For the present study the house is considered to be in a large Mexican city, Monterrey NL (25.7
◦
N, 100.3
◦
W, 515 m.a.m.s.l.), with a warm semi-arid climate, hot summers and mild winters (García, 2004). The weather file for this city is obtained from Meteotest (2020), it corresponds to the typical year. The evaluations are made for the hottest and coldest months of the year, July and December, respectively. Table 5 presents the climatic conditions for these months: the average of outdoor air temperature,
Table 5 Climatic conditions for July and December, the hottest and coldest months, in Monterrey NL, Mexico. Outdoor air temperature average
| Month |
|
∆Ta |
|
|
|---|---|---|---|---|
| [◦C] | [◦C] | [◦C] | [W/m2] | |
| July | 30.8 | 10.4 | 5.8 | 800 |
| December | 15.9 | 11.1 | 9.1 | 450 |
Thermal mass and non thermal mass simulations comparison
The comparison between the non-air-conditioned house thermal performance results from simulations that take into account the thermal mass of the building components (M) and those that do not (NM) is presented. The comparison between M and NM results for the same house with air-conditioning is also presented. All simulations are performed in EnergyPlus with a time-step of 10 minutes.
Non-air-conditioned house
The simulations of the non-air-conditioned (nAC) house are performed considering the internal heat load schedule as shown in Table 1. Figures 2 and 3 show the indoor air temperature (spatial average weighted with the area of each thermal zone) T i as a function of time t, for a period of 3 days in July and 3 days in December, respectively. The first day is a weekday and the last two days are during the weekend. The sudden increases or decreases of T i are due to the scheduled internal heat loads. It can be observed that all study cases display significant differences between M and NM simulations. And even the reference case (EPS) which has a low thermal mass presents temperature differences between M and NM simulations. These differences are larger during December when the outdoor air temperature has larger oscillation amplitude than in July.
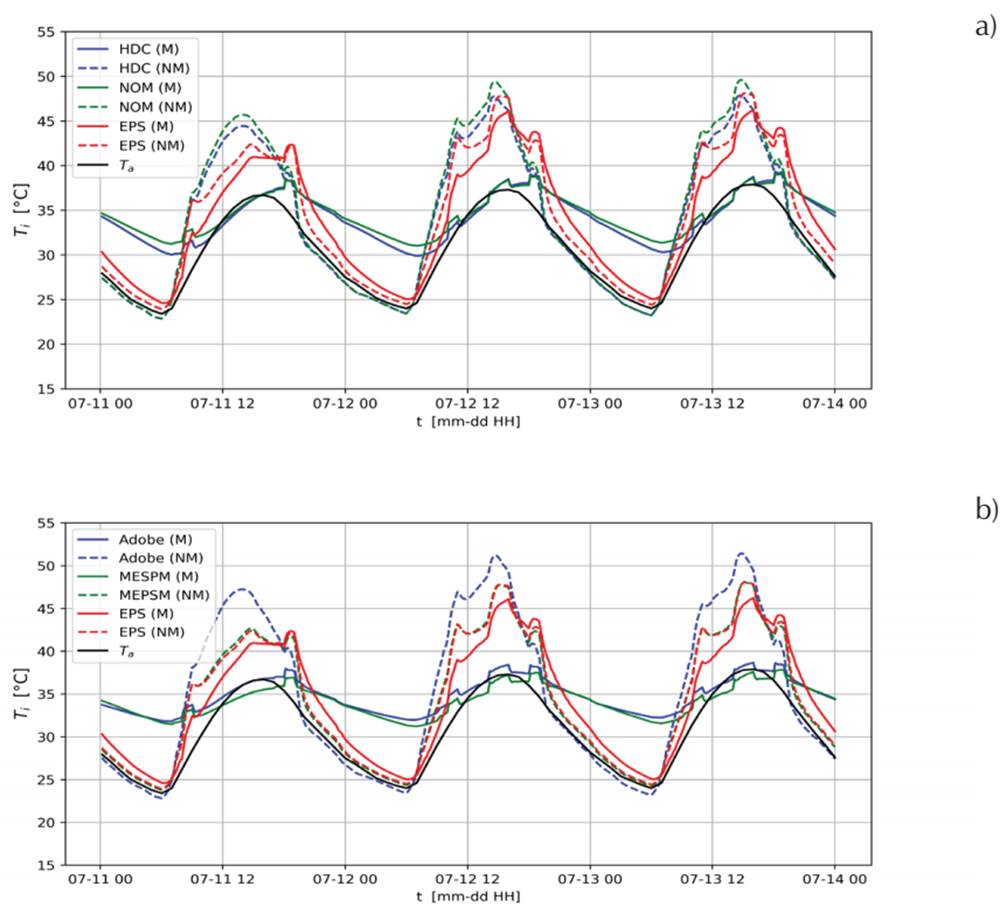
Figure 2 Indoor air temperature T i as a function of time t, for 3 days in July obtained considering the thermal mass, M, and not considering the thermal mass, NM. a) HDC and NOM cases and b) Adobe and MEPSM cases. Results for the EPS case are included as a reference. Outdoor air temperature Ta is also plotted
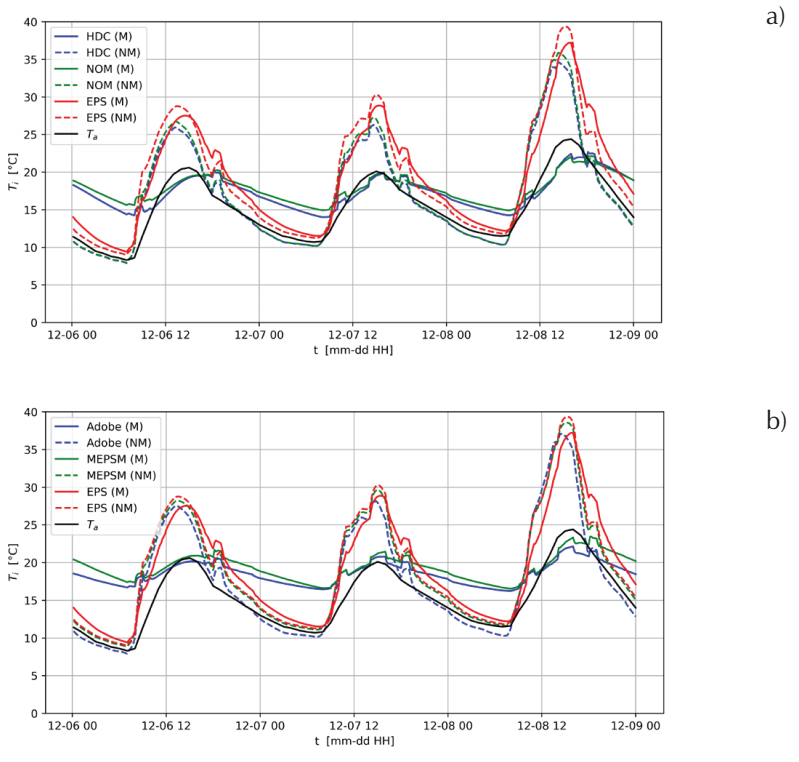
Figure 3 Indoor air temperature Ti as a function of time t, for 3 days in December obtained considering the thermal mass, M, and not considering the thermal mass, NM. a) HDC and NOM cases and b) Adobe and MEPSM cases. Results for the EPS case are included as a reference. Outdoor air temperature Ta is also plotted
For the nAC house the comparison parameter used for the comparison between M and NM simulations for July is the monthly average of the daily maximum, T imax , and for December is the monthly average of the daily minimum, T imin . Figure 4 presents T imax for July and T imin for December, derived from M and NM simulations. It can be observed that the NM simulation overestimates T imax . For the study cases this overestimation is between 5.6°C to 8.3°C and for the reference case (EPS) the overestimation is the lowest, 0.7°C. The NM simulation underestimates T imin . This underestimation of T imin is between 4.7°C and 6.4°C for the study cases. And for the reference case (EPS) the underestimation is 0.6°C. The overestimation of T imax and underestimation of T imin of the NM simulation implies that this simulation overestimates the T i oscillation amplitude, which is in accordance with the results found in Huelsz et al. (2014). It is important to remember that for the nAC house inaccurate predictions for T imax and T imin derived from the NM simulations can produce wrong estimations for the occupants’ thermal comfort.
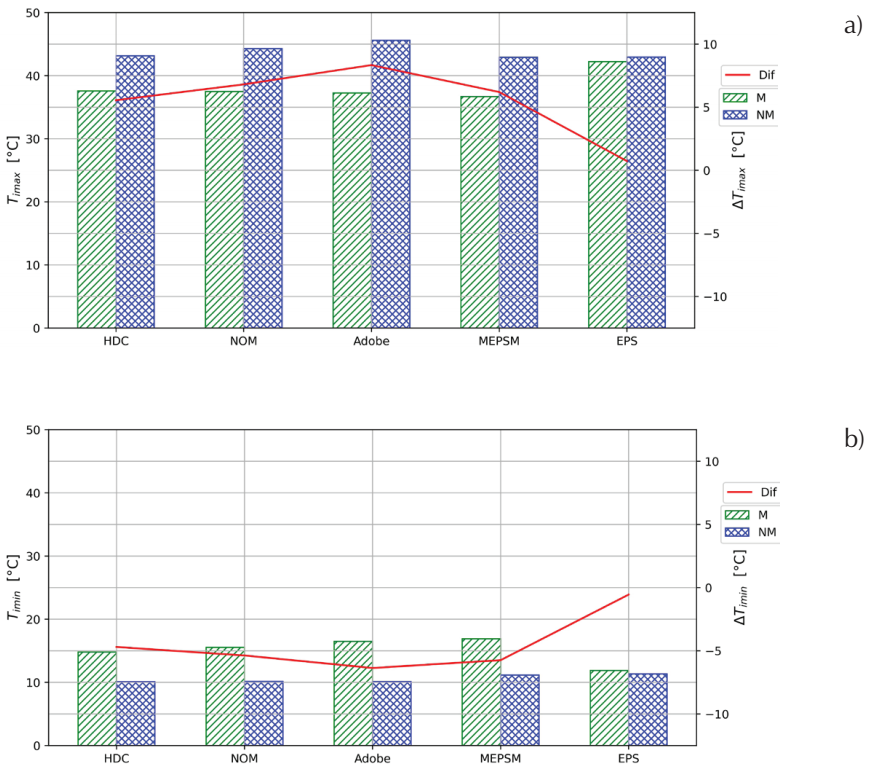
Figure 4 Indoor air temperature daily maximum monthly average, T imax , from simulations considering the thermal mass, M, and not considering the thermal mass, NM, a) for July and b) for December. In both months the difference of the corresponding parameter given by the NM simulation with respect to that of the M simulation, ∆T, is plotted using the secondary axis
Other parameters used here to compare M and NM simulations for the nAC house are the hot discomfort degree hours, DDH h , for July and the cold discomfort degree hours, DDH c , for December (Barrios et al., 2012).
The values for these parameters are shown in Figure 5. The difference of the corresponding parameter given by the NM simulation with respect to that of the M simulation for each case is also shown using the secondary axis. It can be observed that the NM simulation overestimates DDH h and DDH c . For the four study cases this overestimation is between 43 % to 124 %. For the reference case (EPS) the overestimation is lower than 8 %. The overestimation of the corresponding discomfort parameter is larger in December than it is in July.
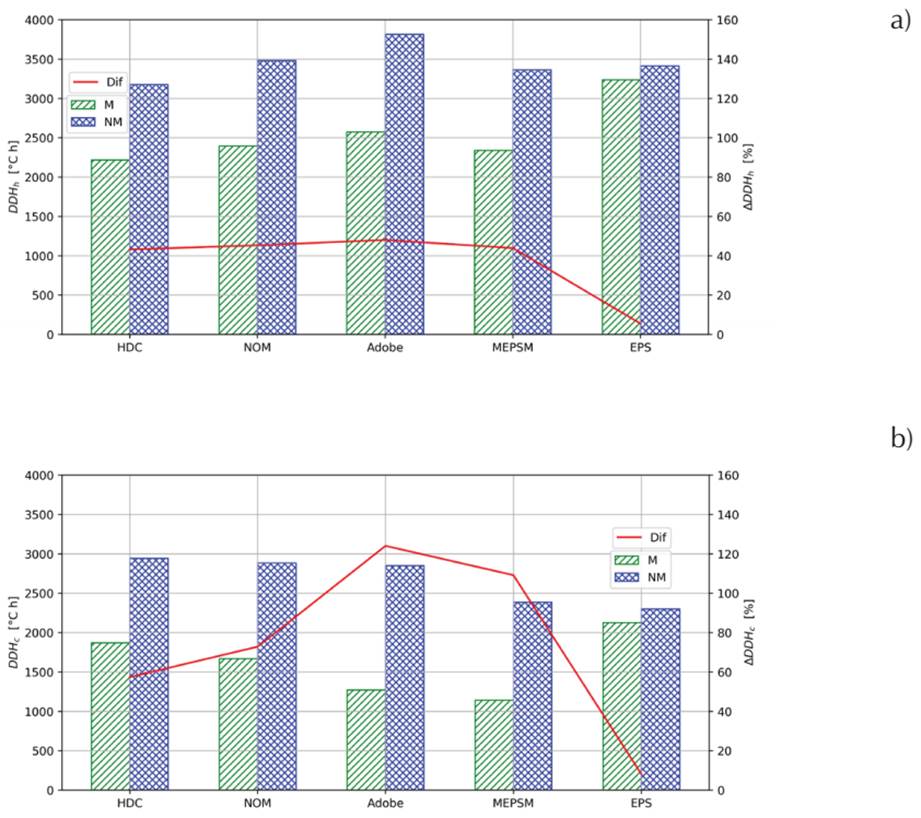
Figure 5 a) Hot discomfort degree hours, DDH h , for July and b) cold discomfort degree hours, DDHc, for December, from the simulation considering the thermal mass, M, and the simulation not considering the thermal mass, NM. The percentage difference of the corresponding parameter given by the NM simulation with respect to that of the M simulation, ∆DDH, is plotted using the secondary axis
Figure 6 shows DDH h for July and DDH c for December as a function of the thermal resistance, R, derived from M and NM simulations. It can be observed that for the nAC house the increase in the thermal resistance of the envelope constructive systems does not assure the improvement of the house’s thermal performance.
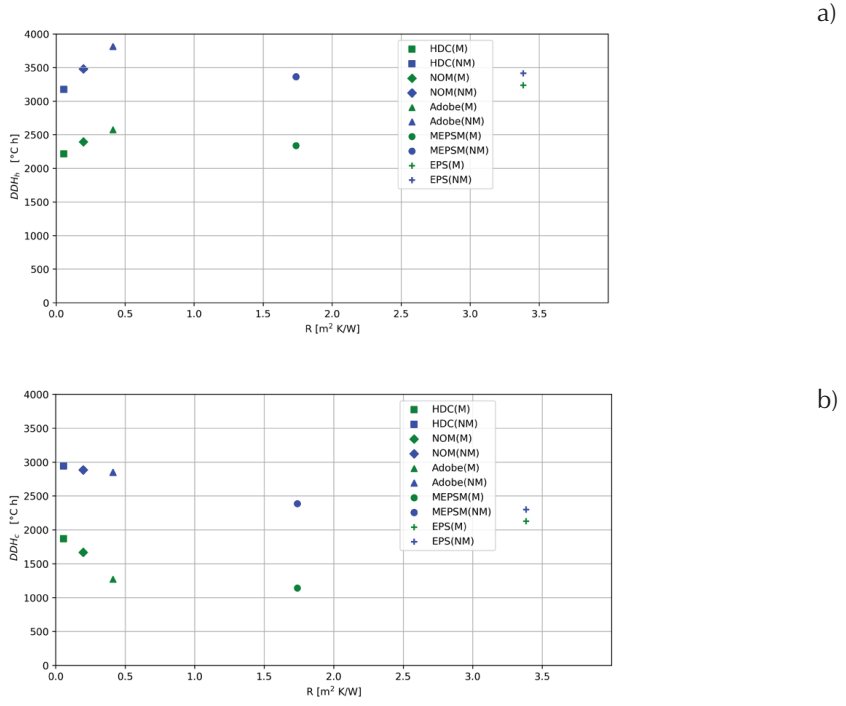
Figure 6 a) Hot discomfort degree hours, DDH h , for July and b) cold discomfort degree hours, DDHc, for December, both as a function of the thermal resistance, R, derived from the simulations considering the thermal mass, M, and not considering thermal mass, NM
The difference of the NM simulation with respect to the M simulation of DDH h , ∆DDH h , for July and of DDH c , ∆DDH c , for December is plotted as a function of C in Figure 7. It can be observed that in general the corresponding ∆DDH increases as C increases. In this figure a line is added connecting points corresponding to mono layered constructive systems in walls (EPS, HDC and Adobe) so as to aid in the observation of the fact that for these cases ∆DDH increases as C increases. This also helps in the observation of cases with multilayered constructive systems (NOM and MEPSM) for which the values of ∆DDH are larger than the ones that would correspond to their value of C if they had the same trend as that of the mono layered constructive systems. This difference is larger in the MEPSM case which has contrasting thermal behavior layers. The above mentioned thermal effect of multilayered systems when the thermal mass is taken into account has been reported (Huelsz et al., 2014; Ozel & Pihtili, 2007) this effect is not predicted when the thermal mass is not taken into account.
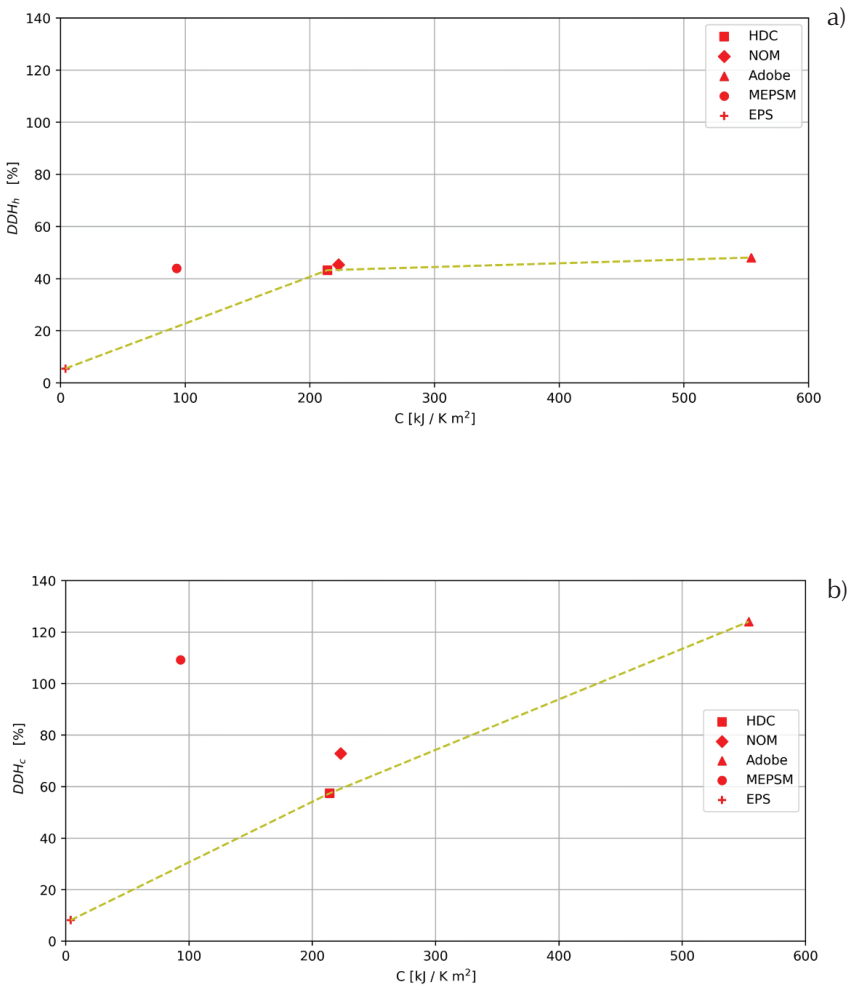
Figure 7 Difference of discomfort degree hours between simulations considering the thermal mass, M, and those not considering the thermal mass, NM. a) ∆DDH h for July and b) ∆DDHc for December, both as a function of the thermal mass, C. A line connecting points corresponding to mono layered constructive systems is added
For the nAC house the thermal performance order, from best to worst, predicted by the M simulations and given by the parameters T imax , T min and DDH c , is: MEPSM, Adobe, NOM, HDC and EPS. The parameter DDH h also signals that the reference case (EPS) has the worst performance. The value of this parameter is similar for the study cases, although the order of their performance is different from that given by the other parameters. The difference of T imax between MEPSM and EPS is 5.5°C, and the difference of T imin is 5.0°C, while the maximum difference between the study cases is up to 2.1°C for MEPSM and HDC for December. The maximum difference among the study cases for DDH h is shown by the Adobe and the HDC cases. The value for Adobe is 1.2 times that of HDC, while the maximum difference in DDH c is shown by the HDC and the MEPSM cases. The value for the HDC case is 1.6 times that of the MEPSM case.
Air-conditioned house
Simulations for the air-conditioned (AC) house are performed considering an ideal system with a set point of 25°C, which is turned on only during occupation. In July, the AC provides cooling and in December it provides heating. The schedule of internal heat loads is presented in Table 1.
Figure 8 shows the cooling thermal load, Q c , as a function of time, t, during 3 days in July and Figure 9 shows the heating thermal load, Q h , as a function of time t, during 3 days in December. For both months, the first day shown in the figure is a weekday, the house is not occupied, and the AC is turned off from 10:00 to 17:00. At the moment when the occupants arrive and turn on the AC, there is a peak in the cooling and heating loads that quickly decreases. The last two days are weekend days. The house is occupied and the AC is turned on all time. The sudden changes in the loads during these days, more evident in July, are due to the schedule of the internal heat loads. For the two weekend days in July, it is observed that the NM simulation overestimates the peak power demand and predicts that it occurs earlier than the M simulation prediction. This is excluding the reference case (EPS) where the M and NM simulations give similar results. For the two weekend days in December, it is also observed that the NM simulation overestimates the peak power demand and predicts it to occur earlier than the prediction of the M simulation. This is excepting for the reference case (EPS) where the M and NM simulations give similar results.
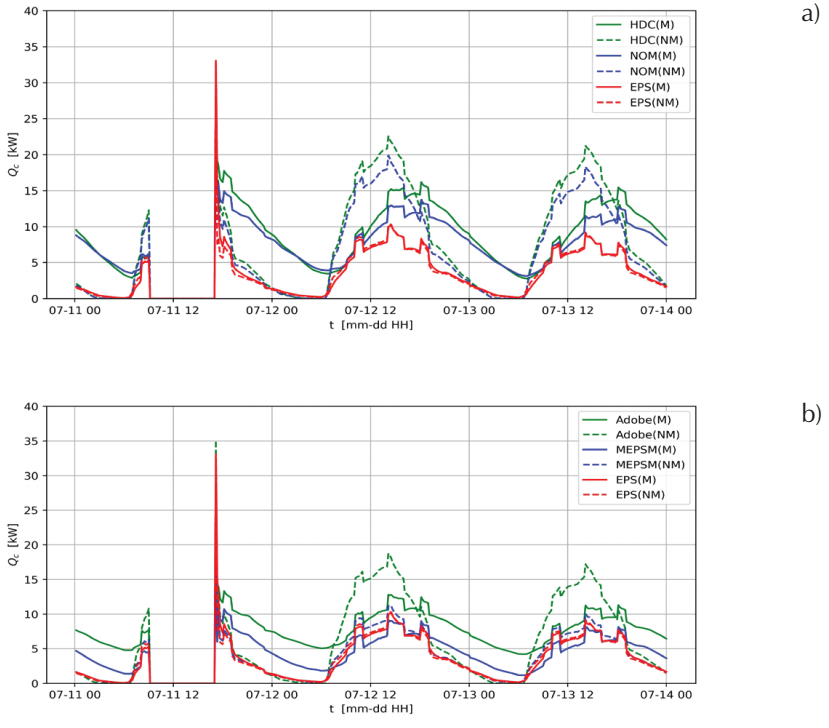
Figure 8 Cooling thermal load, Q c , as a function of time, t, during 3 days in July considering the thermal mass, M, and not considering the thermal mass, NM. a) HDC and NOM cases and b) Adobe and MEPSM cases. Results for the EPS case are included as a reference
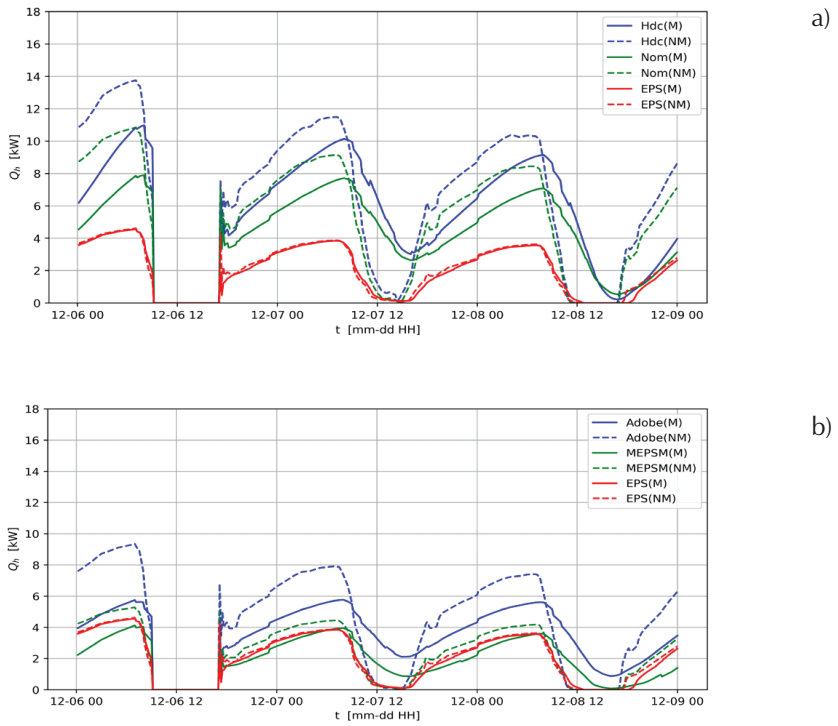
Figure 9 Heating thermal load, Q h , as a function of time, t, during 3 days in December considering the thermal mass, M, and not considering the thermal mass, NM. a) HDC and NOM cases and b) Adobe and MEPSM cases. Results of EPS case are included as a reference
Because the AC system is continually used only during weekend days, the averages for peak power and the time peak power occurs are taken only during weekend days. These averages, Q p and t p , are presented in Table 6 for July and December. This table also includes the difference between the NM simulations and the M simulations for the corresponding average, ∆Q p and ∆t p . It can be observed that not considering the thermal mass for the four study cases gives ∆Q p between 19 % and 38 % and ∆t p from over 1 hour to almost 4 hours. These values are negligible for the reference case (EPS).
Table 6 Weekend days average for peak power demand, Qp, and the time it occurs, tp, for July and December. Values for simulations considering the thermal mass (M) and disregarding it (NM); and the difference of these quantities between the NM and the M simulations, ∆Qp and ∆tp
| M simulation | NM simulation | M-NM differences | |||||
|---|---|---|---|---|---|---|---|
| Month | Case | Qp [kW] | tp [hh:mm] | Qp [kW] | tp [hh:mm] | ∆Qp[%] | ∆tp[h:mm] |
| Jul | HDC | 14.05 | 17:45 | 18.68 | 13:54 | 33 | 3:51 |
| NOM | 12.03 | 17:10 | 16.49 | 13:56 | 37 | 3:13 | |
| Adobe | 11.31 | 15:12 | 15.60 | 13:55 | 38 | 1:17 | |
| MEPSM | 8.38 | 16:12 | 10.01 | 13:56 | 19 | 2:16 | |
| EPS | 9.17 | 13:45 | 9.31 | 13:54 | 2 | 0:08 | |
| Dec | HDC | 9.26 | 09:21 | 11.00 | 07:09 | 19 | 2:12 |
| NOM | 7.07 | 09:23 | 8.81 | 07:23 | 25 | 2:00 | |
| Adobe | 5.69 | 08:41 | 7.65 | 07:27 | 34 | 1:14 | |
| MEPSM | 3.62 | 08:43 | 4.34 | 07:26 | 20 | 1:17 | |
| EPS | 3.74 | 07:30 | 3.78 | 07:26 | 1 | 0:04 | |
Results of the cooling thermal load, Q c , in July and the heating thermal load, Q h , in December, for M and NM simulations are presented in Figure 10. The difference of the corresponding parameter given by the NM simulation with respect to that of the M simulation for each case is shown using the secondary axis. It can be observed that for all cases, the NM simulation underestimates Q c and overestimates Q h . These results are similar to the findings in the study reported in (Ferrari & Zanotto, 2016) where the comparison is made between a quasi-steady state method using a correction factor to account for the thermal mass, and simulations considering the thermal mass. The underestimation of the NM simulation of Q c in July for the study cases is between 23 % and 30 %. For the reference case (EPS), the underestimation is 5 %. In December, the overestimation of the NM simulation of Q h for the four study cases is between 19 % and 27 %. The overestimation for the reference case (EPS) is 2 %.
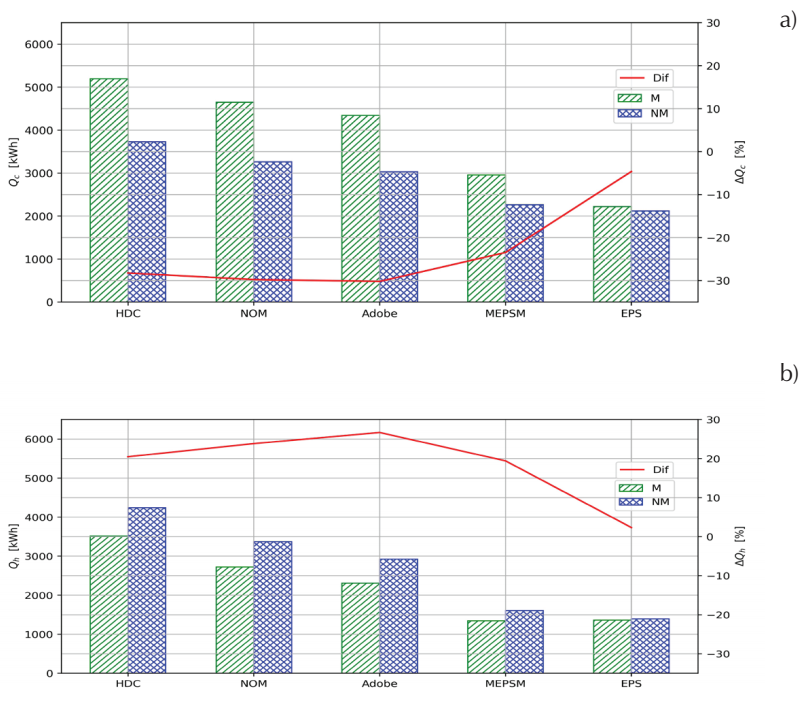
Figure 10 For the AC house: a) Cooling thermal load, Qc, in July and b) heating thermal load, Q h , in December, from the simulations considering the thermal mass, M, and those not considering the thermal mass, NM. The difference of the corresponding parameter given by the NM simulation with respect to that of the M simulation, ∆Q, is plotted using the secondary axis
Figure 11 shows the cooling thermal load, Q c , in July and the heating thermal load, Q h , in December from the M and NM simulations, both as a function of the thermal resistance of the case, R. It can be seen that R has an important impact on the behavior of the AC house. The larger the value of R is, the lower the values of Q c and Q h are.
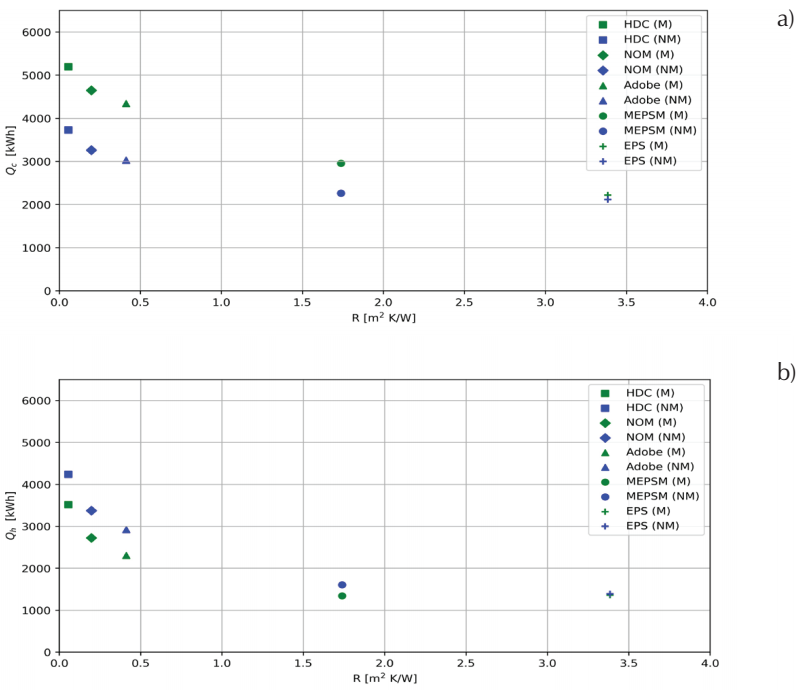
Figure 11 For the AC house: a) Cooling thermal load, Qc, in July and b) heating thermal load, Q h , in December, both as a function of the thermal resistance, R, from the simulations considering the thermal mass, M, and not considering the thermal mass, NM
The difference of the NM simulations with respect to the M simulations of Q c , ∆Q c , in July and of Q h , ∆Q h , in December is plotted as a function of C in Figure 12. It can be observed that the corresponding ∆Q generally increases as C increases. In the figure a line connecting points corresponding to mono layered constructive systems in walls (EPS, HDC and Adobe cases) is added to aid in the observation that for all of these cases the corresponding ∆Q increases as C increases, and that the NOM and MEPSM cases have larger values of ∆Q than those that would correspond to their value of C. This can be due to the fact that these cases have multilayered constructive systems. This is the same behavior found in the nAC house for ∆DDH h and ∆DDH c (Figure 7). When comparing Figure 12 to Figure 7, it can be observed that the multilayered effect in the AC house is less important than that for the nAC house, in accordance to Huelsz et al. (2014).
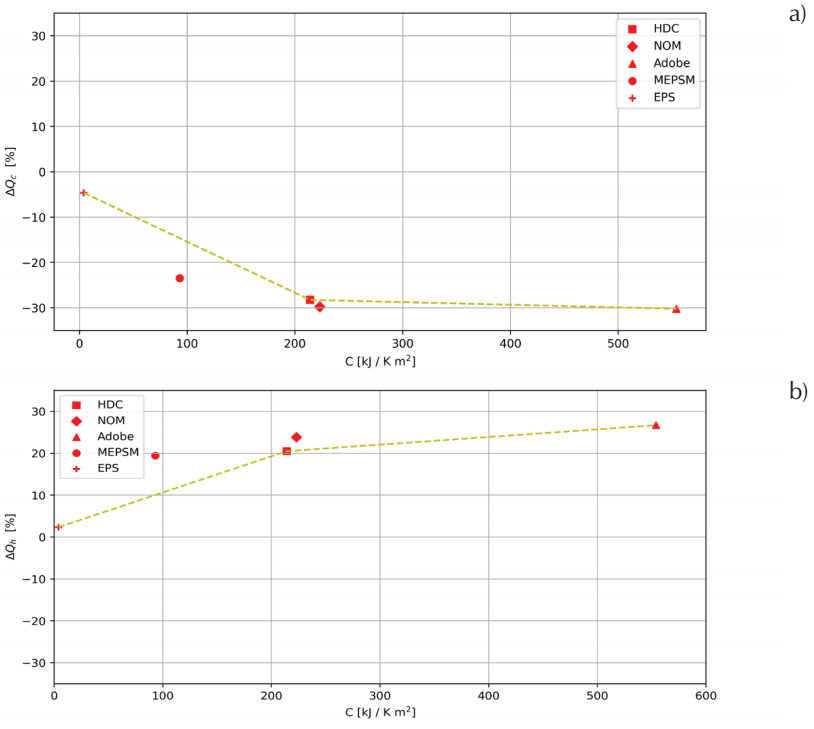
Figure 12 a) Cooling thermal load difference between the simulations considering the thermal mass, M, and those not considering the thermal mass, NM, ∆Qc, in July and b) heating thermal load difference between the M and NM simulations, ∆Q h , in December, both as a function of the thermal mass, C. A line connecting points corresponding to mono layered constructive systems is added
For the AC house, the thermal performance order for all cases, from best to worst, obtained from the M simulations is EPS, MEPSM, Adobe, NOM and HDC. The maximum difference in thermal performance, among the four study cases, is obtained with the parameter Q h in December for the HDC case, which is 2.6 times that of the MEPSM case (Figure 10b).
It is important to note that the order of cases according to their thermal performance from best to worst obtained for the AC house is not the same as that obtained for the nAC house. The latter is in agreement with that reported in Barrios et al. (2011).
Conclusions
The comparison between the thermal performance of a non-air- conditioned house predicted by simulations considering the thermal mass (M) of the building components and those not considering the thermal mass (NM) is reported. The simulations are carried out using EnergyPlus. The comparison between M and NM simulations of the air-conditioned house is also reported. The house is the one used for the development of the official Mexican standard NOM-020-ENER-2011 (Secretaría de Energía (SENER), 2011). The house is considered to be in Monterrey, NL, a Mexican city with a hot summer and a mild winter. Five cases with different constructive systems for walls and roofs are considered. The comparison is made for the hottest and the coldest months of the year, July and December, respectively.
Among the five cases analyzed, three are built with commonly used Mexican constructive systems. The walls and roofs of the first case (HDC) are made of high-density concrete. The walls of the second case (NOM) are made of clay brick and its roofs are built with high density concrete. The walls of the third case (Adobe) are made of adobe and its roofs are built with high density concrete. The walls and roofs of the fourth case (MEPSM) are built with a new constructive system used in Mexico composed of a layer of high density expanded polystyrene coated on both sides with a layer of cement mortar. The fifth case is a reference case (EPS), and its walls and roofs are built with a single layer of a high density expanded polystyrene.
For the non-air-conditioned house, it is found that the NM simulation overestimates the monthly average of indoor air temperature daily maximum, T imax , and underestimates the monthly average of indoor air temperature daily minimum, T imin . This overestimation of T imax is up to 8.3°C and the underestimation of T imin is up to 6.4°C. The overestimation of T imax and underestimation of T imin in the NM simulation implies that the NM simulation overestimates the oscillation amplitude of T i which is in accordance with the finding of Huelsz et al. (2014). It is also found that the NM simulation overestimates the hot discomfort degree hours, DDH h , and the cold discomfort degree hours, DDH c . This overestimation is up to 124 %.
For the air-conditioned house, it is found that the NM simulation underestimates the cooling thermal load, Q c , and overestimates the heating thermal load, Q h . The underestimation of Q c is up to 30 % and the overestimation of Q h is up to 27 %. The underestimation of Q c and overestimation of Q h of the NM simulation with respect to the M simulation found here is similar to the findings of the study reported in Ferrari & Zanotto (2016). The difference in the peak power demand given by the NM simulation with respect to that given by the M simulation is up to 38 %, and the difference in the time it occurs is up to almost 4 hours.
Additionally, it is found that the increase in the thermal resistance, R, of the constructive system does not assure the improvement of the non- air-conditioned house’s thermal performance, as it does when the house is air-conditioned. The difference between the M and NM simulations results for the house, whether it is conditioned or not, generally increases as the thermal mass, C, increases. This difference also increases for the cases with constructive systems that are multilayered, especially if the layers have contrasting thermal behavior.
Although the comparison between the M and NM simulations, implicitly the comparison between the time-dependent and the time- independent models of the heat transferred through the building components, in the present study is performed using other parameters for the non-air-conditioned house than those reported in Huelsz et al. (2014), in both studies the differences between the M and NM simulations are significant for the constructive systems analyzed. Except, as expected, for the EPS case because this case has a constructive system with low thermal mass. Also, in accordance with Huelsz et al. (2014) the differences between the M and NM simulations are larger for the non-air-conditioned house than they are for the air-conditioned one.
The results of this work demonstrate the importance of considering the thermal mass of the building components in whole-building simulations of a non-air-conditioned building. The authors consider that these results may contribute to convince building thermal simulation programs users and building standards and ratings developers to take into account the thermal mass of the building components for their calculations, especially for non-air-conditioned buildings.


 nueva página del texto (beta)


