


 nueva página del texto (beta)
 Inglés (pdf)
 Artículo en XML
 Referencias del artículo
 Enviar artículo por email
 Citado por SciELO
  Similares en
SciELO
Similares en
SciELO 
 Permalink
Introduction
Understanding the incentives that have driven the development of solid waste management in the past, such as environmental protection or public health policies, is critical to advancing system development and sustainable management methods around the world (Wilson, 2007).
The history of recycling begins with social and environmental historians. Although the term was coined in the 1920s, it was not until the 1970s that it was used for the environmental reprocessing of waste materials. The historical investigation reveals the transformation of garbage into raw materials and its reuse and adaption, as well as maintenance, repair, and restoration efforts (Werret, 2013).
Law No. 12.305/10 (DOU, 2010a) establishes the National Solid Trash Policy (PNRS) in Brazil, encouraging care and waste reduction. It also identifies producers’ shared responsibility, eliminates dumps, and provides planning procedures at the national, state, and municipal levels. Brazil is on par with the other developed countries in terms of legal structure. However, most towns lack the technical and financial means to address solid waste management issues, making the current situation unfavorable (MMA, 2012).
As a whole, as the world’s population grows, the need for food and shelter is expected to rise as well. As a result, industries, communities, and public agents are under much pressure to reduce damages.
In Brazil, Urban Solid Waste (USW) production reached 78.4 million tons in 2017; the total collected was 71.6 million tons with 6.9 million without proper destination, totaling a coverage of 91.2% for the country. From all the USW collected in 2017, 42.3 million tons, or 59.1%, were andfilled -a 3% growth in comparison with 2016. However, the remaining 40.9%, around 29 million tons, were disposed of in inappropriate places such as dumps or landfills that do not have an environmental protection system, constituting a public health problem (ABRELPE, 2017).
For comparison purposes, Japan and South Korea generate roughly 0.4 tons of USW per capita, while the Philippines and India generate slightly more than 0.1 tons per capita each year (Lacoste and Chalmin, 2007; Singh et al., 2011). At the same time, developing countries in Europe produce about 1.43 billion tons of wastes per year (Singh et al., 2011).
With this in mind, the objective of this study is to identify the efficiency level of urban solid waste management in the Brazilian capitals during the period from 2002 to 2016. Therefore, the DEA (Data Envelopment Analysis) methodology was utilized to assess efficiency, and the Logistic Regression methodology was employed to quantify each variable’s impact.
This research is justified by the importance of the theme related to a problem that reaches a large part of society. It reveals that the output of urban solid waste is increasing faster than population growth and that the quantity of materials recovered is meager compared to the number of materials collected. Last year, the urban cleaning market processed resources corresponding to R$28.5 billion in the country, with positive variation in all regions (ABRELPE, 2017). Two main contributions of this research are listed. The first is to present the efficiency of the 20 sample capitals. The second refers to logistic regression showing the cities with a prominent character (as indicated by the variables considered) and can be used as management parameters for other locations.
This research is divided into four sections; the theoretical reference covers topics such as “The National Policy on Urban Solid Waste,” “Management of Solid Waste and Urban Solid Waste in Brazil,” apart from a “Systematic Literature Review on the Management of Solid Urban Waste in Brazil.” The data collection, sample, and analyzed variables are all presented in the methodology. The results are then given, followed by the conclusions.
1. Theoretical-empirical review
1.1. The National Policy on Urban Solid Waste and Management of Solid Waste and Urban Solid Waste in Brazil
In Brazil, the collection of household and urban public waste is the responsibility of the municipal government. In the National Urban Solid Waste Policy (PNRS), selective collection is defined as the collection of solid waste previously disposed of according to its constitution or composition. It includes the selective collection service of recyclable materials such as paper, glass, plastics, metals, and other materials (Besen, 2012). The PNRS was established by Law No. 12.305 of August 2, 2010 (DOU, 2010a), which was regulated by Decree No. 7.404/2010 (DOU, 2010b), which established principles, objectives, and instruments, as well as guidelines for the management of solid waste, including hazardous waste, as well as the responsibilities of generators and public authorities (MMA, 2012). The following are its guiding principles: 1. no waste creation; 2. reduction; 3. reuse; and 4. recycling. Environmental, social, cultural, economic, technical, and public health elements and the pursuit of sustainable development and ecoefficiency are all factors to examine under the legislation (Souza and Orsini, 2013).
The PNRS Law’s primary concern is sharing responsibility, which recognizes that everyone is liable for waste, planning, and management actions that concretely define their responsibilities. According to Article 25 of the PNRS, “the success of efforts aimed at guaranteeing compliance with the PNRS, and the guidelines and other determinations made by law and regulation is the responsibility of public authorities, the business sector, and the community” (Ribeiro, 2012: 557; MMA, 2012).
The approval of the National Solid Waste Policy (PNRS) and its regulation gave rise to a new benchmark for integrated and sustainable solid waste management in the country and new challenges for implementing and improving the selective collection service provider in the country. Although without many expressions, progress is being made on a still precarious model of formal selective assortment to provide universal service, with quality and social inclusion, primarily through hiring waste pickers’ organizations, associations, and cooperatives for implementation (Besen, 2012).
Regular collection of solid waste has been the focus of solid waste management in recent years. Although coverage of urban solid waste collection services has improved in all areas, reaching more than 91 percent of households, over 19,000 tons of USW per day are placed in inappropriate places. Despite accounting for 25% of solid waste created, the Northeast of Brazil has the lowest USW collection assortment rate, being the only one below 80% (ABRELPE, 2017).
Integrated solid waste management is to provide guidelines for discipline management actions, taking into account all relevant factors (environmental, cultural, economic, public health, political, social, technical, and urban, to name a few), to ensure that the measures taken are long-term. As a result, management might be viewed as a set of tasks to be completed. This integrated management consists of several actors in order to establish and improve waste management, encompassing all parties involved in the process and enabling a uniform and harmonious development among all stakeholders, in order to achieve the proposed objectives, which are tailored to each community’s needs and characteristics (Lopes, 2007; Pavan, 2010). However, according to ABRELPE (2017), the perception remains that the National Solid Waste Policy, which completed eight years on August 2, 2018, still lacks practical application and effectiveness in all country regions. Furthermore, the lack of resources to fund the planned changes has kept a considerable and growing deficit on the costliest points of the law: maximizing the use and recovery of waste materials and eradicating practices inadequate destination, still present in all units of the federation and with negative health impacts of millions of Brazilians.
Brazilian consumption of such material has been increasing exponentially during recent decades, which has led to the production of solid waste, commonly called garbage, both in urban and rural areas. The widespread consumption of materials resulting from human activities is viewed as a global issue, particularly proper disposal. When improperly disposed of in dumps, landfills, rivers, etc., these substances often contaminate the soil and surface or groundwater (MMA, 2012). Therefore, the National Policy on Solid Waste (PNRS), established by Law No. 12.305/10 (DOU, 2010a), has steadily replaced the notion of waste as ostensibly useless items in the country, as can be seen in its content and in the own definition given to waste.
According to Andrade and Ferreira (2011), Brazil has been trying to adopt urban waste management techniques similar to developed countries, although socioeconomic and educational situations are different. Germany, for example, virtually extinguished landfills in significant cities. At the same time, the country invests heavily in educating its citizens about the importance of recycling and “minimization,” controlling the use of packaging (Brollo e Silva, 2001).
In general, developed countries aim to find various waste treatment alternatives before they reach landfills. Composting, recycling, and incineration are just a few examples of what municipalities have been using to mitigate the negative impacts of urban solid waste (Andrade and Ferreira, 2011; Besen, 2012). However, according to the authors, in Brazil, the selective collection of USW primarily affects the most prestigious neighborhoods of large cities and the lack of technical training.
Both in terms of public policy and USW management, developed and developing countries have somewhat similar orientations. However, cultural and social aspects distinguish the distinction, creating a different end product (Dubois et al., 2017).
In Brazil, urban solid waste management is accompanied by joint actions between the public, private organizations, and community sectors, targeting sustainability so that there is a rational practice of non-renewable natural resources and that the environment is preserved from the random disposal of high potential (dangerous) waste (Pinto, 1999; Lima, 2012).
According to Andrade and Ferreira (2011), expanding home collection and effective waste disposal are obstacles that must be addressed; therefore, municipal resources must be appropriately handled. Because of the subject’s importance, more papers addressing challenges connected to sustainability, including urban solid waste management, are published each year. Between 1995 and 2005, 88 articles appear in the research of CAPES journals on the subject of “Urban Solid Waste.” From 2006 to 2016, this number increased to 1253, demonstrating the general public’s interest in the issue. The following are some recent papers from the CAPES journal:
Chart 1 Most Published Topics in the CAPES Periodical on the Topic “Urban Solid Waste”
| Subject | Author |
| Environmental Education | Martins et al. (2020) Santos et al. (2018); |
| Urban Solid Waste Management |
Da Silva (2014);
Deus et
al. (2015); Dos Santos et al. (2016); Paschoalin et al. (2020). |
| Sustainability Indicators | Vieira et al. (2016) |
Source: own elaboraration based on research done on CAPES Periodical Website (2019).
It is noticeable that the increase of works that explore environmental education in the last decade has substantially increased. (Martins et al., 2020) . Environmental education and awareness are critical factors in this entire waste management process, whether urban or rural. However, the responsibility must rest with the whole society, and no exceptions can be allowed, even those with difficulties in accessing the media. Therefore, it is imperative to find alternatives for access to information.
1.2. Systematic Literature Review on the Urban Solid Waste Management in Brazil
To supplement this theoretical reference, a systematic literature review technique was accomplished. For a systematic review of the literature, many criteria were used to ensure that this study could be replicated. The question that guided this research was: What are the significant studies that address the National Solid Waste Policy (PNSW) and Urban Solid Waste (USW) in the national context? Therefore, it is essential to investigate the flow of information between researchers. Data collection and analysis followed the steps:
The search engine expression was established. “National Solid Waste AND Urban Solid Waste Policy” were specified and investigated in the papers’ titles, abstracts, and keywords. The search method used was “AND,” which looked for the two phrases together at all moments.
The search began in two databases: CAPES Periodicals and Scientific Electronic Library Online (Scielo). They were chosen for the multidisciplinarity of their works and references and the fact that they are both national, given that this project focuses on Brazilian capitals. These were the filters used: (1) every year. The decision not to delimit a temporal series of publications in databases is justified by highlighting the most important articles that address the issue under investigation. Scientific papers were the second type of documents, and (3) In the SCImago and Qualis CAPES list, only journals rated as A1, A2, and B1 were included. The criteria mentioned above were applied to all databases that were utilized.
Finally, the data were analyzed, and the most important contributions were identified. As a result, 33 articles were indexed that provided adequate results for the filters employed. After that, duplicate entries were deleted, leaving 29 articles. After reading the abstracts, ten were chosen from the total number of results since they best fulfilled the requirements (19 articles did not meet the research objective).
The articles were grouped according to the focus with which they addressed the themes of “National Solid Waste Policy” and “Urban Solid Waste.” To establish the categories of analysis, the theme lines were determined by analyzing the information grouped in each article and using the criterion of shared thematic resemblance by area. The thematics were: recyclable material collectors (two articles), selective collection and recycling (one article), inter-municipal consortium (two articles), municipal solid waste management (two articles), dumps and landfills (two articles), and urban solid waste treatment (one article).
Recyclable Material Collectors. The articles in this category were primarily concerned with the social inclusion of recyclable material collectors in the process of selective collection and recycling. Besen et al. (2014) conducted a study with 39 municipalities in the São Paulo metropolitan region, with the goal of better understanding the collection situation and analyzing the Nation’s potential implications. According to the report, the percentage of municipalities in the metropolitan region of São Paulo that have selective collection has increased from 59% in 2004 to 77% in 2013. According to data from 2010, which predates the PNRS, 29 municipalities (74.4%) used selective collection, with 28 (96.5%) working in collaboration with waste picker organizations. There was no substantial difference (2.5%) in the number of municipalities that used selective collection after the PNRS was established. Furthermore, there was no difference among those who did it in collaboration with garbage picker organizations. The number of organizations increased by 25.6% between 2004 and 2013.
-
The number of garbage picker groups in the metropolitan zone of São Paulo increased very slowly between 2010 and 2013 (2.1%). Between 2004 and 2013, the number of members of the groups increased by 43.6%. However, the growth was bigger (66.8%) from 2004 and 2010, with a considerable decrease between 2010 and 2013 (-13.9%). The writers concluded that the PNRS’ approval had minimal influence on the service’s universalization. It is necessary to create public policies to integrate organized collectors in the formal selective collection.
Gouveia’s research aimed to contribute to the discussion on the effects of effective solid waste management on the environment and solutions to address this issue while promoting social inclusion. According to the author, ensuring both the issues of the right to work and income and assessing the health conditions and risks to which they are exposed is essential for an acceptable integration of recyclable material collectors in the solid waste management system. As a result, in light of the PNRS’ impending institutionalization, and in order to avoid repeating the perverse effect of exclusion and exploitation of this group of workers, it is critical to developing public policies that integrate social (health, work safety, self-management, citizenship, and inclusion, among other things), economic (income generation, cost reduction, and market, among other things), and technological (income generation, cost reduction, and market, among other things) aspects.
Selective Collection and Recycling. Brito de Oliveira and Galvão Junior’s (2016) research objective was to evaluate the Municipal Integrated Solid Waste Management Plan (MGIRS) from the perspective of selective collection and recycling, referring to 17 Brazilian municipalities with populations of over 200 thousand people. The sample municipalities are spread throughout three regions: Southeast (12), Northeast (2) and South (3). The findings suggest that the primary inadequacies discovered during the diagnostic stage were linked to waste treatment information and recyclable material collectors’ engagement in the selective collection. Most of the analyses of goals, programs, and actions received less than 50% of the attention they deserved. The methodology for estimating the expenses of delivering urban public cleaning and solid waste management services and the way these services are priced were found to be the most serious flaws. The monitoring system was the least satisfied with the three examination areas; most towns did not set objectives for reduction, reuse, selective collection, and recycling, among other things with minimal content, based on the PNRS’ minimum content requirements. The author stated that most towns did not satisfy the PNRS’ minimal standards in selective collection and recycling.
-
Intermunicipal consortium. The articles in this category describe how inter-municipal consortia may help with USW management. In light of the PNRS standards, Heber and Da Silva (2014) conducted a study to assess the progression of institutionalization of shared solid waste management in the Metropolitan Region of Aracaju (MRA). Several constraints were identified during the PNRS’ institutionalization and the drafting of local or inter-municipal solid waste management plans, including: the managers’ level of legislative expertise, the requirement for active engagement by federated entities, and the technical and political debates sparked by the new law. One of the significant roadblocks has been recognized as the fact that local (public) managers change every four years, interfering with operations in Brazil. Furthermore, many individuals are unconcerned about where their garbage is disposed of.
According to Chaves et al. (2014), one of the significant challenges in implementing the PNRS at the local level is the lack of capability of teams to support local governments, limited administrative capacity, and the employment of consulting firms that are unfamiliar with local realities. The authors argue that investing in solutions that reduce waste generation is required to reduce the quantity of trash created.
-
Urban Solid Waste Management. The articles that make up this category address urban solid waste management in Brazilian municipalities. Urban (2016) provided a technique for regional analysis of urban solid waste based on an index that can be used as a planning tool and is based on the PNRS management and management recommendations. The cities in the sample are from the state of São Paulo in Brazil. The research collected data from almost 77% of the total number of municipalities in São Paulo. Based on the allocation of weights to variables such as population, creation of urban solid trash, selective collection of health service waste, and involvement in inter-municipal waste management, an index of municipal solid waste management adequacy was created; the cities in the sample are from the state of São Paulo in Brazil. The research collected data from almost 77% of the total number of municipalities in São Paulo. Based on the allocation of weights to variables such as population, creation of urban solid trash, selective collection of health service waste, and involvement in inter-municipal waste management, an index of municipal solid waste management adequacy was created.
Previous solid waste research was evaluated and systematized Deus et al., (2015). There was an upsurge in articles on solid waste indexed in the Scopus database from 1993 to 2013, mainly by China. Waste Management had the most articles published. Environmental and Sanitary Engineering was the publication that published the most articles in Brazil from 1993 to 2013. Both nationally and globally, the most commonly used terms are related to the management of urban solid waste, such as municipal solid waste, recycling, and landfill.
-
Dumps and Landfills. The articles in this category look into dumps and landfills as a result of the PNRS implementation. Ferri, et al., (2015) presented a method based on a mathematical model for the location of USW storage and sorting facilities for municipalities, allowing garbage to be centralized in a reverse distribution center to group collected USW. The research was conducted using data from the municipality of São Mateus (Espírito Santo). The development of distribution centers was proposed in 12 scenarios, considering existing cooperatives and the exclusion of some areas due to their location. As a result, scenario number 12 was determined to be the most appropriate. However, it required establishing facilities in all existing cooperatives, resulting in a total operating cost of the examined reverse logistics network more significant than the other highlighted possibilities. However, the public administration should consider this conclusion since it suggests that all agents now active in USW collection in the city may be included, and it has a more negligible socioeconomic impact.
Waldman (2013) examined the National Solid Trash Policy to improve residential or household waste management (RDO). The author challenges Brazil’s present management models. The objective is to bury all of the waste created, but little effort is being made to reduce waste. The PNRS made dumping illegal; therefore, landfills grew in popularity. However, landfills harm the environment and people; thus, the problem remains unsolved.
Urban Solid Waste Treatment. The study by Mannarino et al. (2016) aimed to offer relevant data on the management of urban solid waste (USW) across Europe to create similarities and help the conversation in Brazil. In Switzerland, recyclable waste such as PET plastic, glass, paper, and metals, as well as fresh vegetables that may be composted or digested, are collected for free. Recyclable items are either disposed of in public bins or provided to business facilities. Other garbage that has to be collected must be placed in specialized plastic bags for which a price must be paid. In the same country, it is mandatory to incinerate all garbage that cannot be recycled, including organic trash that has undergone biological treatment.
As a result of this comprehensive literature study, it was possible to see how the subject has been studied in Brazilian cities.
2. Methodological Procedures
2.1. Data Collection and Samples
This is an empirical study with a quantitative approach and the use of secondary data. To evaluate the efficiency of Brazilian capitals, from 2002 to 2016, the Data Envelopment Analysis (DEA) was used. The DEA approach is used to assess the effectiveness of production units called Decision Making Units (DMUs) that perform similar activities. When DEA is used, it generates a score that ranges from 0 to 1. The closer the score is to 1, the more efficient the DMU is considered, and scores equal to 1 imply maximum efficiency. Each DMU is treated as a capital in the year in which it is used in this study. In addition, the Variable Returns to Scale (VRS) technique was used in this study, which assumes variable returns to scale by substituting the axiom of convexity for the axiom of proportionality. This element is appropriate, given that the returns to the relation of urban solid waste management are varied.
The sample was non-probabilistic due to the relevance of the cities. Data were collected on November 12, 2018. Although regarding the period selected for analysis, this is a cross-sectional period, as it was based on data available on the National Solid Waste Management Information website (SINIR), it is noteworthy that some cities did not have all the variables available in a given year, so we selected the cities and years that contained all the variables available for the study. The sample consisted of 20 Brazilian capitals. The analysis of the Brazilian capitals is appropriate since these municipalities are the main generators of solid waste in Brazil and are also crucial for the country’s economy. It is also worth noting that, to apply the DEA approach, all of the variables in the study must contain all of the data from the municipalities. Unfortunately, many public statistics in Brazil are out of date, and there is transparency. Therefore, some communities only have access to a few of the variables, making the analysis impractical.
After measuring the efficiency of Brazilian capitals, the logistic regression technique was used to measure the contribution of each variable used in the DEA technique.
2.2. Definition of Variables
In order to define the variables used in this study, we sought previous studies that evaluated the efficiency of USW management in various cities, states, and countries using the DEA technique. Therefore, the variables used in this study were the same as those used by other authors in previous empirical studies. As a result, all the variables employed in this study have been verified in earlier research. Chart 2 presents the variables used in the analysis, their categorization into inputs and products, as well as references in previous research.
Chart 2 Dimensions Applied in this Study
|
Input/ Output |
Data | Description | Authors |
| Input | Total Expenditure on Sweeping Service per capita (R$/Year). | Annual value of the result of the sum of the expenses incurred in the execution of the sweeping service of public roads and public places performed by the City and suppliers. | Cordeiro et al. (2012). Rogge and Jaeger (2012). Chang et al. (2013). Simões et al. (2012). |
| Input | Total Expenditure on USW Management Services (R$/ Year). | Annual value of the sum of expenditures on USW management services by private and public agents. | Cordeiro et al. (2012). Rogge and Jaeger (2012). Chang et al. (2013). Simões et al. (2012). |
| Input | Number of vehicles per capita (Unit/ Year). | Number of vehicles belonging to public and private agents that perform household solid waste collection and public cleaning waste. | Chang et al. (2013). Simões et al. (2012). |
| Input | Number of Workers per Capita (Units/ Year). | Total amount of public and private agent sweepers allocated to the sweeping service and total number of paid workers involved in USW management services. | Cordeiro et al. (2012) . Chang et al. (2013) . Simões et al. (2012). |
| Product | Quantity of Waste Collected by Selective Collection Agents per capita (Tons/Year). | Annual value of the result of the sum of the quantities of solid waste collected through the selective assortiment service by all públic agents, private, waste pickers associations and others at the end of the reference year. | Rogge and Jaeger (2012). Chang et al. (2013). Simões et al. (2012). |
| Product | Product Total Quantity of Recycled Material Recovered per capita. (Tons/Year). | Annual number of recyclable materials recovered (except orgànic matter and tailings) collected on a selective or non-selective basis, due to the action of the executin agents, i.e, the City, its servicers, collectors' associations and other agents, not including, however, quantities recovered by non-organized autonomous collectors or quantities recovered by private intermediaries ("scrapers"). | Cordeiro et al. (2012). Chang et al. (2013). Yeh et al. (2016). Simões et al. (2012). |
Source: own elaboration based on previous empirical studies (2019).
2.3. Applications of DEA and Logistic Regression Techniques
Data Envelopment Analysis (DEA) is used to evaluate the efficiency of Decision-Making Units (DMUs) that perform similar tasks. In this study, DMUs are the Brazilian capitals, and each capital in a different year is considered a new DMU, so this study had 202 DMUs. The application of the DEA produces an indicator ranging from 0 to 1, and the closer to 1, the more efficient the DMU is considered, and scores equal to 1 indicate maximum efficiency. In this study, all variables were normalized according to the technique proposed by Müller and Guido (2016); thus, all variables were normalized on a scale between 0 and 1; through data normalization, it is possible to measure the data better. The variables were normalized according to equation 1:
After applying the DEA technique, the logistic regression technique was applied to measure the contribution of each variable used in the DEA technique. At first, a histogram with the DEA results was plotted; based on the results, it was decided to consider all scores above 0.90 as 1 in the logistic regression, and all scores below 0.90 considered 0 in logistic regression. Of the 202 DMUs, 18.1% were within the range between 0.90 and 1. In a second moment, the hold-out methodology was used to separate the data in the training group (70%) and the group test (30%). Equation (2) is the linear combination of dependent variables multiplied by their respective parameter. Each parameter characterizes the importance of the respective variable for positive classification prediction, in this case, as efficient. The variables correspond to the variables presented in Table 1, regardless of whether they are isomers or products. There is also a parameter independent of the variables, known as intercept. The model must assign the weights (parameters) for the correct classification of capitals as efficient and inefficient. In principle, inputs are expected to have negative parameters and positive products. Equation (2)
Table 1 Average Efficiency of Brazilian Capitals from 2002 to 2016
| County | Avarage | County | Avarage | |
| Macapá | 0.720 | Manaus | 0.492 | |
| Porto Alegre | 0.712 | Natal | 0.459 | |
| Belém | 0.691 | São Luís | 0.442 | |
| Cuiabá | 0.650 | João Pessoa | 0.412 | |
| Florianópolis | 0.642 | Recife | 0.347 | |
| Fortaleza | 0.631 | Goiânia | 0.306 | |
| Brasília | 0.621 | Vitória | 0.270 | |
| Teresina | 0.600 | Belo Horizonte | 0.243 | |
| Curitiba | 0.582 | Rio de Janeiro | 0.197 | |
| Maceió | 0.501 | Salvador | 0.190 |
Source: own elaboration based on interpretation data (2019).
In this study, the logistic regression model was used to model the DEA (efficient/inefficient) result for each capital. The objective was to create an analytical model (Equation 1) of the computational procedure performed by the DEA that mathematically explains the relationship between the variables used and the efficiency score. After the creation of the model, it was possible to estimate the efficiency of other DMUs.
3. Data Description and Analysis
3.1. Application and Analysis of the DEA Technique
Figure 1 shows the boxplot of the variables used in this study. Through the boxplot, it is possible to visualize the distribution of the variables and the distribution of the samples that have divergent behavior of the population (outliers). The sample is composed of 202 data, corresponding to Brazilian capitals, during the 14 years of analysis for each boxplot. It is noteworthy that each variable in the boxplot was normalized by dividing the population of each municipality, i.e., the variables were standardized per capita. It is observed that the municipality that presented the lowest amount of expenses related to sweeping was Manaus in 2002, with R$0.378 per inhabitant. The municipality with the highest total expenses was Florianópolis, in 2010, with R$96.79 per inhabitant.

Source: own elaboration based on interpretation data in software SmartPLS GmbH (2019).
Figure 1 Boxplot of Variables
The municipality of Cuiabá, in 2006, presented the lowest amount of management expenses (R$16.30), and the municipality that presented the highest value with management expenses (R$387.99) was Florianópolis, in 2016. The variables number of workers, the amount of material recovered, and the amount of waste collected was divided per capita and then multiplied by 1000, and this technique was used for better analysis and comparison of data. Regarding the variable number of workers, it is clear that the municipality with the highest value is Goiânia, in 2012, with 3.6 workers.
Regarding the variable quantity of waste collected, it is observed that the median corresponds to 414.37 tons/year, which shows that most municipalities collect approximately 414.37 tons/year of materials. Note that the median of the variable quantity of materials recovered represents 2.84 tons/year, i.e., most municipalities recover approximately 2.84 tons/ year of materials. It is noticed that the number of materials recovered is deficient compared to the number of materials collected. However, the municipality that collected the most materials was Vitória in 2015, and the municipality that recovered the most waste was Florianópolis in 2013. Although the capital city Vitória, in 2015 collected the most significant number of materials, this municipality did not recover a significant amount of waste as it was ranked 76th in the ranking for materials recovery.
After the descriptive analysis of the variables, the DEA technique with variable return approach with input orientation was applied. This approach was chosen as it should prioritize the optimization of available resources. Graph 1 shows the municipalities and the years in which the most efficient municipalities were considered, with 1 being the maximum efficiency.
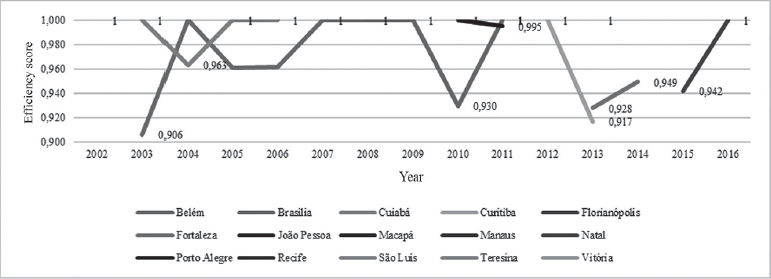
Source: own elaboration with data obtained on National Solid Waste Management Information website DOU (2010a).
Graph 1 Most Efficient Municipalities from 2002 to 2016
It should be noted that the municipality of Belém received the highest efficiency score the most times, followed by the municipalities of Brasilia, Cuiabá, and Florianópolis. The Northeast is the geographical region with the most efficient capitals, followed by the North and South. It is worth noting that the southern area is the only one where all capitals are considered efficient.
In 2008, Rogge and De Jaeger (2012) utilized the DEA approach to assess the cost-effectiveness of USW collection and processing in Belgium. Municipal public managers have the problem of managing and implementing budget limitations and restricted resources as effectively as possible without raising taxes and serving most of the people. As a result, the majority of Flemish municipalities are ineffective in terms of USW collection and processing. As a result, non-recyclable waste was burnt or dumped in landfills in Belgium. This may be seen in Brazilian capitals as well.
Considering all the Brazilian capitals and each year under analysis, Table 1 shows the average efficiency of the municipalities over the years. The capital with the highest average efficiency was Macapá (0.720), followed by Porto Alegre (0.712), Belém (0.691), Cuiabá (0.650), Florianópolis (0.642), Fortaleza (0.631), Brasilia (0.621), and Teresina (0.600). Based on this data, it is clear that the geographical region with the highest average efficiency is the South (0.645), followed by the North (0.634), Midwest (0.525), Northeast (0.447), and Southeast (0.236). Considering all municipalities in all the years of analysis, the Southern region remains the geographical region with the highest average efficiency.
MSW is a problem faced in many nations. Chang et al. (2013) discussed how governments might leverage prior experiences to enhance USW management efficiency. As a result, they believe that organizational learning may help organizations improve their performance over time. The impacts of organizational learning tend to accumulate over time, according to Yeh et al. (2016), and so it enables continual development in towns. Municipal managers can use the findings of this study to develop plans for improved urban solid waste management based on previous experiences.
3.2. Application and Analysis of Logistic Regression Technique
Second, the logistic regression approach was utilized to examine the influence of the variables utilized in the DEA methodology (inputs and outputs). This model, which is a mathematical approximation of the DEA methodology’s computer method, provides a more noticeable investigation of the connection between the variables employed in the DEA methodology.
Apart from the efficiency index derived from the DEA, the logistic regression model was created using the variables in Chart 1. It was chosen to proceed with the logistic regression employing binary efficiency values as output variables, with a standard of 1 for Brazilian capitals with efficiency over 0.90 and 0 for the rest of the Brazilian capitals. The hold-out approach was applied, in which the entire sample was randomly divided into two plots: 70% training data and 30% validation data, resulting in the model being validated. Given that models that fit the data are likely to be optimistic when their performance is judged based on training samples, this technique was selected. Such fact can be justified because the models are prone to adjust the individual samples, consequently, do not correspond to the population behaviour. Thus, it was decided to use data that the model (post-training) does not know, thus approaching its actual performance in explaining the relationship between the variables.
The logistic regression model consisted of the intercept and five explanatory variables. Table 2 shows the coefficients generated by the model. From the analysis of the R² statistics (Nagelkerke), it is observed that the model explains 57.9% of the independent variables.
Table 2 Estimated Logistic Regression Model
| Source | Coefficient |
| Intercept | -3.282 |
| Sweeping Expenses | -6.664 |
| Management Expenses | -6.494 |
| Number of Workers | -6.959 |
| Amount of Materials Recovered | 12.187 |
| Amount of Waste Collected | 8.493 |
Source: own elaboration based on interpretation data (2019).
The coefficients of the generated model contribute to the classification of a municipality as efficient. Based on Table 4, it is observed that the variables characterized as inputs in the DEA technique had negative coefficients; in contrast, the variables characterized as products had positive coefficients. This fact can be justified, considering that the greater the number of products and the smaller the number of inputs, the greater the tendency of capital to efficiency. It can be noted that the variables that primarily determine capital as efficient are “quantity of materials recovered” (positively), “quantity of waste collected” (positively), “the number of workers” (negatively), “sweeping expenses,” (negatively) and “handling expenses” (negatively). A classification matrix was created to test the model is predicting capabilities. It shows the number of municipalities categorized correctly and wrongly by the model. Table 3 and Table 4 show the matrices for training samples and model validation samples. Based on these tables, we can observe the number of hits, the number of false positives (inefficient capital understood as efficient), and the frequency of false negatives (efficient capital understood as inefficient). In this study, we used accuracy to evaluate the performance of the generated model, which is the percentage of correct ratings.
Table 3 Rank Matrix - Training Data Estimated
| Estimated Classification | ||||
| Observed | Efficient | Inefficient | Total | Correct Rating |
| Efficient | 18 | 9 | 27 | 66.7% |
| Inefficient | 4 | 110 | 114 | 96.5% |
| Total | 22 | 119 | 141 | 90.8% |
Source: own elaboration based on interpretation data (2019).
Table 4 Rating Matrix - Validation Data
| Estimated Classification | ||||
| Observed | Efficient | Inefficient | Total | Correct Rating |
| Efficient | 4 | 7 | 11 | 36.4% |
| Inefficient | 2 | 48 | 50 | 96.0% |
| Total | 6 | 55 | 61 | 85.2% |
Source: own elaboration based on interpretation data (2019).
In both data sets, the model’s overall performance as measured by accuracy is similar. Validation data performance is expected to decrease. The model’s high performance justifies its usage as a foundation for a comparative evaluation of the variables’ efficiency values determined by the DEA. Observing the number of false positives and false negatives, it is observed that the model tends to be conservative about forecasting municipalities as efficient. The false-negative rate is significantly lower than the false-positive rate in both sets. Thus, the model acts as a filter of municipalities, highlighting a prominent character (represented by the variables considered). This is particularly intriguing since the approach identifies efficient municipalities and may be used as management indicators for other towns.
Simões et al., (2012) examined the USW collection service in Portugal. The USW collection service is provided by the same firm that provides water distribution in this country. Consequently, the authors investigated whether the fact that the same corporation offers both public services to the public saves money. The DEA methodology was employed to assess efficiency. It was discovered that cost reductions might only be found in small municipalities that work together. Public managers might use the findings of this study to develop customized policies for the market under consideration.
Based on the findings of this study, it can be concluded that Brazilian capitals do not manage urban solid waste efficiently. It is also important to note that capitals typically serve large urban centers and metropolitan regions, leading to more significant waste management challenges.
Final Considerations
One of the main links in the waste management system, whose role is critical to reverse logistics and recycling success, is the citizen. However, some challenges still have to be overcome about its advocacy. For example, one of the prerequisites for increasing the mechanical recycling rates of the USW dry fraction is the correct segregation at source and subsequent availability for selective collection, sorting systems, reverse logistics, or other forms that effectively utilize this amount. The citizen is the principal agent in this cycle of actions, with responsibilities from the moment of consumption until the disposal of the resulting waste. However, even after three decades of selective collection in some Brazilian cities and many campaigns and actions on the subject, an Ibope survey published in 2018 (conducted interviews with 1 816 people from all Brazilian states and the Federal District) aiming to know the perception Brazilians had about waste, stressed that the population knows little or nothing about selective assortment (ABRELPE, 2017).
This research aimed to identify the efficiency level of urban solid waste management in Brazilian capitals from 2002 to 2016 and the contribution of the variables used in the DEA model. To measure the efficiency of the Brazilian capitals, the DEA technique was used, and to calculate the contribution of each variable; the Logistic Regression technique was used.
Considering the average, the southern region maintains the highest efficiency, but the capital with the best result was Macapá in the country’s northern region. The approach identified municipalities that are efficient and can be used as management indicators for other cities, such as Macapá, Porto Alegre, Belém, Cuiabá, Florianópolis, and Fortaleza. Based on the findings of this study, it can be concluded that, in general, Brazilian capitals can significantly improve the management of their urban solid waste. As a recommendation, in addition to the managers being able to improve their planning using the most efficient capitals as models, they will also be able to manage the analyzed variables better, directing more attention to the inputs, investing in a more significant number of workers, in a larger budget with total and handling expenses, thus improving the efficiency of their cities with a positive impact on both the amount of solid waste collected and the amount of material recovered.
The importance of learning is highlighted, where public managers, private organizations, and civil society can learn from the best practices carried out in the most efficient capitals and adapt them to their reality. Another important observation is the attention directed to awareness and guidance programs for society in the disposal and separation of solid waste; the efficiency of the entire process starts with conscious citizens both in consumption and in the disposal and separation of their waste.
The results obtained in this research show that the theme of urban solid waste needs to be further explored in Brazil. It is necessary to verify how the management process is carried out qualitatively to verify inefficient management in many Brazilian cities. In addition, it is highlighted that in this study, the Brazilian capitals were analyzed, as these cities are more significant and with greater public investments, which should result in better planning and more efficient management. However, we realize that this issue is being addressed in Latin America, and some countries that present similar situations as Brazil, given the need for better management of solid urban waste. However, it is necessary to emphasize that it is not possible to generalize the results when it comes to this theme, as each region presents its specificities regarding legislation, financial and cultural issues.
Through this study, public managers can verify how efficient the management of USW is in the capital in which it operates; thus, they can identify the positive and negative points and the years in which the capitals had the highest performance. In addition, efficiency is compared with capitals with similar resources so that efficient capitals can be used as benchmarks. For the academy, this research contributes to public administration, specifically in the management of USW, given that this area has received prominence in recent years.
Brazil faces a massive issue in the proper handling of urban solid waste. This issue can also be seen in other Latin American nations; according to Chicaiza-Ortiz et al. (2020), Ecuador generates 11,341 tons of waste each day, with 61.4% organic. In Ecuador, waste management is handled in the same way it is in Brazil: it is decentralized, with each municipality managing urban solid waste. However, according to the authors, around 80% of cities dispose of waste in open dumps, indicating a management problem.
According to a 2018 United Nations Environment study, one-third of all waste produced in Latin America and the Caribbean is disposed of in unsuitable locations, damaging water and land. According to the exact estimate, by 2050, daily solid waste creation is expected to grow by 25%. Furthermore, throughout Latin America and the Caribbean, just 10% of garbage gets recycled. These facts demonstrate the inadequacy of Latin American and Caribbean countries’ solid waste handling (UNEP, 2018). According to the research, although there has been a quantitative and qualitative improvement in urban solid waste management, proper management remains a significant concern for Latin American countries.
As a result, we can see that poor urban solid waste management is an issue that affects Latin America as a whole, not just Brazil. Moreover, in general, the capitals in Brazil’s southern area have had better average efficiency through time. Perhaps this is due to a higher understanding of sustainability in the country’s wealthiest areas and more investment in the sector (Dubois et al., 2017). According to the generated model, the public manager should concentrate on increasing the number of materials collected rather than lowering the number of personnel, sweeping expenditures, and USW management expenditures. Thus, it can be seen that the efficiency of solid waste management in some Brazilian cities has improved over the years. However, it is still necessary to invest in this area.
One of the study’s limitations is the small number of localities and years examined, as specific public data was unavailable. It is worth noting that the variables utilized in this study have previously been used in earlier research, and any variable added or deleted may cause the produced model to provide different findings.
For future research, it is suggested to evaluate other locations and examine other periods, expanding the comparison between decision-making units (DMUs); another factor is the identification of instruments used in the inspection and implementation of practices for solid waste management, seen that the legislation is adequate, but there is a lack of inspection and control to guarantee a correct destination for the waste. Furthermore, another research is suggested to assess the impact of cultural differences on the production and destination of solid waste. Finally, verify the relationship between the environmental education actions carried out and the results obtained by different municipalities.

