1.INTRODUCTION
Materials with nanosized structures belong to a rapid growing field of contemporary scientific interest (Kamat, 2007). Well-defined morphologies in such materials such as nanotubes, nanowire, nanotubes, and nanoparticles generally mean new physical and/or chemical properties for their bulk counterparts. It is because of the above mentioned reasons, synthesizing novel nanosized materials and probing their intrinsic properties are critical to assess their possible role in future nanodevice technology.
One-dimensional nanostructures have been in the focus of the materials science community for well more than a decade now. The extensive research in the field of one-dimensional nanostructures has led to the development of several one-dimensional moieties which can be broadly classified as carbon nanotubes and inorganic nanostructures. Carbon nanotubes in turn hold a promise to solve many challenges of materials engineering in the long run, but at present their practical applicability appears to be limited by the lack of adequately selective synthesis technologies. On the other hand, inorganic nanostructures (e.g., metallic nanowires, oxides, sulfides, selenides, etc.) can be prepared in a rather controlled manner, and therefore, their industrial scale application is very close now. TiO2 sensitization to visible light with small nanoparticles of a low band gap semiconductor (QDs) shows several advantages, for example, high extinction coefficients, tunable energetic levels and multiple exciton generation effects (Burda, Chen. Narayanan, & El-Sayed, 2005; Fernandes et al., 2016: Gulati, Santos, Findlay, & Losic, 2015; Grätzel, 2001; Hernández-Martínez, Estevez, Vargas, Quintanilla, & Rodríguez, 2012; Horváth, Kukovecz, Kónya, & Kiricsi. 2007; Hoyer, 1996; Ou & Lo, 2007). Despite of the great promise the dream of a highly efficient quantum dot /conducting polymer sensitized solar cell is still elusive. Undesirable loss of electrons at grain boundaries via recombination with redox couples impedes the efficient transport of electrons to collecting electrode surface. Titania nanotubular structures, in particular, hold special promise for many of these same applications due to their high length/diameter aspect ratio, which allows them to meet the requirements of high surface area and reduced interfacial boundaries.
In the present work we have synthesised TiO2 nanotubes using hydrothermal method, and studied the effect of annealing temperature on the crystallinity of the nanotubes. Varying the annealing temperature is one strategy to induce change in the morphological properties of materials. Annealing transforms the as-deposited amorphous titanium oxide phase to polycrystalline anatase TiO2. It has been shown that altering the annealing conditions can affect the crystal structure and photoresponse of the TiO2 NTs (Zhu, Neale, Miedaner, & Frank, 2007).
The nanotubes so obtained were sensitised using CdSe quantum dots and the structural, morphological, optical and electrical aspects have been studied.
2. MATERIAL AND METHODS
2.1 MATERIALS
For synthesis of titania nanotubes TiO2 powder (Central Drug House, 99.5%), NaOH (Merck, 98%), HCl(Merck,35%,) were used as received. The precursors cadmium oxide (CdO, Aldrich, 99.99% purity), tetradecylphosphonic acid (TDPA, Alfa Aesar,98% purity), trioctylphosphine oxide (TOPO, Aldrich, 99% purity), selenium (Aldrich, 99.5% purity), and trioctylphosphine (TOP, Aldrich, 90% purity) Oleic acid (OA , Central Drug House, 95% purity) were used as supplied to prepare CdSe QDs. Mercaptopropionic acid(MPA,Sigma Aldrich, >99%), acetonitrile (SRL, extrapure AR,99.5%purity) and Sulphuric Acid(Sigma Aldrich,99.9%purity) were used to prepare linker solution.
2.2 METHODS
(a) Synthesis of TiO2 nanotubes
Hydrothermal has been a very common method used to prepare TiO2 nanotubes since it was developed by Kasuga and co-workers (Kasuga, Hiramatsu, Hoson, Sekino, & Niihara, 1998, 1999; Wang et al, 2002). In the typical synthesis TiO2 powder was annealled at 400°C and was stirred with 10M NaOH in an autoclave at 130°C for 24 hrs. The treated powder was washed with dilute HCl and distilled water and separated by centrifugation. The nanotubes so obtained were annealed in two batches at 400°C and 600°C and their composition was analysed using XRD.
(b) Sensitization of TNT with CdSe Quantum Dots
The synthesis of CdSe nanoparticles were carried out by the chemical route using TOPO as a capping agent to control the growth of the nanoparticles to desired sizes, whose details can be found elsewhere (Bavykin, Parmon, Lapkin, & Walsh, 2004; Sharma et al, 2007). The titania nanotubes were sensitised with CdSe quantum dots by the aid of bifunctional linker mercapotopropionic acid in the similar manner as described in our previously reported work (Sharma, Sharma, Singh, & Shivaprasad, 2007). In brief the TiO2 moieties were immersed in 1M solution of mercaptopropionic acid solution for 24 hour and then were gradually added to CdSe solution. The choice of the linker stemed from the fact that it possesses a thiol group (-SH) that links to the CdSe quantum dots via Cd-S bond, and another carboxylic acid group (-COOH) that links to the TiO2. It is known that the selection of the linker for the better anchorage of colloidal QD's on to the TiO2 surface plays a vital role in the performance of QDSSC's in determining the efficiency of electron injection into the matrix.
2.3 INSTRUMENTATION
The crystalline phases of the products were determined by X-ray powder diffraction by using a RigakuminiflexIIdiffractometer with Cu K alpha radiation (λ) 1.54 Å). The morphologies of the samples were studied via a Scanning Electron Microscopy (SEM, Zies EVO M810 variable pressure SEM). Microstructural properties were obtained using a transmission electron microscope(TEM), JEOL make model JEM-200CX. For the TEM observations, the powders were dispersed in 2-propanol and ultrasonicated for 15 min. A few drops of this ultrasonicated solution were taken on a carbon-coated copper grid. Compositional analysis was performed by energy dispersive X-ray analysis (EDAX) used with the SEM. Optical absorbance of the samples was recorded via a UV-vis-NIR spectrophotometer Shimadzu 3101 spectrometer. The PL was measured using a home assembled system consisting of a two stage monochromator, a photomultiplier tube (PMT) with a lock-in amplifier for PL detection, and an Ar+ ion laser operating at 488 nm and 5 mW (corresponding to 0.125 W cm2) for excitation in all the measurements.X-ray photoelectron spectroscopy (XPS) measurements were performed in an ultra-high vacuum chamber (PHI 1257) with a base pressure of ~ 4 χ 10-10torr. The pressure during data acquisition and argon ion etching is of the order of 2.5x10⁻⁷torr. The XPS spectrometer is equipped with a high precision sample manipulator, MgKα (1253.6 eV) X-ray anode, a high-resolution hemispherical analyzer (25 meV) and a 0 ֊ 5 keV differentially pumped Ar+ ion gun.Survey scans and core level XPS spectra were obtained using pass energies of 100 and 40 eV, respectively. The resolution of the acquired core level spectra is 0.1 eV, at 90% of the peak height. The data obtained was deconvoluted into their Guassian components, using standard FWHM and position values of the known valence states (Sharma, Vats, Kumar, Jain. & Narula, 2011). All the data were corrected for electrostatic charging using the XPS lines of the graphitic C (Is) as internal energy reference.
3. RESULTS AND DISCUSSIONS
The formation mechanism of TNT has been proposed to follow a 3D→ 2D → 1D approach. This suggests that the raw TiO2 powder first convert to lamellar structures which then roll up to form tubes. The raw TiO2 material is treated with NaOH aqueous solution, Ti-O-Na and Ti-OH bonds are formed after some of the Ti-O-Ti bonds are broken.
The Ti-O-Na and Ti-OH bonds are believed to react with acid and water to form new Ti-O-Ti bonds when the material is treated with HCl aqueous solution and distilled water.
The titania nanotubes are formed in the stage of the acid treatment following the alkali treatment. The Ti-OH bond may form a sheet, which is contained in the tube structure. The Ti-O-Ti bonds or Ti-O-H-O-Ti hydrogen bonds are generated through the dehydration of Ti-OH bonds by HCl aqueous solution, the bond distance from one Ti to the next Ti on the surface decreases, resulting in the folding of the sheets. During this process, a slight, residual electrostatic repulsion due to Ti-O-Na bonds may lead to connection between the ends of the sheets and thus the completion of a tube structure. Bavykin and co-workers suggested that the driving force for curving of the sheets arose from asymmetry due to, e.g., preferential doping of the sheets with sodium or hydrogen (e.g., hydrogen deficient H2Ti3O7) together with unsymmetrical surface forces due to locally high surface energy during the crystallisation/dissolution (Fu, Liu, & Shen, 2014; Kasuga et al, 1999; Wang, Hu, Duan, Sun, & Xue, 2002). This approach can be explained in the following schematic (Fig. 1)·
(a) X-Ray diffraction Pattern
Figure 2 (a & b) shows the XRD pattern of TiO2 nanotubes and nanoparticles. In nanotubes sample rutile peaks are indexed with R while A peaks refer to the anatase planes.
The phase composition is estimated using the Spurr equation (Zhu et al, 2007):
where, FA is the mass fraction of anatase in the sample and IA and IR are the integrated intensities of the main peaks of anatase (101) and rutile (110), respectively. From the above equation the percentage of anatase phase is 51.92% for the sample annealled at 400°C and 45.36 the sample annealled at 600°C.
Fig. 2 (c & d) give the XRD pattern of CdSe -TNT nanocomposites. The pattern consists of the main TNT peaks along with CdSe features. The dense contrast indicates the presence of amorphous CdSe. The difference between the XRD pattern of TNT, CdSe and the nanocomposites suggest the formation of a heterostructure.

Fig. 2 XRD pattern of (a) titania nanotubes annealled at 400 (b) titania nanotubes annealled at 600°C (c) CdSe- titania nanotubes nanocomposites (titania nanotubes) annealled at 400°C (d) CdSe- titania nanotubes nanocomposites (titania nanotubes) annealled at 600°C.
The XRD pattern along with TEM, HRTEH and EDAX analysis give the signatures of formation of nanocomposite.
(b) SEM studies
Fig. 3 gives the SEM images of TiO2 nanotubes annealled at 600°C. The image shows randomly arranged nanotubes which is a characteristic of hydrothermal synthesis. Also some spherical particles are observed which depict the unconverted powder. The encircled portion gives the image of a high aspect ratio single nanotube almost 150nm long.
(c)TEM, HRTEM and EDAX
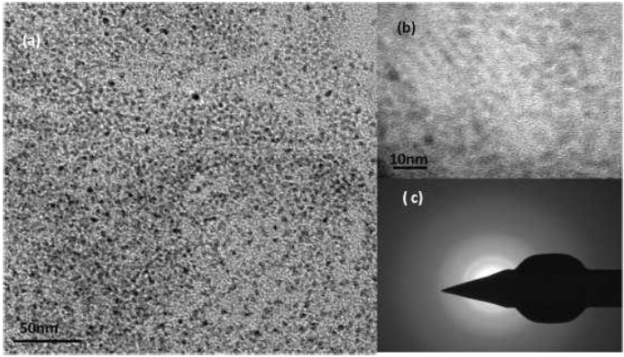
Fig.4 shows the TEM image of the nanotubes. The images reveal high aspect ratio of the nanotubes with almost 120-150nm length and about 20nm in diameter. The nanotubes are randomly aligned indicating the use of hydrothermal route for the nanotube formation. The inset in the figure show the high resolution image of a nanotube inclined horizontally. The electron diffraction pattern comprising of concentric rings indicate the polycrystalline nature of the nanotubes. The carbon and copper signals are due to the carbon coated copper grids. Fig. 5 and Fig.6 give the TEM of CdSe-TNT nanocomposites with nanotubes annealled at 400 and 600°C respectively. The nanotubes clearly appear as hollow tubular structures while the amorphous CdSe QDs present a featureless dark contrast. One of the major differences between the two nanocomposites is the amount of QD coverage in both the cases. The TEM images indicate greater QD coverage in the samples annealed at 600°C. This could be attributed to the greater anatase content of the samples. The emission pattern also gives a greater quenching in these samples. The encircled portion in Fig.5 (a) is the nanocomposites formed. The distinct difference in the spacing of lattice fringes in the HRTEM (Fig. 5(b), Fig. 6(b)) pattern is the signature of the nanocomposite formation. The electron diffraction pattern (Fig.5(c). Fig.6(c)) consisting of concentric rings is indicative of high crystalline nature of the samples.

Fig. 4 TEM image of titania nanotubes. Inset (a) HRTEM of single nanotube. (b) Electron diffraction pattern (c) Frequency distribution of length (d) Frequency distribution of width.

Fig. 6 (a) TEM CdSe- titania nanotubes nanocomposites (titania nanotubes) annealled at 400°C. (b)HRTEM and (c) electron diffraction pattern of the samples.
Fig.7 gives the EDAX of the titaniananotubes. The carbon and copper signals are due to the carbon coated copper grids. The EDAX pattern confirms the formation of Ti02. Fig. 8(b) and (c) give the EDAX of the CdSe-TNT nanocomposites. It is imperative to note the presence of sulphur peaks in the EDAX pattern apart from the Ti, O, C, Cd, Se peaks. The sulphur peaks are indicative of the use of mercaptopropionic acid (MPA) as a bifunctional linker molecule.
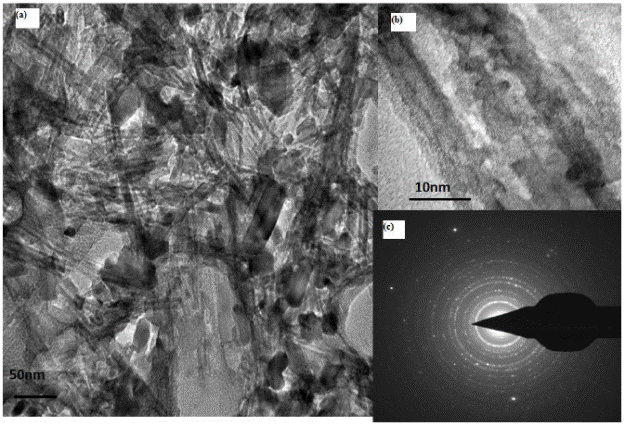
Fig. 7 (a) TEM images CdSe- titania nanotubes nanocomposites (titania nanotubes) annealled at 600°C. (b)HRTEM and (c) electron diffraction pattern of the samples.
(d)Absorption Studies
Fig.9 gives the comparative absorption pattern of TNT annealled at 600°C, TNT annealled at 400°C and their nanocomposites with CdSe.
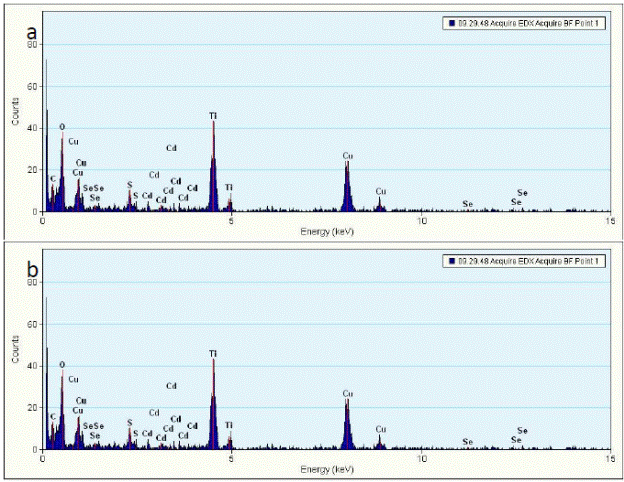
Fig. 9 EDAX pattern of (a) CdSe- titania nanotubes nanocomposites (titania nanotubes) annealled at 400°C (b) CdSe- titania nanotubes nanocomposites (titania nanotubes) annealled at 600°C.
The absorption spectrum for titania nanotubes is observed as a broad peak giving two features one at 232nm and another at 260nm.This hints at the presence of mixed phases of TiO2. The position of these peaks do not change on changing the annealing temperature. However, the peak observed is sharper for the nanotubes at 600°C. The absorption spectra of the nanocomposites are an overlap of the spectrum of individual components i.e., TiO2 feature at 232nm and 260nm while CdSe feature at around 320nm. However the CdSe peaks are more pronounced in the hybrids with nanotubes annealed at 400° C (Bavykin, Gordeev, Moskalenko, Lapkin, & Walsh, 2005).
(e) Photo luminescence Studies
PL spectra of CdSe showed a constant decrease in intensity on the gradual addition of TNT indicating
(e) Photo luminescence Studies
PL spectra of CdSe showed a constant decrease in intensity on the gradual addition of TNT indicating charge transfer Fig. 10. In case of TNT annealed-annealled at 600°C after reaching a certain point no further decrease was observed indicating saturation. However, an interesting feature was observed in case of TNT annealled-annealled at 400°C, the PL peak started increasing in intensity and after certain concentration it became greater than the original peak. This phenomenon has been reported in the systems containing titania nanotubes -conducting polymer (Nguyen, Martini, Liu, & Schwartz. 2000; Verma, Rao, & Dutta, 2009) .The phenomenon has been explained due to the transfer of photogenerated electrons to the TNT (Padmanabhan et al, 2007; Vijayan, Dimitrijevic, Rajh, & Gray, 2010).
In the simplest case of collisional quenching, the following relation, called the Stern-Volmer equation [2] holds:
where I0 and I are the fluorescence intensities observed in the absence and presence, respectively of quencher, [Q] is the quencher concentration and KSV is the Stern-Volmer quenching constant. From the linear portion of Stern-Volmer plots (Fig. 11) KSV is calculated which comes out to be 0.4x10⁻² in case of TNT annealled at 400°C while 0.8x10⁻² in case of TNT annealled annealledat 600°C indicating a faster charge transfer kinetics in spherical particles which is accounted to the higher crystalinity. However the quenching saturation is observed at lower TNT concentration for TNT annealled annealed at 400°C owing to higher anatase content.
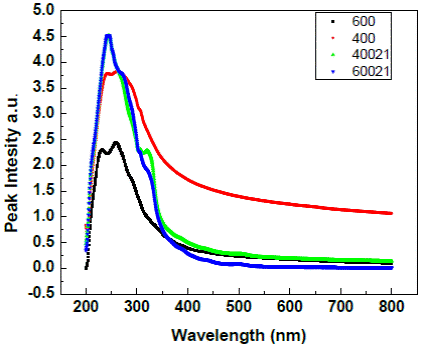
Fig. 10 Absorption spectra of (a)titania nanotubes annealled at 400 (b) titania nanotubes annealled at 600°C (c) CdSe- titania nanotubes nanocomposites (titania nanotubes) annealled at 400°C (d) CdSe- titania nanotubes nanocomposites (titania nanotubes) annealled at 600C°
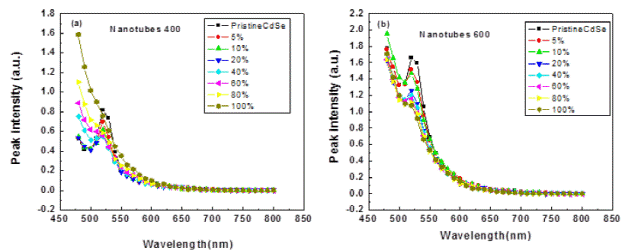
Fig. 11 PL cmmision of (a) CdSe- titania nanotubes nanocomposites (titania nanotubes) annealled at 400°C (b) CdSe-titania nanotubes nanocomposites (titania nanotubes) annealled at 600°C. The numbers indicate the percentage by weight.
4. CONCLUSION
TiO2 nanotubes were successfully synthesised using hydrothermal method. The experimental procedure includes thermal treatment of TNT arrays in air. This process strongly alters the morphology of the individual NTs and has been proved to be highly effective in inducing crystalanity and increasing charge transfer properties, which, in turn, significantly affects the electron transport and recombination kinetics and the solar energy conversion properties of QDSSCs and BHJs.
Photoluminiscence quenching data indicate that altering the microstructure changes the dynamics of transport and recombination in different ways. The Stern Volmer plots give faster quenching kinetics of TNT annealledannealled at 600°C, while those annealledannealled at 400 ° C quenched the PL intensity at lower concentration. The study indicates that the one dimensional nanotubular TiO2 holds a special promise to be a useful photovoltaic material due to its high length/diameter aspect ratio, which allows them to meet the requirements of high surface area and reduced interfacial boundaries. Understanding the fundamentals of the structural parameters, methods by which these parameters can be altered and exploiting them to build devices with high efficiency hold the key to the energy crisis of the world.


 nueva página del texto (beta)


