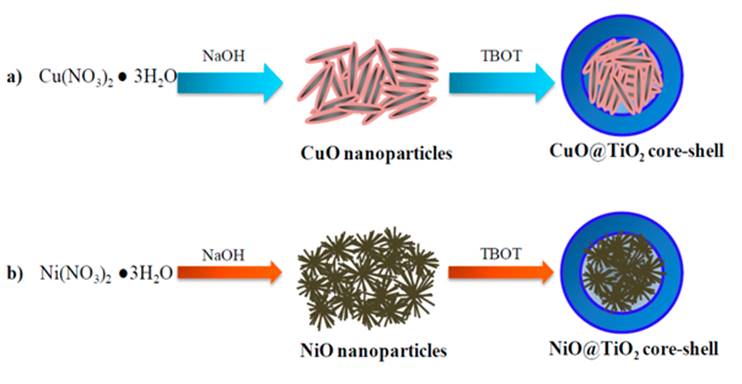
1. Introduction
Hydrogen is a type of clean fuel as its combustion in a fuel cell generates only water emission. A variety of feedstock can be used for hydrogen production, including fossil resources such as petroleum, natural gas, and coal; and renewable resources such as biomass and water. Several processes and technologies for hydrogen production are well known, these include water electrolysis (Grigoriev, Porembsky, & Fateev 2006; Stolten, 2010; Zhang, Li, Wang, Wang, & Wang, 2013), coal gasification (Mostafavi, Mahinpey, Rahman, Sedghkerdar, & Gupta, 2016; Rezaiyan & Cheremisinoff, 2005), steam reforming of natural gas (Guevara et al., 2010; Kyriakou et al., 2016), etc. Recent investigations focus on finding efficient and economic technical routes for hydrogen production. Photocatalytic production of hydrogen has become a topic of international interest because of its low cost potential and environmentally friendly nature. Photocatalytic hydrogen production can be performed under mild conditions and biomass such as alcohols, glycerol, glucose and sugars can be utilized for sustainable production of hydrogen. Recent years, a large amount of glycerol were produced as a byproduct in biodiesel industry and they highly demand for new processes toward applications. Hydrogen production using glycerol as feedstock via photocatalytic route is a promising research topic with practical application in fuel cell technology.
Several investigators have reported different attempts to improve the photocatalytic efficiency of the semiconductors and retard the electron-hole recombination via noble metals doping (Wei, Liu, & Li 2013; Wu et al., 2008), metal ion doping (Cai, Lu, He, & Lan, 2012; Dholam, Patel, Adami, & Miotello, 2009), and anion doping (Asahi, Morikawa, Ohwaki, Aoki, & Taga, 2001; Tian, Ma, Li, & Li, 2009) on semiconductors. The excited electrons can be transferred in coupled semiconductors from the high conduction band to the low one, leading to an efficient separation of photogenerated electron-hole pairs (Zheng, Wei, Wei, Xie, & Wei 2010). Consequently, the coupling of semiconductors and metals or oxides is an effective approach to prepare photocatalysts with high activity and stability.
In the photocatalytic reactions, the synthesis methods of the photocatalyst take the key role. Core-shell nanoparticles have been demonstrated to possess improved physiochemical properties for a wide applications in electronics, magnetism, optics and catalysis, and so forth. Numerous studies have demonstrated that the nanoparticles with unique core-shell structure can improve their catalytic activity and selectivity. It is reported that the coupling of CdS and TiO2 nanorods has a beneficial role in improving charge separation and in the reduction of electron-hole recombination rate, due to the quick transferring of the excited electrons from CdS nanoparticles to TiO2 nanorods (Jia, Xu, Hu, Tang, & Zhang 2007); and the extension of absorption spectrum into the visible region by TiO2@CdS core-shell nanorods may benefit the photoreactions under solar light irradiation condition.
TiO2 has been extensively studied to support the future hydrogen economy due to its high catalytic activity, long-term photostability, strong oxidizing power, abundant availability, and environmentally friendly nature (Kokporka, Onsuratoom, Puangpetch, & Chavadej, 2013; Zhang, Xu, Li, & Wang, 2012). However, it can be activated only under UV light irradiation (i.e. approximately 380 nm) due to its relatively big band gap energy (titania anatase 3.2 eV and rutile 3.0 eV). To extend its light absorption into the visible light spectrum and prevent the high recombination rate of photogenerated electron-hole pairs, synthesis of core-shell nanostructure of TiO2 is regarded as an excellent option. Several semiconductors have been used as sensitizers in core-shell structures because they are capable of transferring electrons between dopers and TiO2; for instance, Fe3O4@TiO2 (He, Zhang, Xiong, Xiong, & Xiao, 2008), Cu2O@TiO2 (Su et al., 2009), WO3@TiO2 (Smith & Zhao, 2009), CdS@TiO2 (Meng et al., 2012), Fe3O4@ZnO@TiO2 (Wang, Liu, Wang, Kong, & Qiu, 2012), ZnS@TiO2 (Vaidya, Patra, & Ganguli, 2010), and so on, showing good activity for different applications.
Among the low-cost transition metal oxide catalysts, copper and nickel oxides are two of the most efficient oxidation catalysts to substitute precious metals. The oxidation states of copper may vary between Cu2+ in CuO, Cu+1 in Cu2O and Cu0; and nickel oxidation states vary among Ni2O3, NiO and Ni, depending of reaction condition. The oxygen defects in the crystalline structure and adsorbed oxygen species in these oxides are thought to be the reasons for their high activity and selectivity (Radwan, El-Shall, & Hassan, 2007). CuO alone is inactive for H2 production under UV or visible light irradiation since the conduction band of CuO is more positive than that of the H2O/H2 redox potential. It is widely recognized that p-type CuO in CuO/TiO2 catalyst facilitates charge separation and acts as a water reduction site (Chen, Jovic, Sun-Waterhouse, Idriss, & Waterhouse, 2013) and it has also been regarded as a good active component for the reduction of water under sacrificial condition (Wu et al., 2015), because CuO may inhibit the recombination between photogenerated electrons and holes, and thus decrease the band gap energy of TiO2. On the other hand, it is reported that p-type (NiOx)-n-type (TiO2) heterojunction can be formed in the NiOx doped TiO2. Such NiOx-doped TiO2 catalysts were recently reported to show good catalytic performance in the photocatalytic degradation of organic compounds (Liu et al., 2014; Riaza et al., 2012).
In the present work, some new results of CuO@TiO2 and NiO@TiO2 core-shell catalysts for photocatalytic hydrogen production are reported where CuO or NiO were prepared as core and TiO2 as shell. Their photocatalytic performance in the H2 production was evaluated using glycerol aqueous solution as a reactant feedstock. For comparison purpose, other two types of NiO@CuO and CuO@NiO core-shell catalysts as well NiO and CuO oxides were also synthesized and evaluated. The photocatalytic activity of all the solid samples for hydrogen evolution under simulated solar light irradiation was then compared under the same operation condition.
2. Experimental
2.1. Materials
Copper nitrate (98.5%, Cu(NO3)2·5H2O), nickel nitrate (98.2%, Ni(NO3)2·6H2O), sodium hydroxide (98%, NaOH), titanium (IV) butoxide (98%, TBOT) and hydroxypropil cellulose (Mw ̴ 80000) were purchased from Sigma-Aldrich. Absolute ethanol (99.9%) was obtained from J.T Baker. Deionized water was produced using millipore purification system installed in our laboratory. All reagents were used as received without further purification.
2.2. Preparation of the photocatalysts
2.2.1. Synthesis of CuO and NiO nanoparticles
CuO solid was prepared using copper nitrate as Cu precursor in ethanol in a 250 ml beaker using a sol-gel method. An appropriate amount of copper nitrate was dissolved in ethanol with a molar ratio of copper nitrate to ethanol 1:10. Then 1 M NaOH solution was added to the solution with constant stirring to control pH at 11 approximately. The temperature of the precipitated mixture was remained at 80 ºC and maintained for 6 h under stirring at 600 rpm. The precipitates were then washed three times with deionized water to remove the impurities and the filtrate was dried in an oven in air at 80 ºC for 12 h. Finally, the dried solid was grounded and was calcined a muffle furnace at 350 ºC at a temperature increasing rate of 1 ºC/min to obtain CuO metal oxide nanoparticles. NiO nanoparticles were prepared with a similar way but using nickel nitrate as Ni precursor.
2.2.2. Synthesis of TiO2 coating on CuO and NiO
CuO nanoparticles (0.125 g) were dispersed in 5 mL absolute ethanol and this suspension was added into a solution consisting of 0.1 g hydroxypropyl cellulose, 20 mL absolute ethanol and 0.125 mL deionized water. This resultant mixture was stirred for 30 min at 600 rpm, and then 1 mL titanium (IV) butoxide (TBOT) in 5 mL absolute ethanol was injected, using a syringe pump, into the above mixture at a rate of 0.5 mL·min-1. This mixture was stirring at 900 rpm and a milk-like gel was obtained. After injection, the temperature of the gel was increased to 85 °C under reflux and agitation condition for 90 min. The precipitate containing CuO@TiO2 solid was centrifuged, washed three times with ethanol and was dispersed in 5 mL absolute ethanol. The coating procedure was repeated three more times in order to increase thickness of TiO2 layer. Finally, the samples were dried and calcined at 400 °C (1 ºC/min) for 3 h in air atmosphere. The same procedure was followed for the preparation of NiO@TiO2 core-shell nanoparticles but using NiO as core.
2.2.3. Synthesis of NiO@CuO and CuO@NiO core-shell solids
In order to prepare NiO@CuO core-shell solid, 0.125 g of NiO nanoparticles were dispersed in 5 mL absolute ethanol following by adding it into a mixture of hydroxypropyl cellulose (0.1 g), absolute ethanol (20 mL) and deionized water (0.125 mL). After stirring (30 min at 600 rpm) a solution of 0.3 g Cu(NO3)2·3H2O in 5 mL absolute ethanol was injected into the above solution at a rate of 0.5 mL min-1. This mixture was stirring at 900 rpm. After injection, the temperature of the resulted gel was increased to 85 °C under reflux and agitation condition for 90 min. The NiO@CuO precipitate was collected by centrifugation, rinsed three times with ethanol and redispersed in 5 mL absolute ethanol. The coating procedure was repeated three more times. The resulting powders were dried at 80 °C and then calcined in air at 350 °C for 2 h. Same procedure was followed for CuO@NiO nanostructure preparation but using 0.3g of Ni(NO3)2·3H2O as precursor of NiO shell and 0.125 g CuO solid as core.
2.3. Characterization techniques
X-ray diffraction measurements were carried out on a Rigaku MiniFlex 600 X-ray diffractometer, using CuKα1 radiation (λ=1.5406 Å). The accelerating voltage and the applied current were 40 kV and 15 mA, respectively. The 2 two-theta angular regions from 10º to 100º were explored with a scanning speed of 0.1°/min. The crystallite size of the samples was calculated using the Scherrer’s formula.
Diffuse reflectance UV-visible spectroscopic (DRS-UV-vis) analyses were performed on a UV-visible spectrophotometer GBC Cintra 20 and the UV-visible spectra were recorded over the range from 200 to 800 nm. The reflection data were converted to absorbance through the standard Kubelka- Munk method.
Scanning electron microscopy (TEM) images were acquired on a FEI Quanta 3D equipped with X-ray energy dispersive spectrometer (EDS). SEM was operated at 10 kV while EDS analysis in the selected area was performed at 30 kV.
Transmission electron microscopy (TEM) observations of the nanoparticles were done using JSM 7800F JEOL, equipped with energy dispersive spectrometer (EDS). TEM was operated at 15 kV. For TEM images the sample powders were dispersed in isopropyl alcohol by using ultrasonic radiation for 10 min and a drop of the suspension was placed onto the copper-coated grids.
The X-ray photoelectron spectroscopy (XPS) was used to examine the surface properties about chemical valence and oxidation state of the metal elements after the catalytic test. XPS can detect signals within the upper 5-10 nm thickness on the surface. The XPS measurements were carried out with a K-Alpha Thermo Scientific spectrometer equipped with a hemispherical electron analyzer and a monochromatic Al Kα X-ray source.
2.4. Hydrogen evolution via photocatalytic method
The photocatalytic activity for hydrogen evolution was studied in a closed-gas circulation system connected to a gas chromatograph analyzer (autosystem XL Perkin Elmer) that was equipped with a Carbonxen 1006 PLOT capillary column and a thermal conductivity detector (TCD). The photocatalyst (15 mg) was added in a 20 mL transparent glass vial containing 1.5 ml glycerol and 13.5 ml deionized water. This glass vial was connected to a closed gas circulation system. The suspension was then exposed to an Hg-Xe Newport 66901 (solar simulator) 200 W irradiation lamp at a distance of 17 cm. Before each experiment the suspension was dispersed in an ultrasonic bath for 15 min then the photocatalytic cell was purged with nitrogen for 15 min to eliminate oxygen and other gases. The reaction was performed at ambient temperature and atmospheric pressure (0.8 atm at Mexico City) during 8 h with vigorous agitation (500 rpm) to ensure the uniform irradiation of the suspension. The photocatalytic cell was equipped with gas inlet/outlet lines and sealed with a silicone rubber septum to collect and transfer gaseous products to the analytical system for analysis. The gaseous products were analyzed using an on line gas chromatograph analyzer equipped with thermal conductivity detector. The photocatalytic activity of different catalysts for H2 production using glycerol-water mixtures (90 vol.% glycerol and 10 vol.% H2O) as feedstock was evaluated under simulated solar light at ambient temperature. The evolution rates of hydrogen (rH2) and CO2 (rCO2) were expressed as μmol∙gcat-1∙h-1.
3. Results and discussion
3.1. Crystalline structure
X-ray diffraction patterns of CuO and CuO@TiO2 are shown in Fig. 1A and the X-ray diffraction patterns of NiO and NiO@TiO2 are shown in Fig. 1B, respectively. The XRD peaks of copper oxide sample (2θ = 32.5°, 35.4°, 38.7°, 48.7°, 53.5°, 58.3°, 61.5°, 66.2°, 68.1° and 72.4°) corresponded to the monoclinic CuO phase (JCPDS No. 48-1548), demonstrating the formation of well-crystallized monoclinic CuO nanoparticles.
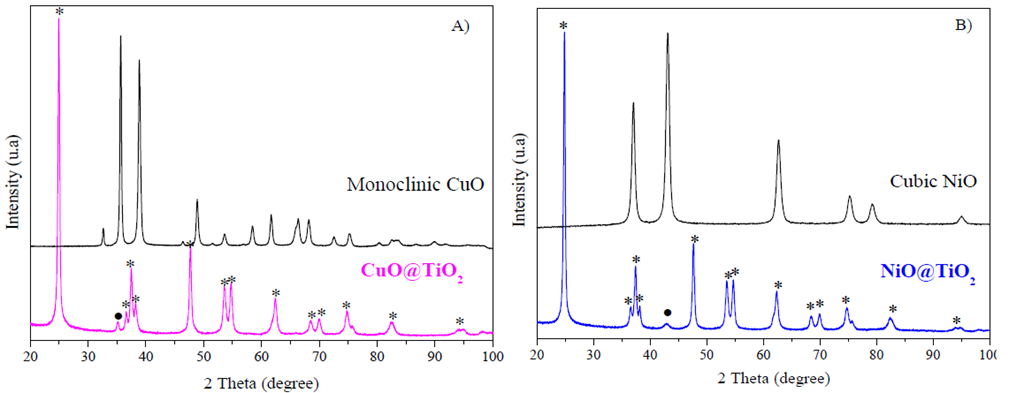
Figure 1 X-ray diffraction patterns of core-shell catalysts calcined at 400 °C. A): pure monoclinic CuO and CuO@TiO2; B) pure cubic NiO and NiO@TiO2. *represents TiO2 anatase phase, ( CuO monoclinic phase, and ( NiO cubic phase.
In Fig 2B, pure NiO sample shows peaks at 2θ = 37.2°, 43.3°, 62.9°, 75.4° and 79.4° which can be well indexed to the cubic structure of nickel oxide (JCPDS No. 47-1049). Besides the characteristic peaks of CuO and NiO, no impurity peaks were detected in these two samples. The average crystallite sizes estimated from the FWHM of NiO (2 0 0) and CuO (0 0 2) reflections using the Scherrer equation are 17.1 nm for CuO and 11.9 nm for NiO, respectively.
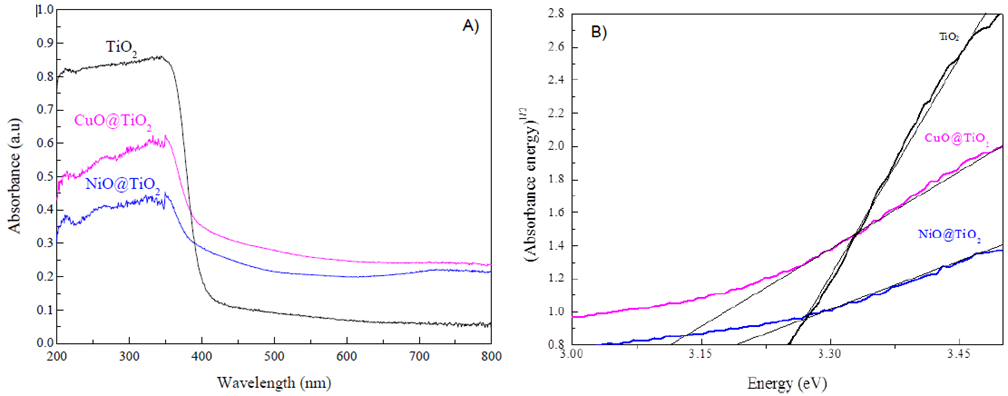
Figure 2 A) UV-vis spectra measured for NiO@TiO2, CuO@TiO2 and TiO2; B) Plot of (adsorbance·energy)1/2 versus energy.
X-ray diffraction patterns of the CuO@TiO2 and NiO@TiO2 core-shell samples corresponded to predominated anatase phase; however, a small amount of CuO peak at 35.4° (0 0 2) and NiO peak at 43.3° (2 0 0) were also detectable. In both XRD patterns, the peaks at 2θ = 25.3°, 36.6°, 37.8°, 38.6°, 48.0°, 53.9°, 55.1°, 62.7°, 68.8°, 70.3°, 74.1°, 82.2° and 94.2°, are indexed as anatase TiO2 (21-1272 JCPDS card). The anatase TiO2 crystallite size calculated from the most intense diffraction peak (1 0 1) at 25.3° is 41.2 nm for NiO@TiO2 and 44.8 nm for CuO@TiO2, Table 1.
Table 1 Specific surface area, average pore size, pore volume and crystallite size.
| Catalysts | Surface area (m2/g) | Average pore size (nm) | Pore volume (cm3/g) | Crystallite size* (nm) |
|---|---|---|---|---|
| NiO | 67 | 62.1 | 0.05 | 11.9 |
| CuO | 55 | 54.8 | 0.08 | 17.1 |
| NiO@TiO2 | 73 | 50.2 | 0.09 | 41.2 |
| CuO@TiO2 | 52 | 48.2 | 0.06 | 44.8 |
*Crystallite size were calculated from XRD pattern according to the Scherrer equation.
The phase composition of CuO@TiO2 core-sell catalyst was obtained by simply calculating the weight difference after and before TiO2 deposition. In our samples, the content of metal oxide NiO and CuO was controlled to approximately 15wt% by initial weigh calculation. In the CuO@TiO2 core-sell catalyst, only very weak characteristic peak of NiO and CuO in both the NiO@TiO2 and CuO@TiO2 samples were observed, indicating the formation of TiO2 thick shell or coating on NiO and CuO oxides (Lee, Joo, Yin, & Zaera, 2011).
3.2. UV-Vis DRS analysis
The optical properties of CuO@TiO2 and NiO@TiO2 photocatalysts were investigated by the UV-Vis DRS technique and the plots of Kubelka-Munk function (αhν)1/2 versus energy (hν) were shown in Fig.2A and Fig.2B. From Fig. 2A, the UV-vis-DRS spectra of both CuO@TiO2 and NiO@TiO2 samples are similar to the bare TiO2, showing strong absorption band at 350 nm approximately. In the visible light absorption region, one weak band appeared between 700 and 800 nm, indication that CuO@TiO2 and NiO@TiO2 have a certain ability of absorbing visible light. As seen in Fig. 3B, the band gap energy was estimated to be 3.25 eV for TiO2, 3.19 eV for NiO@TiO2, and 3.11 eV for CuO@TiO2. It is reported that, the addition of Ag, Cu, Pt to TiO2 results in changes in the band gap transition to larger values in wavelength (Grabowska et al., 2013; Kowalska, Remita, Colbeau-Justin, Hupka, & Belloni, 2008). Our results obtained from Fig. 2 demonstrate that encapsulation of TiO2 anatase layer over CuO and NiO phases results in a reduction in the band gap energy of TiO2 in the CuO@TiO2 and NiO@TiO2 core-shell structures with respect to bare TiO2 (Eg=3.25 eV) (Luna et al., 2016).
3.3. Morphological features ― SEM and TEM observation
The morphology of pure NiO and CuO oxides was observed by SEM and was shown in Figure 3. SEM images for pure NiO showed many agglomerates of fine nanoparticles forming a dandelion-like structure. A close SEM observation reveals that CuO have nanorod shape with homogeneous morphology and uniform size. The length of the CuO nanorods is approximately 0.5~1.0 μm.
Fig. 4 shows the TEM micrographs of the NiO@TiO2 and CuO@TiO2 photocatalysts. Some larger irregular particles with spherical morphology can be observed in both materials. The diameter of spherical agglomerates calculated from TEM images is about 400~500 nm for both NiO@TiO2 and CuO@TiO2. These agglomerates consist of many small particles with diameter 20-50 nm. The EDS spectra of NiO@TiO2 and CuO@TiO2 samples are shown in Figs.4C and 4D. EDS profile confirmed that Ti element is predominantly distributed in the outer shell of both CuO@TiO2 and NiO@TiO2 samples. TiO2 rough surface is composed of small spherical anatase TiO2 crystals as evidenced by XRD analysis. In both samples, Cu and Ni elements are detectable with very low concentration, indicating that CuO and NiO cores were encapsulated by TiO2 shell. Based on the XRD patterns, EDS analysis, and TEM observation, a schematic representation of CuO@TiO2 and NiO@TiO2 nanostructures is shown in Fig.5.
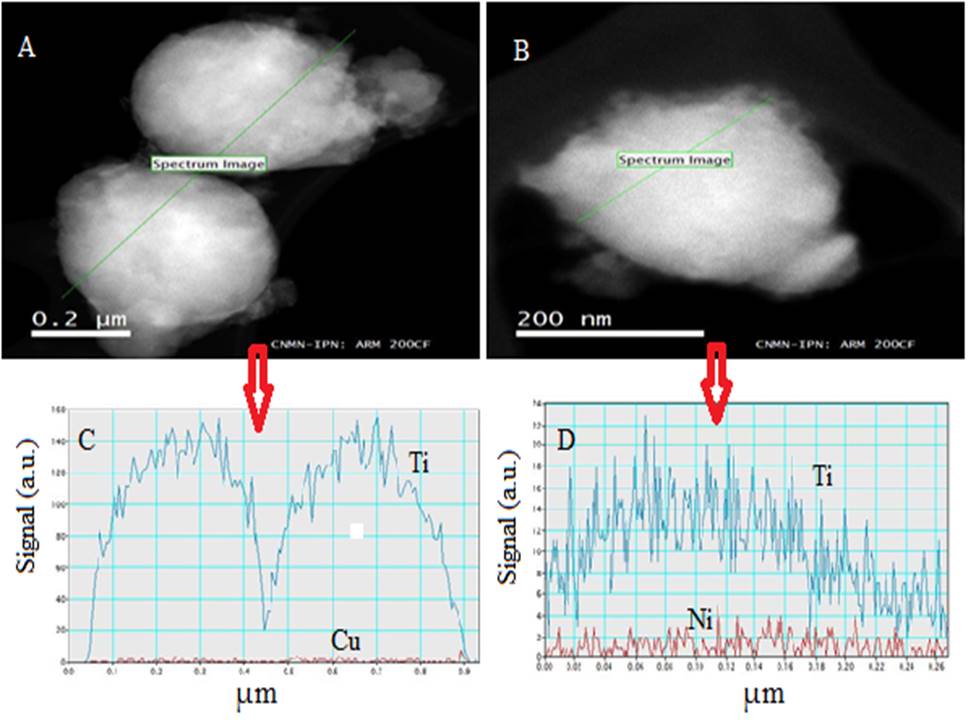
Figure 4 TEM images and EDS spectra of and CuO@TiO2 and NiO@TiO2 catalysts. (A) NiO@TiO2. 90,000 × magnification.
3.4. Textural property ― N2 physisorption
The textural characteristics of NiO@TiO2 and CuO@TiO2 core-shell nanoparticles were analyzed by nitrogen sorption isotherm technique. Fig. 6 shows the loops of nitrogen adsorption-desorption isotherms of the samples. The hysteresis loops belong to type IV isotherm according to the IUPAC classification (Sing et al., 1985). Table 1 shows the pore size distribution, average pore volume, and surface area for NiO, CuO, NiO@TiO2, and CuO@TiO2. The BET surface area of NiO@TiO2 and CuO@TiO2 samples is 73 m2/g and 52 m2/g, respectively. The average pore size is 50.2 nm for NiO@TiO2 and 48.2 nm for CuO@TiO2. For both samples, BET surface areas are bigger than 50 m2/g, a common surface area for TiO2. For comparison purpose, the textural data of NiO and CuO are also reported. The pure NiO and CuO solids have crystallite size smaller than 18 nm, which are smaller than that of TiO2 in NiO@TiO2 and CuO@TiO2 solids, but their surface areas are not significantly different from binary oxides.
3.5 Surface chemical analysis ― XPS
Figure 7 shows the general survey scan XPS spectra of the NiO@TiO2 and for CuO@TiO2 samples. Carbon emission peak observed in the spectra is related to the surface adsorbed carbon dioxide species or trace carbon containing species on the surface of the sample resulting from the sol-gel synthesis procedure (Liu et al., 2014). The core levels of Ti 2p, O1s and Ni 2p signals of the XPS spectra for NiO@TiO2 and Ti 2p, O 1s and Cu 2p for CuO@TiO2 were recorded. The values of binding energy (BE) of Ti 2p spectrum (Fig. 8A) were 458.8 eV (2p3/2) and 464.5 eV (2p1/2) in both NiO@TiO2 and CuO@TiO2. These peaks have been assigned to Ti4+ in the crystalline structure of anatase TiO2 (Liu, Yoshida, Fujita, & Arai, 2014).
For NiO@TiO2 catalyst, the XPS spectrum, Fig. 8B, shows one principal peak O 1s with binding energy 530.10 eV that corresponds to lattice O2- in TiO2 or /and O2- ion NiO; while for CuO@TiO2 the O1s peak at 530.09 eV is attributable to lattice O2- in TiO2 or /and O2- ion in CuO with BE values of 528.60~530.70 eV. One small peak at approximately 532.2 eV may indicate some oxygen in hydroxyls species in the surface of the samples.
In Fig. 8C, the Cu 2p core level of XPS spectrum shows the characteristic peaks at 952.7 eV (Cu 2p1/2) and 932.7 eV (Cu 2p3/2) of Cu2+ ion and a typical shake up satellite peak occurring at 943.1 eV (Cu 2p3/2) characteristics of CuO (Rao, Meher, Mishra, & Charan, 2012; Zeng et al., 2014; Ghijsen et al., 1998). The Cu 2p1/2 peak was fitted by two peaks at 951.9 eV and 953.1 eV, corresponding to Cu2+ in CuO and Cu+ in Cu2O, respectively. Similarly, the broad Cu2p3/2 peak was deconvoluted into one peak with BE of 933.3 eV and another with BE of 932.1 eV that corresponds to Cu2+ in CuO and Cu+ in Cu2O, respectively. Because XPS analysis mainly indicates the surface elements distribution, therefore, this result suggests that a certain amount of Cu2+ and Cu+ ions coexisted in the shell layer of TiO2.
Fig 8D shows Ni 2p core levels of XPS spectrum which can be deconvoluted into NiO oxide and Ni hydroxide species (Biesinger, Payne, Lau, Gerson, & Smart, 2009). A main peak at 855.4 eV (Ni 2p 3/2), and its satellite peak at 861.7 eV (2p 3/2 sat) corresponding to Ni2+ ion are observed (Rao et al., 2012). In this sample, nickel hydroxide phase was formed in the surface.

Figure 8 The core levels of XPS spectra of NiO@TiO2 and CuO@TiO2 catalysts. A) Ti 2p; B) O 1s; C) Cu 2p; and D) Ni 2p.
On the basis of XRD and XPS analysis of CuO@TiO2 and NiO@TiO2 catalysts. We may confirm that these two solids are composed of TiO2 shell and an oxide core. In the TiO2 shell layer, there exist some Cu2+ and Cu+ ions in the CuO@TiO2 catalyst and Ni2+ ions in NiO and Ni(OH)2 phase. These results also indicate that Cu2+ ions are partially reduced and some Ni2+ are hydrated to form the nickel hydroxide. However, they are all in a very small amount with size in nanoscale as they are not detectable by XRD analysis. The surface element compositions obtained from XPS analysis of NiO@TiO2 and CuO@TiO2 catalysts are reported in Table 2.
3.6. Photocatalytic activity
As description in equation 1, in the photoreforming reaction of glycerol in water solution, H2 and CO2 are the two products with stoichiometric molar ratio 7:3.
The H2 and CO2 evolution rates achieved on different catalysts are presented in Fig. 9. TiO2 Degussa P25 was also tested as a reference for comparison. When CuO@TiO2 was used as catalyst, the H2 evolution rate (rH2) was as high as 153.8 μmolgcat−1h−1. For NiO@TiO2 catalyst, the H2 evolution rate was 48.1 μmol gcat−1h−1. For the other catalysts, such as TiO2 P25, NiO@CuO, and CuO@NiO, their H2 evolution rate was 13.8, 6.2 and 5.3 μmol gcat−1h−1, respectively. Both CuO@NiO and NiO@CuO catalysts displayed very low photocatalytic activity for H2 production, showing that CuO and NiO were not the active phase. Therefore, nanoparticles consisting of TiO2 shell incorporation with CuO or NiO core dramatically enhanced the rate of H2 production where TiO2 serves as active phase in the control reaction condition. In comparison with results reported by Zhou and Li (2017), the H2 evolution rate obtained over CuO@TiO2 core-shell catalyst in the present work (153.8 μmol·g−1h-1) is greater than the value 131.32 μmol·g−1h-1 obtained from MoS2@TiO2 core-shell catalyst under similar condition. Moreover, the CuO@TiO2 core-shell catalyst is cheaper than MoS2@TiO2, and therefore our catalysts are more attractive.
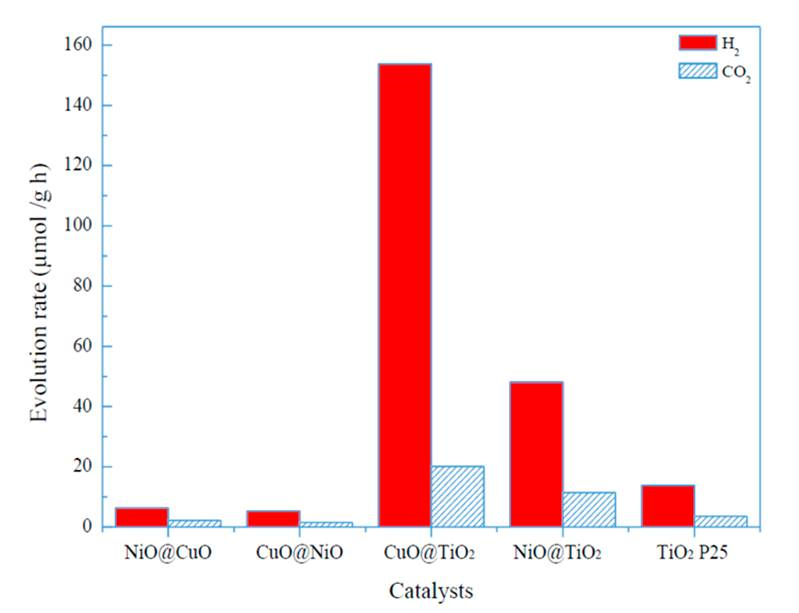
Figure 9 Evolution rate of H2 and CO2 with different photocatalysts using glycerol-water mixture under visible light irradiation at ambient temperature.
The rate of CO2 evolution was 20.1 μmol gcat −1h−1 for the CuO@TiO2 catalyst, which corresponded to a molar ratio of H2/CO2 7.65. This value is approximately 3 times greater than the stoichiometric value 2.33 of H2/CO2. For the other catalysts, the molar ratio of H2/CO2 is 4.18 for NiO@TiO2, 3.53 for CuO@NiO, 3.29 for TiO2 P25, and 2.82 for NiO@CuO, respectively. The fact of all the actual H2/CO2 values greater than the stoichiometric value indicates that some other intermediates were produced during alcohol photoreforming reactions. Indeed, methane was detected in the reaction effluents. The photocatalytic oxidation of glycerol aqueous solution may take place, leading to secondary alcohol photoreforming to methane via β-hydride elimination (Bahruji et al., 2016; Martínez et al., 2019). Moreover, coke like materials may be formed on the catalysts that resulted in CO2 formation lower than its stoichiometric value. In addition, the most active CuO@TiO2 catalyst may also simultaneously catalyze the water spilling reaction to generate hydrogen, beside the glycerol reforming reactions. In the present experiment, the selectivity of H2 production is greater than 90% for both CuO@TiO2 and NiO@TiO2 catalysts.
In order to study the effect of photocatalyst concentration in the reaction mixture on the catalytic activity, the hydrogen production rates were measured by varying the catalyst mass, shown in Fig. 10. As the photocatalyst concentration increased from 0.5 to 1 g/L (one gram of catalyst per liter of reaction mixture), the photocatalytic hydrogen production rate was increased by almost 3 times; however, when the catalyst concentration in the suspension further increased from 1 to 2 g/L, hydrogen production rate was increased by only 15~18 %. This is probably related to the effects of light absorption and scattering. When the photocatalyst concentration was relatively high, the solar light was not able to completely penetrate the suspended mixture due to scattering influence by the suspended solid particles. Therefore, the photocatalytic H2 production rate was not proportional to catalyst mass. Too big amount of the catalyst mass may not benefit the increment of photocatalytic H2 production. In the present experiment, we did not further test the effect of catalyst mass greater than 3g/L.
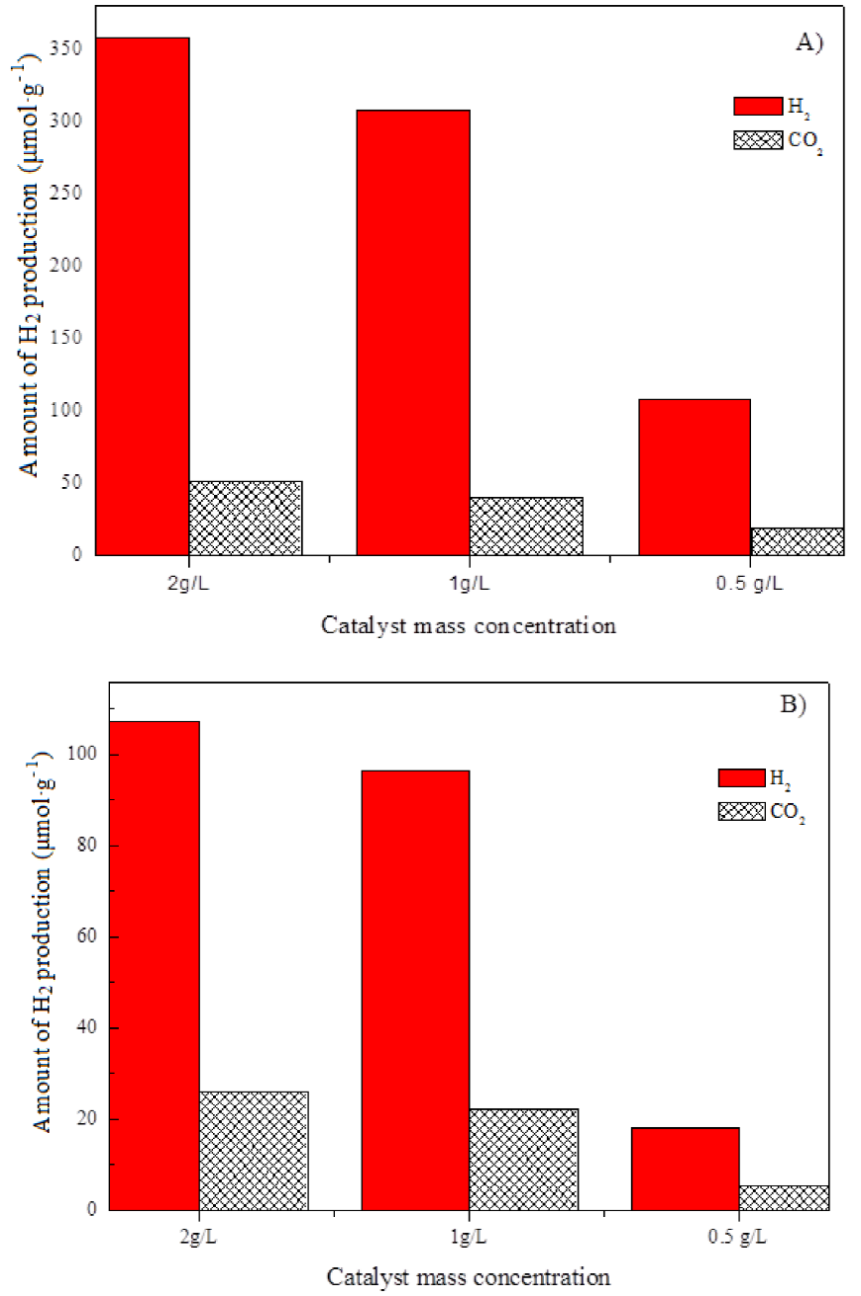
Figure 10 Variation of hydrogen generation amount obtained at 2 h of reaction with catalyst mass concentration. (A) CuO@TiO2; (B) NiO@TiO2.
The photocatalytic stability of the two better CuO@TiO2 and NiO@TiO2 catalysts was measured in five catalytic runs and each recycling took for 6 h of reaction. The H2 production rate results are plotted Fig. 11. In both catalysts, the rH2 value gradually decreased with the increase of the number of reaction cycle. For each cycle, the rH2 value increased in the first two hours of reaction, and then it gradually reduced. For the best catalyst CuO@TiO2, after total 30 h of reaction of 5 runs, the rH2 value diminished to approximately 25 μmol g−1.
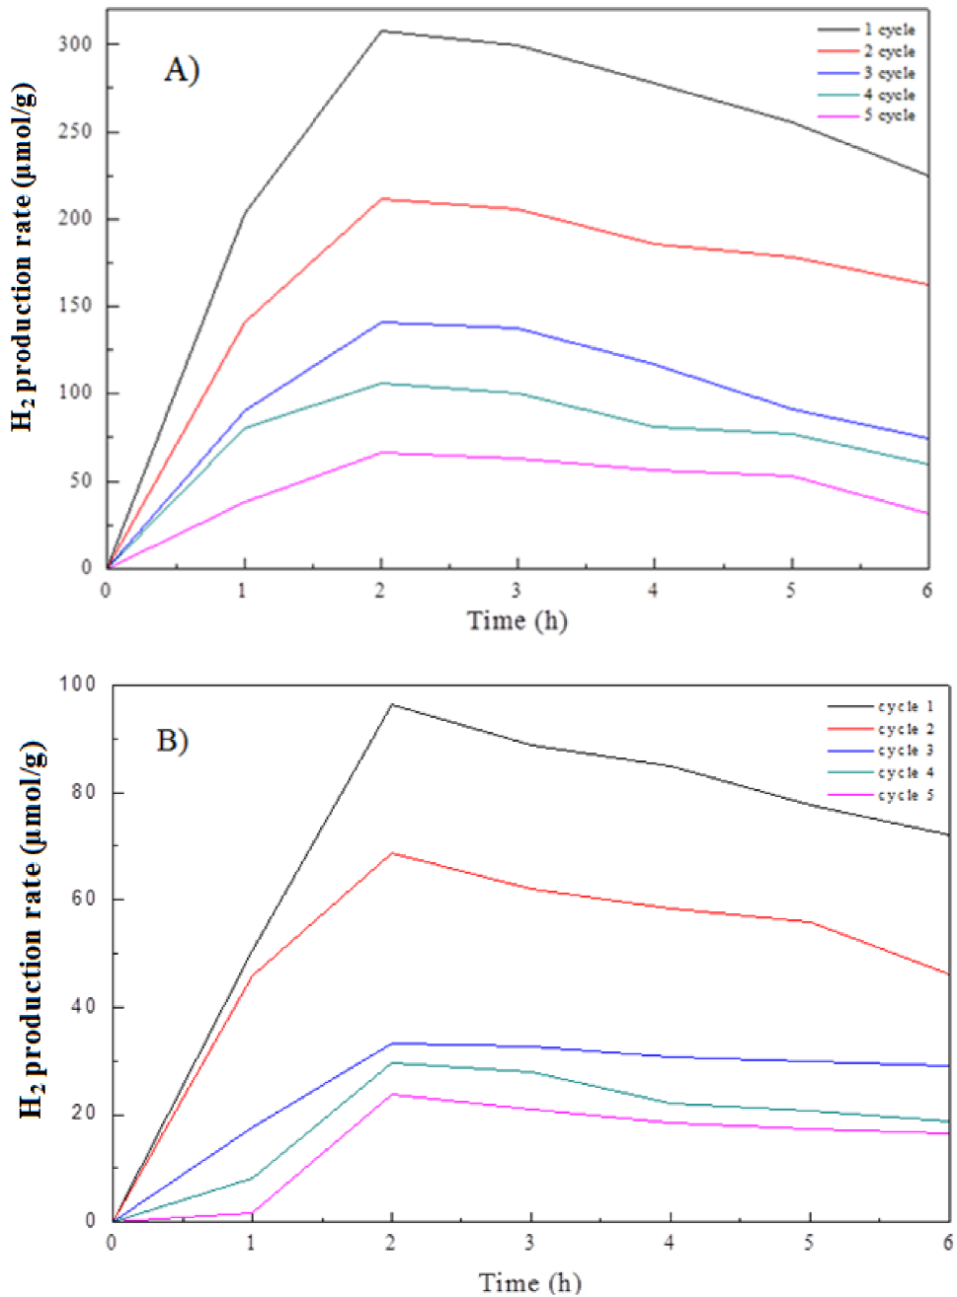
Figure 11 H2 generation amount obtained in various reaction cycles with different catalysts. Each cycle lasted 6 h of reaction. A) CuO@TiO2; B) NiO@TiO2.
When the hydrogen production rates obtained in initial 2 h of reaction in each cycle were compared, Fig. 12, it was found that the rH2 value in each cycle was increasing to maximum at around 2h of reaction. This seems to indicate that there exists an induction period of reaction that may be related to adsorption of glycerol on the active sites of the catalysts; and the rH2 is obviously affected by the amount of adsorbed glycerol. Compared to the data obtained in the first run, this maximum rH2 value in other cycles gradually decreased. These data reveal that the catalytic activity of the catalysts show a certain degree of deactivation in the following cycles. Some of active sites in the catalyst surface were probably covered by intermediate species of glycerol such as coke like materials, which were not removed in time during the reaction, leading to the reaction rate diminishing. The deactivation behavior will be deeply explored in the future.
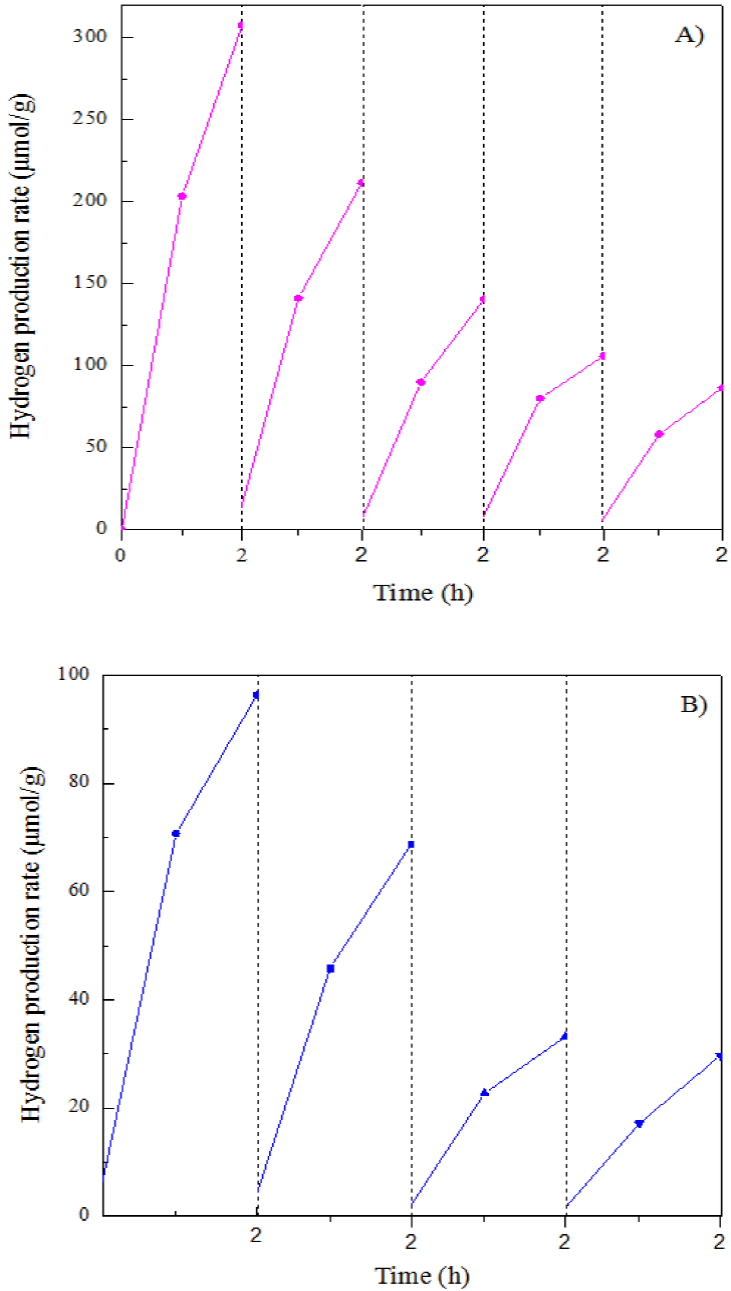
Figure 12 Comparison of H2 production amount obtained in the first 2h of reaction in various reaction cycles. (A) CuO@TiO2; (B) NiO@TiO2.
For photoreaction, it is widely recognized that some electron (e-) - hole (h+) pairs can be created in the surface of the activated TiO2* induced by UV-vis light irradiation (Eq. 2). In our core-shell catalysts, taking CuO@TiO2 as example, there exists a certain amount of Cu1+ ions in the surface of catalyst shell, probably resulted from the electron transfer from TiO2 or hydroxyls to Cu2+ in the shell structure. Therefore, it is possible to generate Cu2+/Cu1+ couples via Cu2+ capturing an electron to convert to Cu+ (Eq. 3) or via a hole (h+) trapping Cu+ and converting to Cu2+ (Eq. 4). When oxygen is present in the surface of catalyst, oxygen can be reduced to superoxide radical anion (O2 •−) or hydrogen peroxide (H2O2) by capturing photo-generated electrons on the surface of TiO2 (Eqs.5 and 6). These new formed intermediates can react to form hydroxyl radical (OH•) (Eq. 7).
From the semiconductor heterojunction point of view, a heterojunction structure may be formed in the interface of TiO2 shell and CuO core of the CuO@TiO2 catalyst (Wang et al., 2014). When the catalyst was initiated by photons with energy higher than or equal to the band gaps, the photo-initiated electron-hole pairs can be quickly separated: the electrons in the conduct band (CB) of TiO2 in shell may automatically flow to the CB band of CuO core under the effect of the electronic field in the heterojunction irradiated by solar light because the conduction band of CuO (0.96 eV) lies lower than that of TiO2 (−0.45 eV) (Lei et al., 2016; Xu & Sun, 2009); meanwhile, the positively charged holes in the valance band (VB) of CuO may move to the VB of TiO2. Therefore, the recombination of the photogenerated electrons and holes are partially inhibited. The accumulation of excess electrons in the conduction band of CuO results in a negative shift in the Fermi level of CuO to give the required energy for efficient reduction of protons (H+) or water, benefiting H2 generation. On the surface of TiO2 shell, the positively charged holes may participate in the formation of CO2 from decomposition and reforming of adsorbed glycerol molecule. Under simulated solar light irradiation, TiO2 carrying on electrons and holes collaborating with Cu2+/Cu+ red-ox couples builds a bridge for charge transfer, and prolonged the lifetime of holes and electrons by effectively inhibition their recombination rate. All those favor the photo efficiency enhancement of hydrogen production rate. The proposed photo-enhanced chemical reaction cycles on the surface of the hybrid core-shell structure is shown in Fig. 13.
4. Conclusions
It has been possible to synthesize CuO@TiO2 and NiO@TiO2 core-shell catalysts through the combination of a modified sol-gel and a precipitation-deposition method where hydroxypropyl cellulose was used as metal ion linker. The obtained photocatalysts had uniform spherical particles with an average crystallite size 40~50 nm. The CuO@TiO2 core-shell catalyst was very active for hydrogen evolution by catalyzing the glycerol-water reforming reaction under solar light irradiation. Hydrogen evolution rate was as high as 153.8 μmol·g−1h-1 using CuO@TiO2 core-shell catalyst, which is 29.0, 24.8, 11.2 and 3.2 times greater than that obtained on the CuO@NiO, NiO@CuO, TiO2 P25, and NiO@TiO2 catalysts, respectively. A higher photocatalytic activity obtained with the CuO@TiO2 core-shell catalyst was explained in terms of electron transferring from photoexcitated TiO2 to the conduction band of CuO in the heterojunction structure in the interface of between TiO2 shell and CuO core, that results in the ox-red cycles among Cu2+/Cu+ couples in the TiO2 shell, this inhibits electrons-holes pair recombination and thus improves the hydrogen production activity.


 nueva página del texto (beta)


