1. Introduction
Concrete is a brittle material; the mechanical behavior of concrete structures is influenced by concrete cracks and how they spread. Considering concrete’s weakness in tension, tensile cracks form because of the applied tensions or even the surrounding conditions. Therefore, in addition to the main steel bars used for many years to reinforce concrete, fibers dispersed randomly in the concrete to improve its behavior have become popular in recent years. These fibers are of different types, with steel ones being a highly important and applicable type. Fiber-reinforced concrete (FRC) is most common in tunnel lining, floors of industrial buildings, and other applications (Abdi et al., 2008; Ghoddousi et al., 2010; Mobasher & Shah 1989; Mobasher & Li, 1996; Victor, 2001).
Studying the conditions of cracks and their growth in concrete structures is of great importance. Thus some researchers paid attention to the concrete cracking and its fracture tests. As a reality a description of the processes of initiation and propagation of cracks in material requires the knowledge of fracture mechanics parameters (Golewski 2019a; 2020; Golewski & Sadowski, 2016). Each crack begins with a microcrack and grows, like a living being, either rapidly, such as during an earthquake, or gradually over some years. Even cracks that cause a quick structure failure initially start with a microcrack. Furthermore, crack growth is a continuous process meaning that an invisible microcrack gradually becomes a large crack capable of destroying a large structure. This is why studying microcracks and concrete microstructure is quite vital. The later a microcrack occurs or the sooner its growth is prevented, the later will large cracks occur. Many researchers believe that early cracks occur in concrete where aggregates and cement paste meet (Adili et al., 2014; Diamond & Huang, 2001). In fact, aggregates are separated from the cement paste before they break. A zone 30_50 µm from aggregates is called the interfacial transition zone (ITZ; see Fig. 1) where most microcracks occur, and effort must be made to postpone cement paste-aggregate separation. Fig. 2 shows a crack in the ITZ, where use of scanning electron microscope (SEM) is required to see it because it is quite small. SEM can provide highly precise magnified images of concrete details by scanning the specimen surface. Fig. 3 shows an ITZ view in different size.
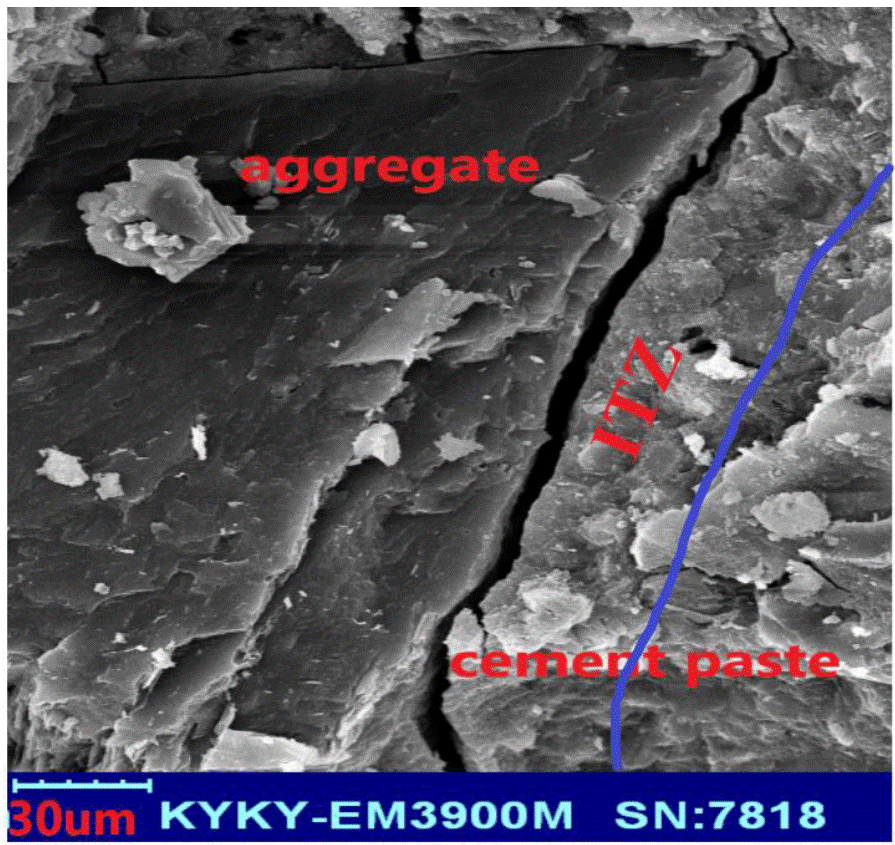
Figure 1 image of the critical ITZ; the left part shows aggregate and the rest shows cement paste; the ITZ boundary is marked with a line.
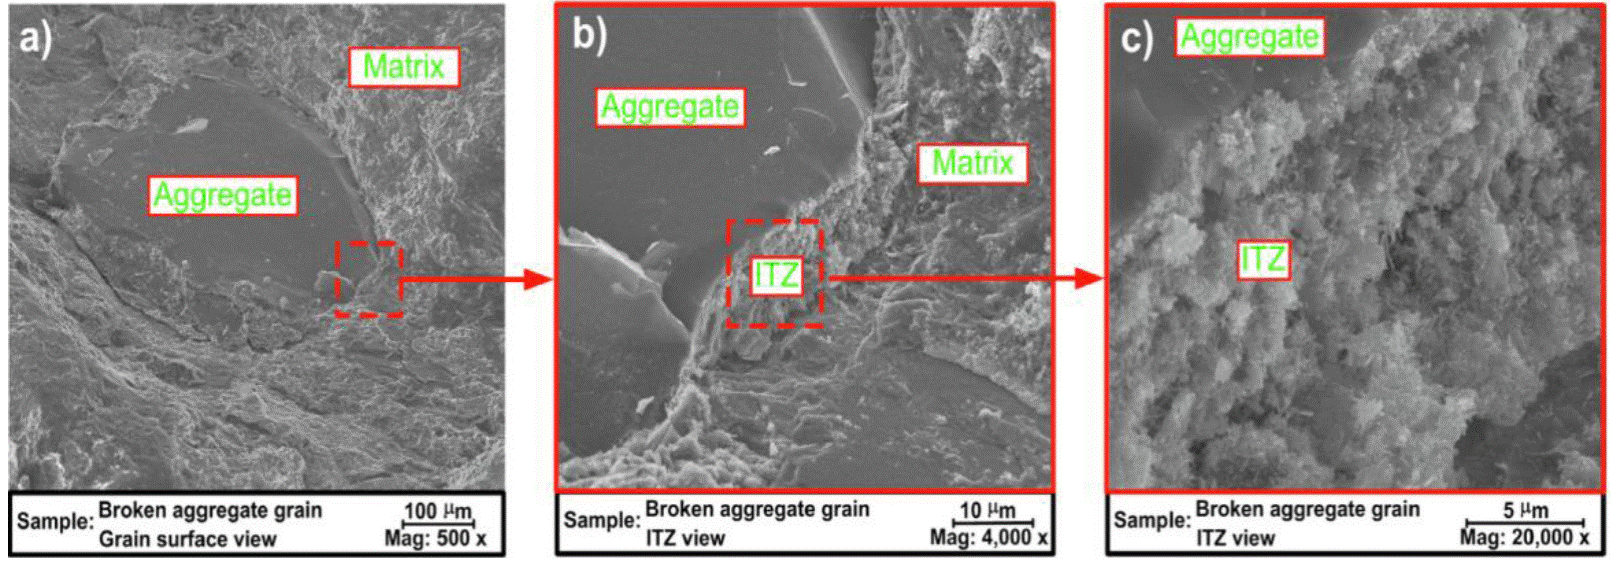
Figure. 3 A view of broken aggregate grain: a) grain surface view; Mag: 500x, b) ITZ view; Mag: 4000x, c) ITZ view; Mag: 20000x (Golewski, 2019b).
Another issue in steel FRC (SFRC) is that an ITZ will exist around the steel fibers where the concrete will probably separate from the steel fibers before its failure. This research presents a new concept called fiber ITZ (FITZ), a strip 30 µm wide around the fibers, to study microcracks between fibers and concrete; this zone is more sensitive and its investigation in FRC is highly important. In fact, the fiber-concrete separation will occur and many cracks are formed in the FITZ before the concrete fails or fibers disappear; this research studied the cracks formed in this zone. In the lab program, concrete specimens were made with hooked and twisted steel fibers, the FITZ crack images were examined for both of them, and their cracking pattern was observed. Fig. 4 shows a schematic view of the FITZ around the steel fibers.
2. Experimental process
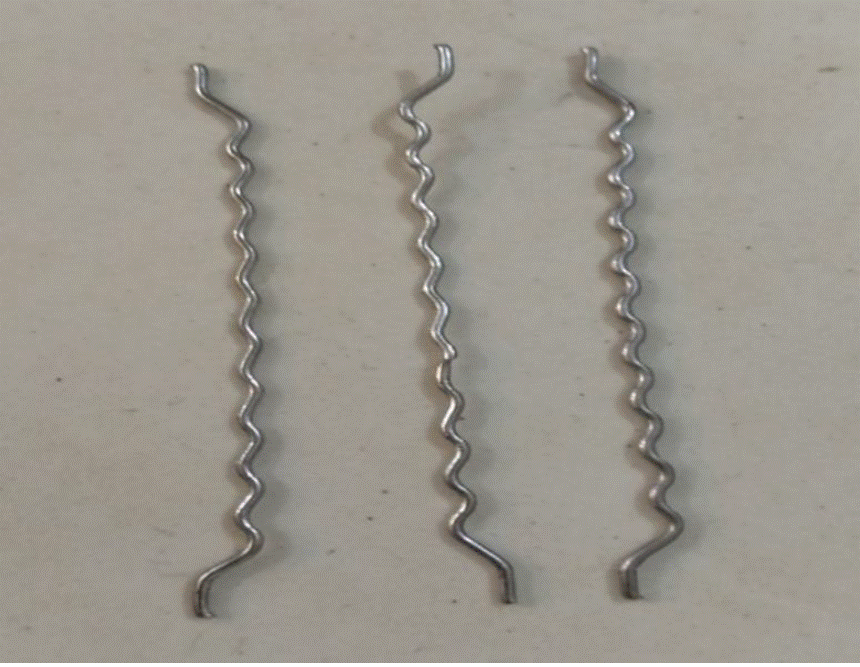
To study cracks in the FITZ around steel fibers, 15-cm concrete cube specimens containing steel fibers were made, and their cracking patterns were studied by SEM. To compare cracks in the ITZ with those in the FITZ, concrete specimens with and without steel fibers were made. Hooked and twisted steel fibers (Figs. 5 and 6, respectively) of 1, 3, and 5% by weight (for both cases) and a tensile strength of 1050 MPa were used in the concrete mix. Table 1 shows the specifications of the steel fibers, and Tables 2, 3 show the concrete mix design and cement analysis respectively.
Table 2 Concrete mix design.
| Material | Quantity (kg/m3) | Proportion |
| Cement | 400 | 1 |
| Fine aggregate | 610 | 1.525 |
| Coarse aggregate | 1170 | 2.925 |
| Water | 200 | 0.5 |
Table 3 Cement chemical and physical properties.
| DOC NO. FR221800 | CEMENT of TYPE II | ||
| Portland Cement | According To: | ||
| ISIRI: II (Moderate Sulfate Resistance) | ISIRI 389 | ||
| EN: CEM I 42.5 N | BS EN 197-1 | ||
| ASTM: II (Moderate Sulfate Resistance) | ASTM C150-11 | ||
| Chemical Analysis | Chemical Requirements | ||
| %SiO2 | 21.47 ± 0.28 | Min 20.0 | |
| %Al2O3 | 5.4 ± 0.11 | Max 6.0 | |
| %Fe2O3 | 3.82±0.14 | Max 6.0 | |
| %CaO | 62.52±0.32 | - | |
| %MgO | 1.31±0.24 | Max 5.0 | |
| %SO3 | 2.88±0.40 | Max 3.0 | |
| %Na2O | 0.65±0.05 | - | |
| %K2O | 0.43±0.03 | - | |
| %L.O.I | 1.52±0.22 | Max 3.0 | |
| %I.R | 0.72±0.01 | Max 0.75 | |
| %C3S | 41.33±2.48 | - | |
| %C2S | 30.02±2.47 | - | |
| %C3A | 7.84±0.12 | Max 8.0 | |
| %C4AF | 11.6±0.40 | - | |
| %F.CaO | 1.49±0.35 | - | |
| Physical Tests | Physical Requirements | ||
| Blaine (cm2/g) | 3110 | Min 2800 | |
| Setting Time (min) | Initial | 183 | Min 45 |
| Final | 238 | Max 360 | |
| Autoclave Exp% | 0.08 | Max 0.8 | |
| Comp. Streng (kg/cm2) | 2 Days | - | - |
| 3 Days | 265 | Min 100 | |
| 7 Days | 344 | Min 175 | |
| 28 Days | 451 | Min 315 | |
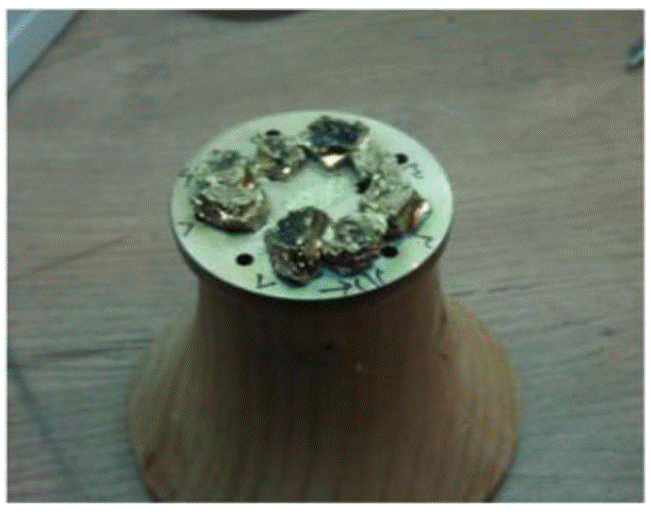
SEM has been used to study cracks and microcracks in conventional and fiber-reinforced concrete. This microscope, also used by some researchers to study the microstructure of concrete and its constituent materials (Delannoy et al., 2018; Faleschini et al., 2015; Feiteira et al., 2017; Huiskes et al., 2016; Khankhaje et al., 2016; Santamaría et al., 2017), does not use an optical method to observe cracks; it rather radiates an electron beam on the surface of the concrete specimen and scans it. The sample were taken from the right side of concrete specimens, because for imaging by SEM at least one side of sample should be flat and then they were covered with gold in this research to ensure that the surface is scanned well (Fig. 7).
SEM presents two major types of images from the object surface; in the first, called the back-scattered electron (BSE) image, the image is detected by the electrons returned from the object surface and shows the different materials used in the target specimen; in the second, called the secondary electron (SE) image, after a radiated electron strikes the surface and replaces an electron on it, the separated electron is detected. Because SE images help one view the contours and cracks on the specimen surface, this study made use of the SE device to study the cracks. A point worth mentioning is that SEM imaging depends strongly on its operator; only an skilled operator can take proper images of the specimen surface. The SEM device used in this study (Fig. 8) belongs to the University of Sistan and Baluchestan (zahedan, Islamic Republic of Iran). Although some researchers have investigated the crack forms in FRC (Berrocal et al., 2016; Hemmati et al., 2016; 2015; 2014; Pyo et al., 2016), observation of micro cracks in this kind of concrete is probably carried out for first time in this work. This research first located the steel fibers in the specimen and then captured images of the FITZ cracks.
3- Results and discussion
After imaging of the cracks in the FITZ in the FRC with hooked and twisted fibers was complete, the images were compared with those of the cracks in the ITZ of conventional concrete. Fig. 9 shows one hooked steel fiber uniformly separated from the concrete. This crack, with a uniform lengthwise thickness, lies totally in the FITZ and shows the concrete-fiber detachment throughout the fiber length.
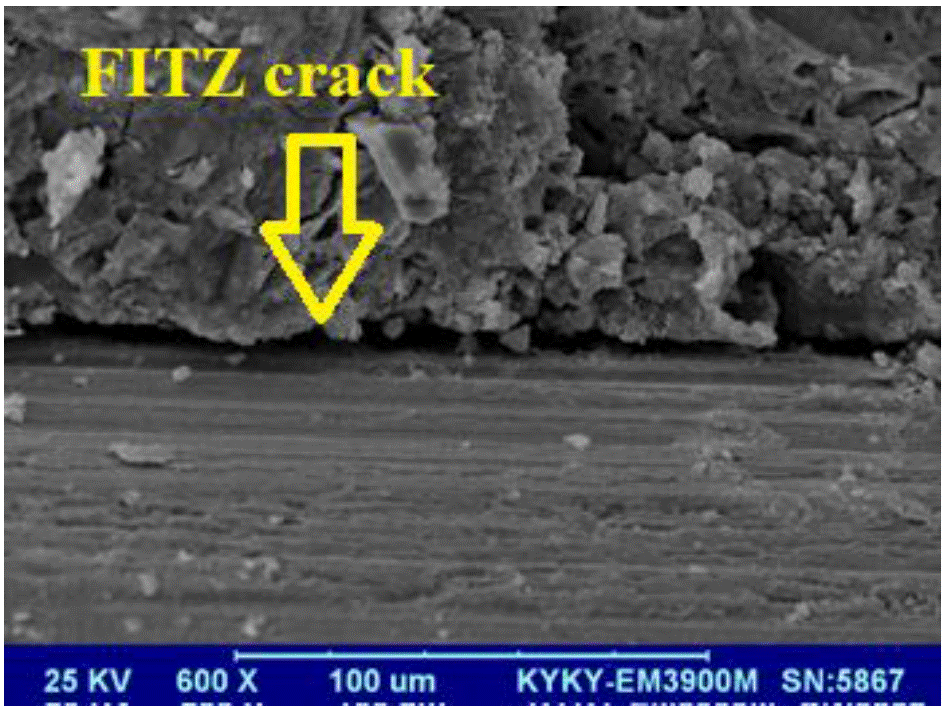
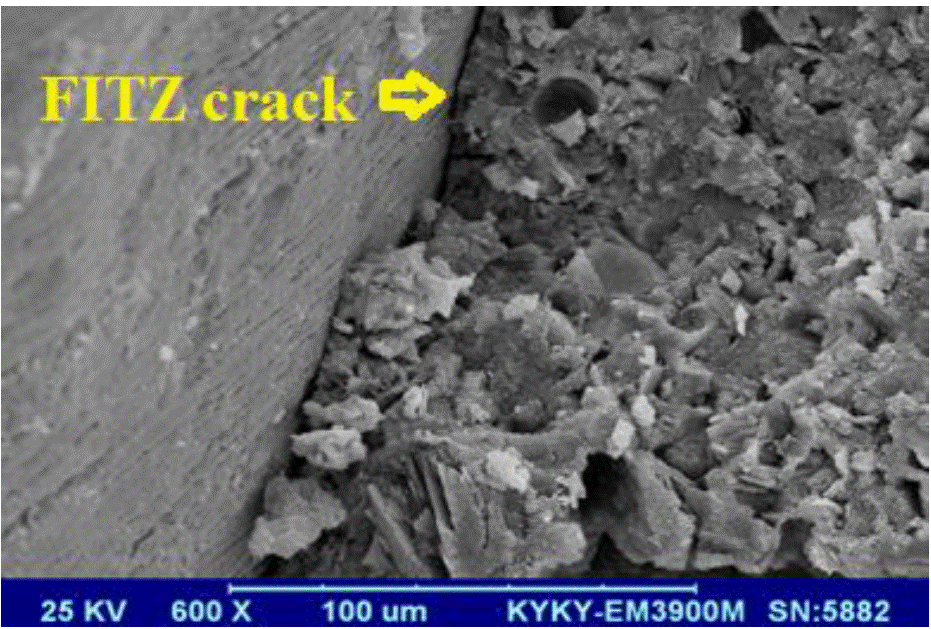
Fig. 9 shows the same crack more precisely (almost twice the magnification). A point worth noting is that the cracks in the FITZ are more numerous, longer, and more extended than those in the ITZ. As shown, most cracks have formed around the steel fibers rather than in the middle of the concrete between aggregates. Fig. 11 shows a more precise image of another crack in the FITZ; here, the uniform lower part shows the steel fiber and the upper part shows the concrete. Although concrete shows its pores and porosity, full steel detachment is quite noticeable. The longest crack in Fig. 11 is the one between the concrete and steel fiber. Fig. 12 shows another crack in the FITZ for a hooked steel fiber; as shown, the full concrete-steel fiber separation is quite evident. In this image crack path is a straight line and along the hook steel fiber.
When twisted steel fibers are used in concrete, the attachment of the two is stronger and lengthy cracks are not formed along fibers; rather, finer, less risky cracks are formed around the fibers in the FITZ because of the fibers’ spiral shape. A microcrack in the FITZ of a twisted fiber is shown in Fig. 13, with the same magnification of Fig. 7, showing a crack in the FITZ; even the fiber curvature is visible in the figure. As shown, the concrete-fiber connection is better than that in Fig. 9. In the latter, the crack formed along the fiber is longitudinal, but in Fig. 13, it has a curved path looped around the fiber and is clearly smaller in size. Fig. 14 also shows the lower part of the same crack from a closer view, because it is larger and more critical. Compared to Fig. 10 (with the same magnification), it is obvious that the concrete-fiber bond is grater and the crack is thinner; Fig. 10 shows complete fiber-concrete detachment whereas the crack in Fig. 14 is bonded with the concrete in many places.
Fig. 15 shows the same crack in Fig. 13 with the magnification of Fig. 11 (almost 600 times); as shown, the FITZ has a crack smaller than that in Fig. 11. Here, the full detachment of Fig. 11 is not seen in the FITZ and twisted fibers are still attached to the concretein many places. At points where there are cracks and concrete-fiber detachment, the crack diameter is small. Again, an important point is the oblique crack growth around fibers and not longitudinal detachment along them (as in Fig. 11).
By comparing these FITZ images with those in Fig. 2 taken from the ITZ of a fibreless specimen, it is observed that the FITZ cracks, for both hooked and twisted steel fibers, have not often grown perpendicular to the fibers and are not, in fact, drawn into the concrete space. However for the ITZ, the crack shown in Fig. 2 deviates into the concrete and its growth can be immediately connected to other ITZ cracks, creating a chain that can finally cause early concrete failure. With regard to concrete with hooked fibers (Figs. 9, 10, and 11), there is still a slight crack deviation into the concrete. In Fig. 9, it is observable that the main FITZ crack is along the hook steel fiber, furthermore some cracks are detached from the main ITZ crack in the vertical direction, the details of which are clearer in Figs. 10 and 11. However, such cracks are almost invisible for twisted fibers (Figs. 13, 14, and 15), leading to the conclusion that, for concrete with twisted steel fibers, the crack propagation from around the twisted fibers into concrete, their joining together, and formation of a chain either does not occur or does so much later compared with fibreless concrete or FRC with hooked steel fibers.
Figures 16 and 17 show the FITZ cracks in concrete with hooked and twisted steel fibers, respectively, for comparison with images that are less magnified and thus depict more steel fibers, showing the FITZ more generally.
A comparison of Figs. 16 and 17, with the same magnification, shows the obvious coherence of concrete and hooked and twisted fibers. Fig. 16 shows a deep continuous crack in the FITZ along the fiber with no concrete-fiber connection point, whereas the twisted fiber in Fig. 17 is fully covered with the cement paste; where there is separation, it is not continuous (it is cut), meaning that there are many points in the FITZ crack length where fibers have stuck to the concrete; the crack/detachment width is also clearly greater for hooked fibers. The main difference between FITZ cracks for hook and twisted steel fibers is crack path. Most of hook FITZ cracks are straight ones along the fiber, but twisted FITZ cracks has spiral path around the steel fibers.
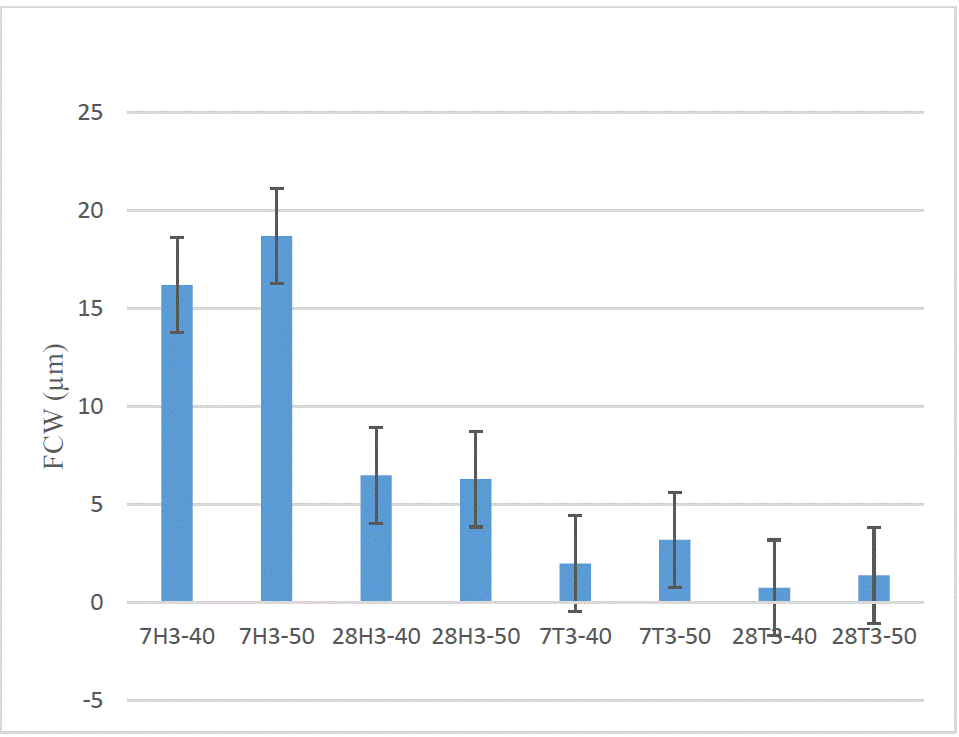
Table 4 shows the details of the specimens and the FITZ crack widths (FCW). As shown, there are four control specimens; in the name of each control specimen, the first number shows its age, the letter W means it is a control specimen, and the last number shows its W/C ratio. In other specimens, the first number shows the age and the next letter indicates the fiber type (H for hooked and T for twisted). The next number shows the percent of fiber (1, 3, and 5%), and the number after the hyphen, indicates the percent W/C. Table 3 also shows the compressive strength and the FITZ crack. Because of high costs, SEM imaging, and hence FCW measurement, was performed only for specimens with 3% fiber. According to this table, the crack width in specimens with twisted steel fibers is reduced significantly (by a factor of almost 7) which can be attributed to an increase in the fiber-concrete contact surface and their improved adhesion. Cracks in specimens with twisted steel fibers are not linear; they have a spiral form twisting around the fibers (Fig. 13). Another point worth noting is the specimen’s age effect on the crack width; the crack width is reduced with increased age and consequently increased adhesion. As shown in Table 4, this reduction is observable for both hooked and twisted fibers, and the W/C reduction has a smaller effect. Because all microcracks are in the FITZ, this concept can be used well to study cracks in SFRC. The pattern of the FITZ cracks can be studied and justified; as all the previous images show, the cracking between the steel fibers and the concrete in the FITZ is always a significant one, and is often larger than those forming in the concrete itself around the steel fibers; therefore, the new FITZ concept is well suited for studying the SFRC cracking situation.
Table 4 Details of specimens and cracks widths in (FCW) FITZ.
| Group | Specimen | Age (days) | W/C ratio | Fiber type | Fiber percentage | Compressive strength (MPa) | FITZ crack width (FCW) |
| Witness specimen | 7W40 | 7 | 0.4 | --- | ---- | 15.5 | ---- |
| 7W50 | 7 | 0.5 | --- | ---- | 14.0 | ---- | |
| 28W40 | 28 | 0.4 | --- | ---- | 26.2 | ---- | |
| 28W50 | 28 | 0.5 | --- | ---- | 23.9 | ---- | |
| With hook steel fiber | 7H1-40 | 7 | 0.4 | hook | 1% | 15.2 | Not measured |
| 7H3-40 | 7 | 0.4 | hook | 3% | 17.8 | 16.2µm | |
| 7H5-40 | 7 | 0.4 | hook | 5% | 16.9 | Not measured | |
| 7H1-50 | 7 | 0.5 | hook | 1% | 14.5 | Not measured | |
| 7H3-50 | 7 | 0.5 | hook | 3% | 16.6 | 18.7µm | |
| 7H5-50 | 7 | 0.5 | hook | 5% | 15.8 | Not measured | |
| 28H1-40 | 28 | 0.4 | hook | 1% | 27.5 | Not measured | |
| 28H3-40 | 28 | 0.4 | hook | 3% | 31.4 | 6.5µm | |
| 28H5-40 | 28 | 0.4 | hook | 5% | 32.0 | Not measured | |
| 28H1-50 | 28 | 0.5 | hook | 1% | 23.6 | Not measured | |
| 28H3-50 | 28 | 0.5 | hook | 3% | 28.5 | 6.3 | |
| 28H5-50 | 28 | 0.5 | hook | 5% | 27.4 | Not measured | |
| With twisted steel fiber | 7T1-40 | 7 | 0.4 | twisted | 1% | 16.3 | Not measured |
| 7T3-40 | 7 | 0.4 | twisted | 3% | 18.5 | 2.0 | |
| 7T5-40 | 7 | 0.4 | twisted | 5% | 15.7 | Not measured | |
| 7T1-50 | 7 | 0.5 | twisted | 1% | 14.6 | Not measured | |
| 7T3-50 | 7 | 0.5 | twisted | 3% | 17.2 | 3.2 | |
| 7T5-50 | 7 | 0.5 | twisted | 5% | 16.5 | Not measured | |
| 28T1-40 | 28 | 0.4 | twisted | 1% | 28.2 | Not measured | |
| 28T3-40 | 28 | 0.4 | twisted | 3% | 33.5 | 0.77 | |
| 28T5-40 | 28 | 0.4 | twisted | 5% | 34.1 | Not measured | |
| 28T1-50 | 28 | 0.5 | twisted | 1% | 22.7 | Not measured | |
| 28T3-50 | 28 | 0.5 | twisted | 3% | 29.9 | 1.4 | |
| 28T5-50 | 28 | 0.5 | twisted | 5% | 30.3 | Not measured |
It is worth noting that the crack dimensions were estimated and calculated using the three-point average method.
In fact, each crack in the ITZ zone starts in one place and its thickness becomes constant after developing over a distance. The crack width remains unchanged along a certain length and then it is separated from the aggregate and is mainly drawn into the matrix. Here, the area in which the crack had a fixed width was identified on the SEM device during imaging. Afterward, the average crack width at the beginning (X1), middle (X2), and ending (X3) points of the area was calculated. Finally, the resulting average value was introduced as the crack width. This measurement was carried out using a software solution connected to the SEM device. Figure 18 presents an instance of the crack width estimation. In fact, after point x1, the crack opens into the matrix and it is no longer considered a uniform crack adjacent to the aggregate.
Comparing the FITZ cracks shows noticeable differences between hook and twisted fibers (Fig. 19). The size of FITZ cracks in twisted fibers specimens is much less than hook ones. Age of the concrete has effect on its micro cracks. By increasing the age of the concrete and completing the hydration, smaller ITZ and FITZ cracks are found. This is the same condition for hook and twisted fibers. It is probable that aged concrete has better coherence with fibers.
The materials such as steel fibers are available in all places and there was not funding on the research. The authors were research investors.
4. Conclusions
The analysis of steel fiber reinforced concrete microstructure in the ITZ area were aimed to determine the effect of steel fibers shape (hook or twisted) on vicinity to the steel fibers, evaluated at the level of microscale.
A Scanning Electron Microscope was used to investigate the microcracks width at the contact between the steel fibers and matrix. Based on the microstructure analysis of the concrete zones taken from the areas located close to the steel fibers, it can be concluded that:
1)As all images show, the cracking between the steel fibers and the concrete in the Fiber Interfacial Transition Zone (FITZ) is always a significant one, and is often larger than those forming in the concrete itself around the steel fibers; therefore, the new FITZ concept is well suited for studying the SFRC cracking situation.
2)The crack width is reduced with increased age and consequently increased adhesion. As shown in Table 4, this reduction is observable for both hooked and twisted fibers, and the W/C reduction has a smaller effect.
3) Twisted steel fibers have better cohesion with concrete than hook steel fibers. FITZ cracks are smaller (about 7 times) in vicinity of twisted steel fibers. Thus the specimens with twisted steel fibers showed more compressive strength.
4) FITZ is a very important zone in the concrete behavior. Most of times the structural fracture is because of concrete and fibers separation. Thus fiber interfacial transition zone (about 30µm around fiber) has an important role in FRC behavior.
5) As shown in the images, FITZ microcracks around twisted steel fibers are in spiral shape which is basically different from linear FITZ cracks of hook steel fibers that are along the fiber.
6) The best specimen from the viewpoint of micro cracking, and the most coherent one which had the smallest FITZ cracks is 28T3-40; a 28 days concrete with twisted steel fibers and W/C ratio of 0.4.


 nueva página del texto (beta)


