1. Introduction
Bentonite is an abundant natural resource in Indonesia, but its utilization has not been optimal. Bentonite is a layered silicate clay mineral consists of Montmorillonite with a d value of about 1 nm. It can be incorporated or Intercalated with many guest species, thus providing a wide range of possibilities for its wide application in composites (Wang et al., 2014). Bentonite has hydrophilic properties, so it is not compatible with most polymer materials. Therefore, chemical modifications must be carried out to make the surface more hydrophobic. (Fisli & Yusuf, 2010; Ginting et al., 2017; Rabiatul et al., 2020). Acid washing with various solutions, including HCl, H2SO4 and HNO3 (Abeywardena et al., 2017; Sirait et al., 2018, 2017) and intercalation with cationic surfactants are useful for modifying bentonite. One of the cationic surfactants is CTAB (cetyltrimethylammonium bromide) or HDTMA (Hexadecyltrimethyl ammonium bromide). Activation with acid has two effects: first is removing exchangeable cations such as Na+ and Ca2+ with protons from the activating acid, and the second is removing cations such as Al3+ (dealumination), Mg2+ and Fe2+.(Ogunlaja & Pal, 2020).
Bentonite is currently studied as a nanofiller in nanocomposites (Bukit & Frida, 2013; Ginting et al., 2017; Majid et al., 2020). The addition of bentonite as a nanofiller can improve the properties of thermal resistance, mechanical properties, chemical resistance and flammability of nanocomposites (Sirait et al., 2017, 2018; Rihayat et al., 2019).
Nanofillers will tend to form agglomerations when inserted into the polymer matrix. Therefore, the incorporation of nanofillers is required to integrate different functional groups, which facilitates homogeneous dispersion. Silica nanoparticles are the most preferred nanofillers over metal and metal oxide nanoparticles as a reinforcing phase in advanced composite materials. (Alexandre & Dubois, 2000; Karnati et al., 2020). Previous studies have carried out the incorporation of bentonite and silica nanoparticles. The addition of nano bentonite/nano-silica to the Phenol novolac epoxy resin overcomes the resin's structural brittleness and improves mechanical properties (Ahmadi, 2020). Furthermore, the super-tough properties of Hydrogel with the addition of Bentonite/SiO2 nanocomposite (Yu et al., 2018)
Plantation waste such as Oil Palm Boiler Ash (OPBA) contains silica. OPBA is biomass with silica content that has the potential to be utilized. The content of OPBA consists of SiO2, Al2O3, Fe2O3. (Bukit et al., 2019; Ginting, Bukit, Frida, et al., 2020). Currently, the use of OPBA is not optimal, where most of the OPBA waste causes many environmental problems (Hamada et al., 2018). The original OPBA has a large particle size with a porous texture. The crushing and grinding process will obtain smaller OPBA particles. In addition, the grinding process will increase the fineness of OPBA particles and specific gravity. OPBA applications in previous studies include adsorbent, filler, pozzolan, mortar, and cement paste (Bukit et al., 2020 Bukit et al., 2018; Ginting et al., 2018; Ginting, Bukit, Motlan, et al., 2020; Ismail et al., 2015; Saba et al., 2015).
Ball mill, coprecipitation, and addition of CTAB surfactant are methods used in bentonite preparation. While the extraction of silica from OPBA through the ball mill and coprecipitation process. Furthermore, the incorporation of palm oil boiler ash into bentonite was carried out using the facile method.
2. Materials and methods
The materials used for this study are sodium bentonite, OPBA from PT. DPI (Dhajaja Putra Indonesia) Asahan District North Sumatra Indonesia, 7M HCl, 7M NaOH, NH4OH Merck Pro Analis, CTAB from Himedia AR Grade.
2.1. Synthesis of bentonite nanoparticle
Bentonite was calcined at 700oC for 5 hours and milled with a Planetary Ball Mill type ball mill for 10 hours. Then, bentonite was synthesized by the coprecipitation method using 7M HCl as a solvent and 7M NaOH as a precipitate. Bentonite was modified by adding CTAB. CTAB solution and bentonite dispersion were mixed at 70oC for 3 hours and then filtered. The mixture was then dried in an oven at 150oC for 2 hours. The schematic of the nano bentonite synthesis is shown in Figure 1.
2.2. Synthesis of OPBA nanoparticle
OPBA obtained from palm oil mill waste was dried in an oven for 2 hours at a temperature of 250oC. Furthermore, OPBA was calcined and ground with a ball mill type Planetary Ball Mill type Retsch PM200 for 10 hours with a rotation of 250 rpm. Coprecipitation was carried out using 7M HCl as a solvent and NH4OH as a precipitate. OPBA was washed with distilled water to produce a neutral pH. Then, it was dried in an oven at a temperature of 230oC for 2 hours. The schematic of the synthesis of OPBA Nanoparticles is shown in Figure 2.
2.3. Synthesis of bentonit - OPBA nanocomposite
The nanocomposite synthesis process was carried out by mixing Btbc-CTAB and OPBA-BC and adding 100 ml of absolute ethanol using a stirrer at 70oC for 2 hours. Then filtered and dried at 150oC for 2 hours. Table 1 shows the label of each sample.
Table 1 Sample label.
| Label | Description |
|---|---|
| Btb | Calcined and ball milled bentonite |
| Btbc | Bentonite calcined and ball mill and co-precipitation |
| Btbc-CTAB | Calcined bentonite, ball mill, co-precipitation and modification with CTAB |
| OBBA-B | Calcined and ball milled OPBA |
| OPBA-BC | OPBA calcined, ball mill and co-precipitation |
| Bentonit-OPBA | Bentonite calcined, ball mill, co-precipitation process and modification with CTAB mixed with OPBA calcined and ball mill and co-precipitation. |
3. Result
3.1. X-ray diffraction (XRD) analysis
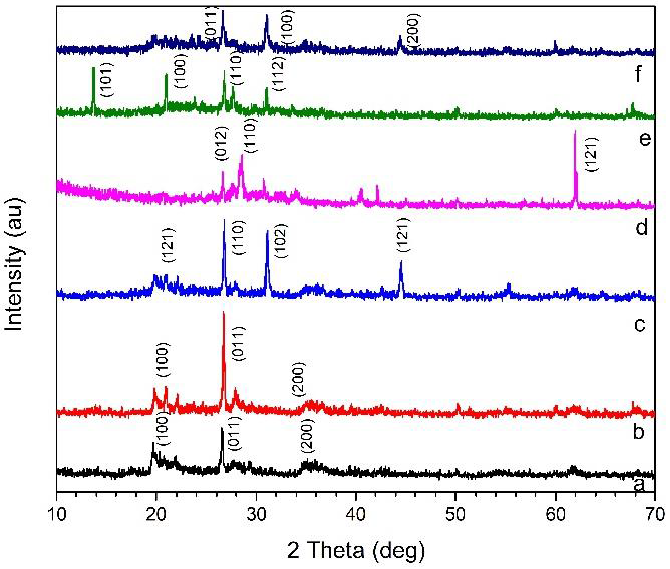
Analysis of X-ray diffraction (XRD) on the sample using a Goniometer type Shimadzu 6000 instrument with a Cu/Kα1 X-ray source with a wavelength, = 1.54056. The analysis was carried out with an angle of 2θ starting from 10o to 70o.The diffractogram is compared with the JCPDS (Joint Committee on Powder Diffraction Standard) database to identify the diffraction pattern of the synthesized material. Figure 3 shows the XRD diffraction pattern of the sample. Meanwhile, Table 3 shows the data on the physical and structural properties of the sample determination of the crystal size of the material using the Scherrer equation:

Figure 3 X-ray diffraction of (a) Btb, (b)Btbc, (c)Btbc-CTAB, (d) OPBA-B, (e) OPBA-BC, (f) Nanocomposite Bentonit-OPBA.
Table 3 XRD Analysis of OPBA and Bentonit Nanoparticles.
| Date | Btb | Btbc | Btbc-CTAB | OPBA-B | OPBA-BC | Nanocomposite Bentonit-OPBA |
|---|---|---|---|---|---|---|
| Crystal system | trigonal (hexagonal axes) |
trigonal (hexagonal axes) |
trigonal (hexagonal axes) |
trigonal (hexagonal axes) |
trigonal (hexagonal axes) |
trigonal (hexagonal axes) |
| Space group | P 32 2 1 (154) |
P 32 2 1 (154) |
P 32 2 1 S | P 32 2 1(154) | P 32 2 1 S | P 31 2 1 (152) |
| Unit cell | a=4.9180 Å c=5.4070 Å |
a=4.9180 Å c=5.4070 Å |
a= 4.9290 Å c= 5.3190 Å |
a= 4.9124 Å c= 5.4039 Å |
a= 4.9180 Å c= 5.4070 Å |
a=4.6764 Å c=5.2475 Å |
| Density | 2.64100 g/cm³ |
2.64100 g/cm³ |
2.675 g/cm³ | 2.6490g/cm³ | 2.643 g/cm³ | 3.01200 g/cm³ |
| 2 theta angle Maximum dhkl Intensity I/I0 Lattice distance d (Å) |
26.43 011 1000 3.3458 |
26.71 011 1000 3.2061 |
26.79 (110) 1000 3.3273 |
61.95 121 1000 1.4965 |
13.67 101 1000 6.4790 |
26.71 011 1000 3.2061 |
| 2 theta angle Maximum dhkl Intensity I/I0 Lattice distance d (Å) |
19.97 100 893.4 4.2591 |
19.97 100 893.4 4.2591 |
31.14 102 997.59 2.8718 |
28.55 012 4902 3.1255 |
20.92 100 798.52 4.2460 |
30.95 100 858.2 4.0499 |
| 2 theta angle Maximum dhkl Intensity I/I0 Lattice distance d (Å) |
35.29 200 484.1 2.1296 |
35.29 200 484.1 2.1296 |
44.50 121 466.48 2.0360 |
26.65 110 2867 3.3440 |
26.74 110 766.94 3.3341 |
44.43 200 527.3 2.0249 |
| 2 theta angle Maximum dhkl Intensity I/I0 Lattice distance d (Å) |
- | - | 19.86 121 249.48 4.4711 |
- | 30.98 112 504.51 2.8862 |
- |
Where D is the crystal size (Ǻ), λ is the X-ray wavelength used with CuK Cu radiation (λ = 1.54056), θ is the Bragg angle, κ is Scherrer's constant has a general value of 0.9 and β is the half-peak width of Full Width at Half Maximum (FWHM) in radians. By using the Scherrer equation and processing data with Origin software, the particle size obtained is shown in Table 2.
Table 2 Nanoparticle size from XRD analysis.
| Sample | D (nm) |
|---|---|
| Btb | 24.79 |
| Btbc | 15.52 |
| Btbc-CTAB | 18.06 |
| OPBA-B | 53.56 |
| OPBA-BC | 34.59 |
| Nanocomposite Bentonit-OPBA | 18.96 |
The increasing of particle size in Btbc-CTAB is due to CTAB acting as an ion exchanger with hydrated cations localized in the bentonite interlayer space and promoted rearrangement of the clay layer. So that, the structure of the material obtained is very regular and sharp reflection peaks. In other words, CTAB has small bentonite particles are assembled into larger particles with an orderly structure because of the relationship between CTAB particles with small negatively charged edges bentonite particles (My Linh et al., 2020). Meanwhile, in Bentonite-OPBA Nanocomposite, there was a decrease in particle size. This decrease shows that bentonite can inhibit the growth of OPBA (Wang et al., 2020). The peak angle Btb, Btbc occurs at an angle of 2θ are 19.97o,26.43o, 35.29o. After modification with CTAB surfactant peak shift occurs, which indicated CTAB had been inserted into the layer of Na-bentonite by ion exchange. Alkylammonium ions intercalated between the layers of raw bentonite resulting in enhanced basal spacing (Andrunik & Bajda, 2019; Yuzhen et al., 2020). Meanwhile, in figures 3d and 3e, the 2θ is around 26.7o. High-intensity peaks were observed, indicating silica content, the main crystalline component in OPBA nanoparticles (Abdullah et al., 2021; Liang et al., 2019).
3.2. Scanning electron microscopy (SEM) analysis
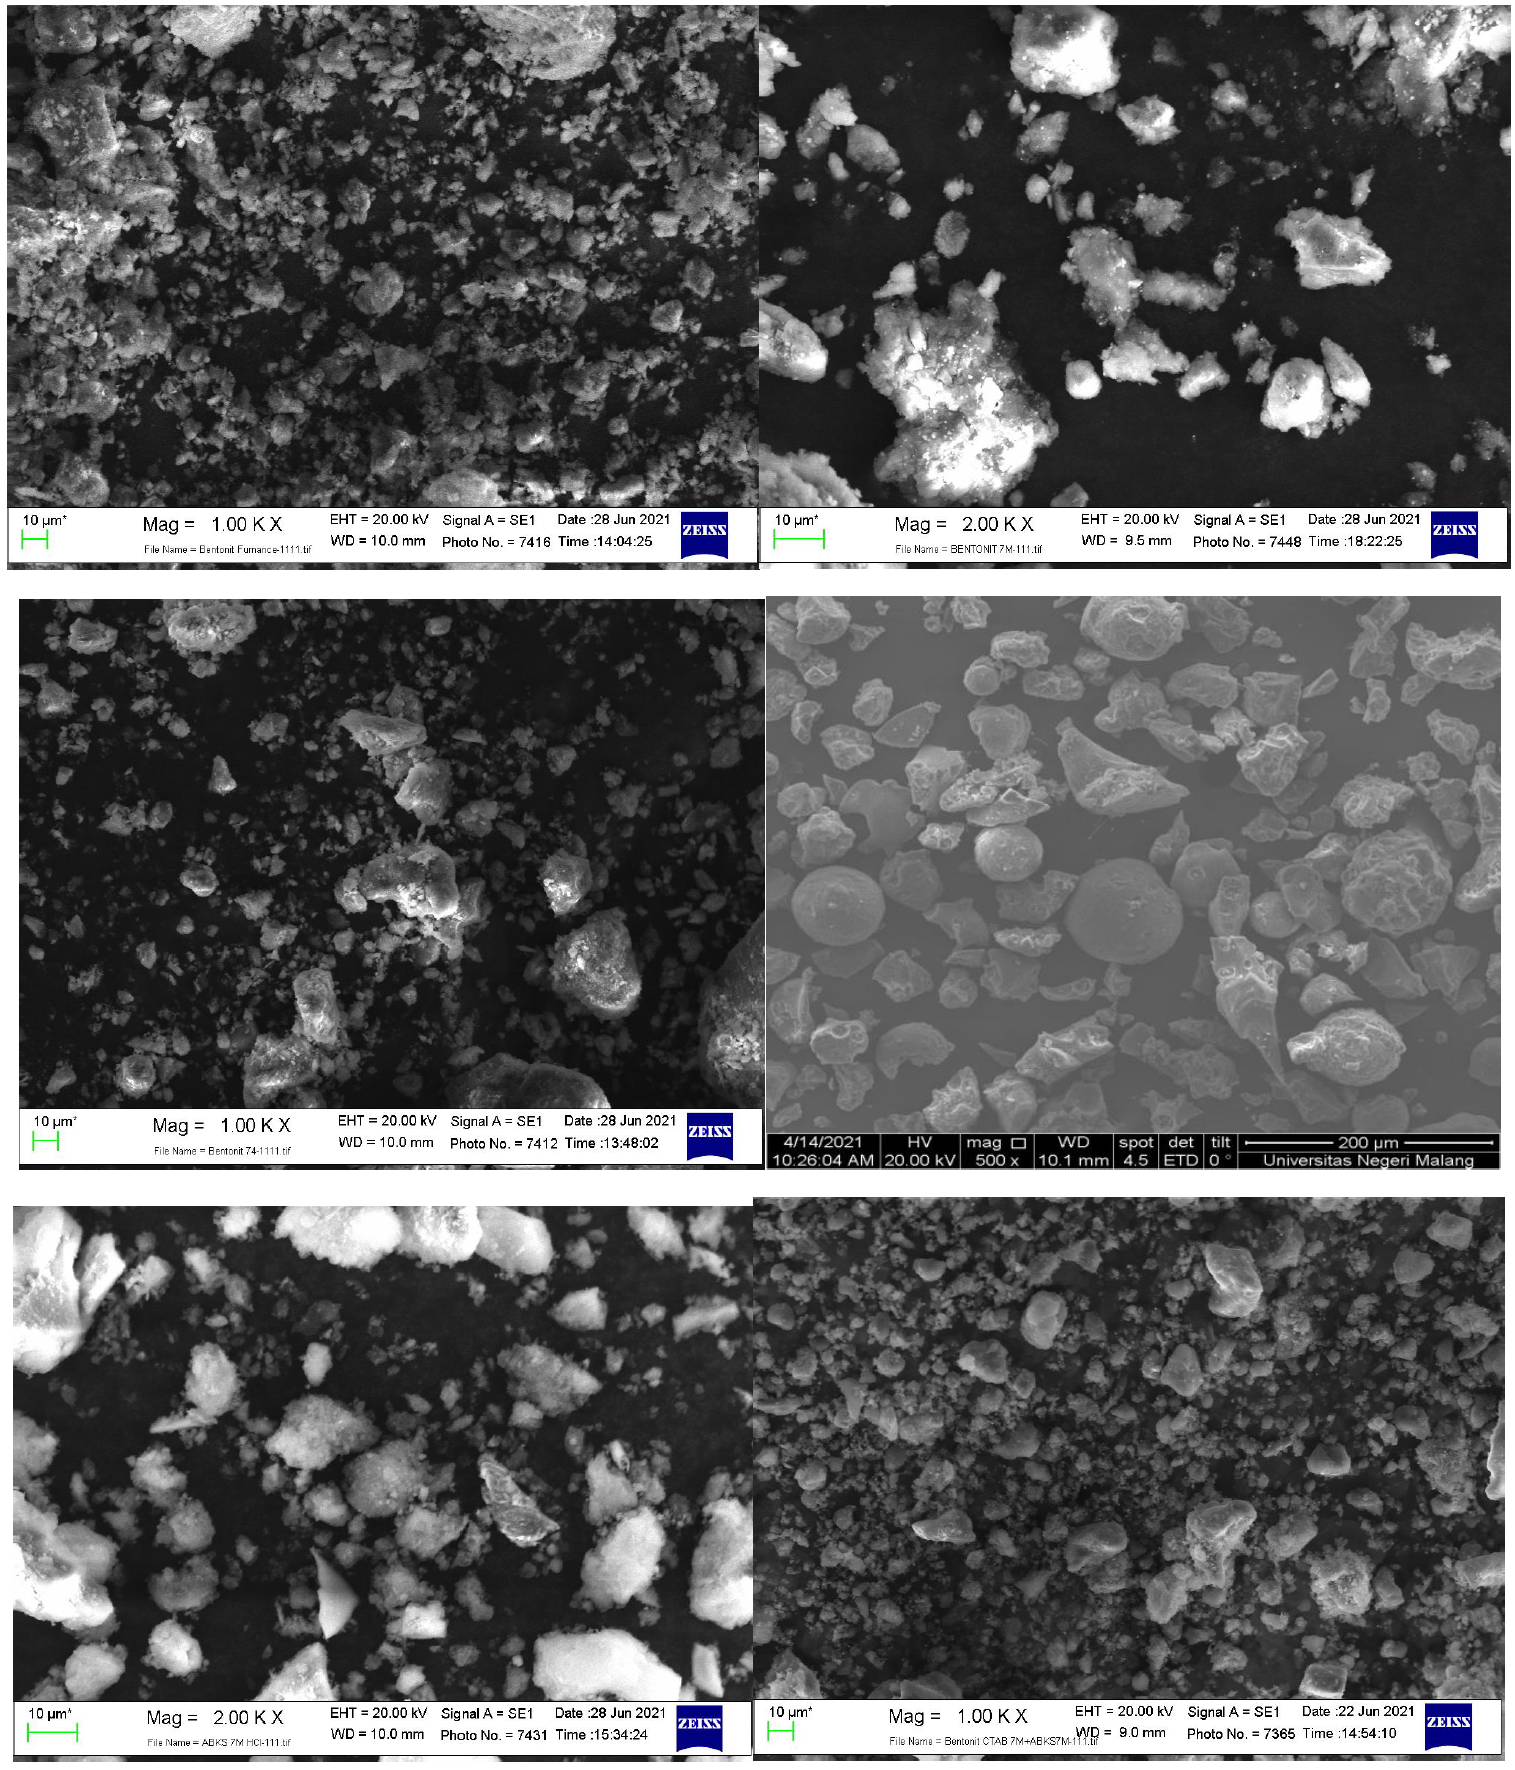
To describe the surface morphology of Bentonite-OPBA, SEM analysis was carried out using the EVO MA 10 Zeiss instrument. SEM of the sample are presented in Figure 4.

Figure 4 Scanning Electron Microscopy of (a) Btb, (b) Btbc, (c) Btbc-CTAB, (d) OPBA-B, (e) OPBA-BC, (f) Nanocomposite Bentonit-OPBA.
Figure 4 show a smooth and irregular appearance, and Btb presents scattered and different sizes beam structures. However, the surface rough modified bentonite morphology and was accompanied by a small number of holes and robust areas (Chen et al., 2020; Justice Babu et al., 2018; Siva et al., 2018). At the same time, SEM image of Btbc-CTAB showing crimp, edges morphology and small pieces of Btb form block structure (Wang et al., 2020). Meanwhile, Figure 4f shows a change in the morphology. Morphology looks more uniform than the other samples. These changes indicate that the synthesis of bentonite-OPBA nanocomposite can produce optimal morphology.
3.3. Fourier transform infrared (FTIR) analysis
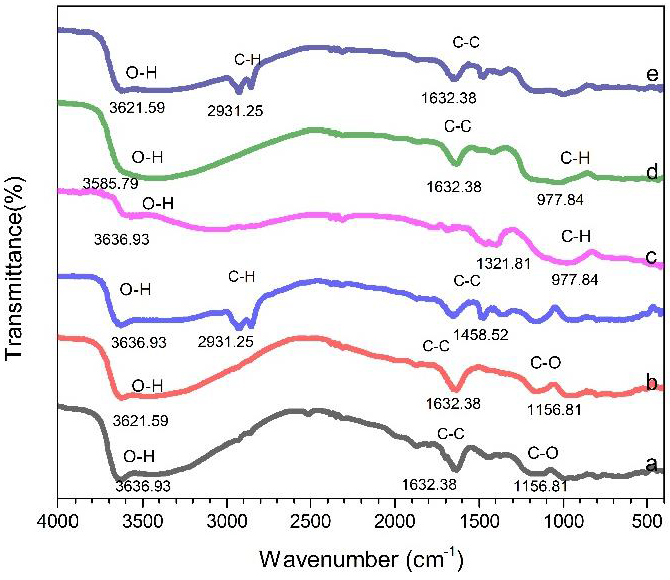
Analysis of functional groups in the sample was carried out using the FTIR Shimadzu model IR-Prestige-21 made in Japan with Resolution = 4.0. Wavenumber range from 500 cm-1 to 4000 cm-1. The FTIR graph is presented in Figure 5.

Figure 5 FTIR Graph of (a) Btb, (b) Btbc, (c) Btbc-CTAB, (d) OPBA-B, (e) OPBA-BC, (f) Nanocomposite Bentonit-OPBA.
From Figures 5a and 5b, it can be seen that the absorption peaks are almost similar. The presence of a Signal peak at 1632.38 cm−1 corresponds to the deformation of H2O (adsorbed between the aluminum-silicate layers). The band at 3630 cm−1 is associated with the stretching of Al-OH (Jenita Rani et al., 2017; Legarto et al., 2019; Shakir et al., 2018).
However, in Figure 5c new absorption peaks appear at 1458.52 and 2931.25. These peaks indicate that the CTAB molecules were intercalated between the bentonite mineral layers and the higher intensity of the characteristic of modified bentonite peaks compared with that in natural bentonite, indicating the organophilic nature of the modified bentonite.
FTIR Showed that CTAB had achieved surface modification of natural bentonite (Ibrahim & Abd Ali, 2020). Figures 5d and 5e show the absorption peak at 977.84. The absorption band at 981.33 cm−1 indicates that the increase in silica strengthening has increased in the polymerization process. In figure 5d, the absorption peak of 2931.25 which is owned by CTAB reappears (Schampera et al., 2016). This peak indicates the success in the synthesis of Bentonite-OPBA nanocomposite.
3.4. X-ray fluorescence (XRF) analysis
The chemical composition was determined by XRF analysis. Table 4 shows SiO2 and Al2O3 as the most common compounds found in Btb, Btbc, Btbc-CTAB, Bentonite-OPBA Nanocomposite (Akl et al., 2013; Dhawale et al., 2018; Zarina et al., 2013). Since the amount of SiO2 and Al2O3 in boiler ash is 49%, this material can be used as a geopolymer.
Table 4 Elements obtained from XRF analysis.
| Compound | Btb (wt%) | Btbc (wt%) |
Btbc- CTAB (wt%) |
OPBA-B (wt%) |
OPBA-BC (wt%) |
Nanocom posite Bentonit- OPBA (wt%) |
|---|---|---|---|---|---|---|
| SiO2 | 59.3 | 60.3 | 54.9 | 32.1 | 49.9 | 53.1 |
| K2O | 1.26 | 1.35 | 0.70 | 34.6 | 5.95 | 3.18 |
| CaO | 6.24 | 4,78 | 3.81 | 20.3 | 22.0 | 10.2 |
| Fe2O3 | 17.0 | 16.2 | 15.0 | 5.93 | 10.3 | 10.2 |
| Al2O3 | 14.0 | 15.0 | 12.0 | - | - | 10.0 |
| TiO2 | 1.37 | 2.13 | 1.91 | 0.32 | 0.58 | 1.28 |
| P2O5 | - | - | - | 3.8 | 8.21 | 3.9 |
| Br | - | - | 10.3 | - | - | 3.7 |
The CaO content was the second-highest that has been reported to affect the mixed properties of the fresh geopolymer and the hardened geopolymer. In addition, the Si/Al ratio plays a vital role in determining geopolymeric applications in industry (Jaarsveld et al., 2004).
4. Conclusions
XRD characterization shows the decreasing of particle size in bentonite-OPBA nanocomposite. SEM results presented particle size uniformity in Bentonite-OPBA nanocomposite. Meanwhile, the FTIR results showed an absorption peak indicating bonding to the nanocomposite, which was also confirmed by the XRF results. XRF results show the content of SiO2 and Al2O3 in the nanocomposite to be applied as a nanofiller.


 nueva página del texto (beta)


